Operational Transconductance Amplifiers Market Size Analysis:
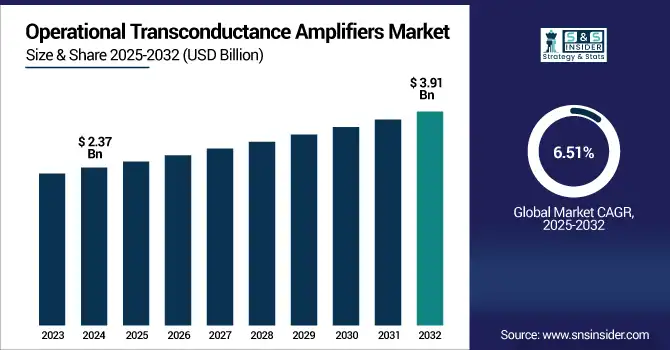
The Operational Transconductance Amplifiers Market Size was valued at USD 2.37 billion in 2024 and is expected to reach USD 3.91 billion by 2032 growing at a CAGR of 6.51% over the forecast period of 2025-2032.
To Get more information on Operational Transconductance Amplifiers Market - Request Free Sample Report
The global market has continued to grow rapidly by growing demand for consumer electronics, industrial automation, and high-performance audio equipment. The report offers thorough research for the top drivers, restraints, opportunities, and challenges. New application areas are being opened up to technologies by the increase in analog systems adoption, trend toward miniaturization, and technology developments. Operational transconductance amplifiers market analysis reveals evolving trends in analog integration. It includes regional performance, key segments and strategic developments that are shaping the operational transconductance amplifiers market outlook for the forecast period of 2024–2032.
For instance, over 85% of modern smartphones and audio devices utilize analog signal paths where operational transconductance amplifiers play a core role in filtering and modulation.
The U.S. operational transconductance amplifiers market size was USD 0.51 billion in 2024 and is expected to reach USD 0.82 billion by 2032, growing at a CAGR of 6.21% over the forecast period of 2025–2032.
The U.S. is witnessing the most increase in the demand for analog signal processing components within consumer electronics, automotive, and industrial automation sectors. Continuous innovation is driven by the presence of leading semiconductor manufacturers and cutting-edge R&D infrastructure. That is particularly relevant for emerging areas which are only predicted to rise, such as electric vehicles, 5G, and smart consumer devices, where operational transconductance amplifiers have been increasingly integrated to enable analog performance and highly reliable systems.
For instance, over 70% of active U.S. cellular base stations in urban areas now incorporate operational transconductance amplifiers-based analog front-end components for signal clarity and modulation.
Operational Transconductance Amplifiers Market Dynamics:
Key Drivers:
-
Integration in EVs, Audio Systems, and 5G Infrastructure Accelerates Market Penetration
The growing penetration of operational transconductance amplifiers in electric vehicles (EVs), high-quality sound systems, and 5G telecom infrastructure boost the growth of operational transconductance amplifiers market. More importantly, it is well known that battery monitoring and motor controlling are the core functionalities and make use of dominant analog components in EV, meanwhile, the linear amplification characteristics of operational transconductance amplifiers have also played a critical role in audio systems. Even in telecom base stations and mobile networks where they are used for analog front-end design and signal integrity solutions. As the industry moves toward connected and electrified ecosystems, operational transconductance amplifiers gains fundamental performance improvements with stability, linearity, and low distortion, which justifies their adoption across early and mainstream technologies.
For instance, over 90% of discrete analog audio processors in premium sound equipment still rely on operational transconductance amplifiers stages for filtering, gain control, and envelope shaping.
Restraints:
-
Complex Design Architecture and Sensitivity to Temperature Impacts Performance Consistency
Operational transconductance amplifiers are widely used in transceivers and can also be placed alongside digital circuits and systems, but their design and implementation get highly complicated by the need for various calibration and compensation techniques, which can affect both design cycles and cost. Operational transconductance amplifiers have a temperature sensitivity, which affects bias currents and linearity, and this can be important in harsh environment. Additional circuitry or thermal compensation is needed to match the performance across applications, such as automotive or aerospace. This makes fast integration difficult for low-end or low-cost devices, preventing wider usage in simple consumer electronics, and leads to increased development time for applications needing precision and reliability.
Opportunities:
-
Surge in IoT and Wearable Devices Fuels Demand for Compact and Efficient Amplification
This growing adoption of IoT and wearable electronics is demanding the need for compact and power-efficient amplification circuits, such as operational transconductance amplifiers. Continuous sensing enables signal conditioning and low-power operation of these devices, which is possible with operational transconductance amplifiers. Novel in their flexibility in analog computation, filtering and current-driven designs, they are crucial in fitness trackers, smart health monitoring and remote-sensing modules. Operational transconductance amplifiers market growth is fueled by evolving smart device applications. With the planned growth in IoT devices, particularly in smart homes and in the health care space, this is a growing market opportunity for operational transconductance amplifiers.
For instance, over 60% of IoT edge devices operate in ultra-low-power mode, where OTA-based analog computation helps reduce power-hungry digital cycles.
Challenges:
-
Limited Availability of Skilled Analog Designers Slows Down Innovation and Adoption
One of the biggest issues with the operational transconductance amplifiers market is the lack of qualified analog IC designers. But unlike these digital systems, analog circuits require a solid grasp of continuous-time signal behavior, strategies for dealing with noise, and layout considerations. The reduced programs and expert designs on this front are fueling the talent gap, limiting how fast can dome innovating in Operational Transconductance Amplifiers can be invented. Mainly, this impacts small and mid-scale manufacturers, thereby decelerating product development cycles and limiting adoptions in fast-paced industries, such as automotive and consumer electronics.
Operational Transconductance Amplifiers Market Segmentation Analysis:
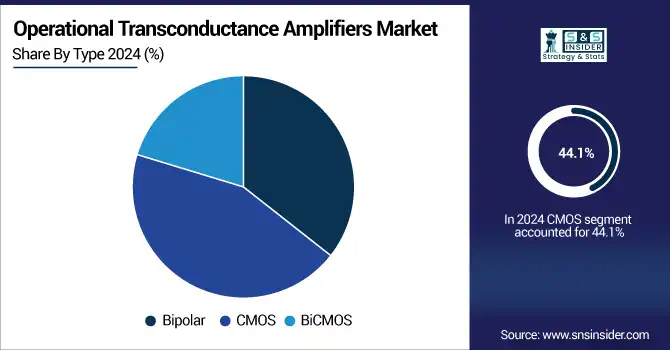
By Type
The CMOS segment held the largest market share in terms of revenue, accounting to roughly 44.1% for 2024, due to its low power consumption, scalability, and compatibility with modern IC technology. For extreme precision analog processes, such as CMOS Operational Transconductance Amplifiers, Texas Instruments has a huge selection of CMOS Operational Transconductance Amplifiers, they serve different precision analog applications. Operational transconductance amplifiers market trends highlight rising preference for CMOS solutions. Owing to the most efficient-to-power ratio, integration of small-sized units, and increasing production and utilization of smartwatches, IoT equipment, and consumer electronics requiring dense analog performance, the CMOS segment is estimated to witness the highest CAGR of nearly 7.30% during the period of 2024–2032.
By Frequency Range
The Mid Frequency segment accounted for the largest revenue share of approximately 39.6% in 2024. The wide spread of its use in audio, industrial, and communication systems gives it this dominance. This range provides excellent mid-range performance for general purpose analog signal processing. The operational transconductance amplifiers provided by Analog Devices, Inc. are designed for this frequency band, which boosts their market share. This range is preferred by many industries for signal clarity and stability. Therefore, this range is utilized widely in different analog applications related to control and communications.
High Frequency will garner the fastest CAGR, around 6.93% during 2024–2032. This growth is fueled by rising demand for RF communications, data acquisition systems, and high-speed sensor applications. These kinds of Operational Transconductance Amplifiers are essential for next-gen telecom and broadband solutions. To address this evolving system demand, the company is developing high-frequency analog solutions at Infineon Technologies. This segment will experience significant ramping over the next several years as bandwidth and data rate requirements continue growing.
By Application
In 2024, Consumer Electronics accounted for a revenue share of 26.5% due to high adoption of operational transconductance amplifiers in smartphones, tablets, and smart wearables software updates of running applications mainly in smartphones. The nature of these applications demands compact, power-efficient analog components, further driving operational transconductance amplifiers adoption. Multimedia signal processing in portable electronics with solutions from ON Semiconductor. Due to rising demand for audio quality, low distortion, and miniaturization, this segment continues to dominate even in the high-volume, low-power device environments.
The automotive segment is expected to attain the highest growth rate of 8.87% in the forecast period of 2024–2032. The rise is attributed to growing use of Operational Transconductance Amplifiers in EV battery management, Operational Transconductance Amplifiers systems and ADAS technologies. Automotive manufacturers are pushing demand for improved precision and thermal stability in analog circuitry. Automotive-grade operational transconductance amplifiers, supported by NXP Semiconductors with electric and autonomous vehicle platforms maturing, the demand for reliable, high-performance analog signal paths is accelerating operational transconductance amplifiers penetration in this segment.
By End-User
In 2024, consumer electronics led the operational transconductance amplifiers market share of 34.8% owing to the large-scale implementation of operational transconductance amplifiers in mobile phones, multimedia systems, and audio devices. The division enjoys a rise in demand due to the global market for small and energy-efficient electrical equipment. Versatile operational transconductance amplifiers components provided by companies such as STMicroelectronics are suitable for integration into portable devices. Wide adoption of smart technologies and connected devices guarantees continuous use of the over-the-air paradigm, positioning the operational transconductance amplifiers segment to be by far the most commercially dominant segment during the baseline year and likely well into the future.
Automotive end-user segment is expected to grow at more than 8.56% CAGR over 2024-2032. In EV and hybrid vehicles, whenever powertrain controls, motor drivers, and safety systems need to be employed, the workhorse is analog amplifiers, such as operational transconductance amplifiers. Focused on advanced analog ICs for automobiles, Renesas Electronics creates devices well-suited to automotive environments. Combined with enhanced safety requirements, smart vehicle trends, and the transition to electrification, this demands the very best in high-operational transconductance amplifiers at the rapid pace of innovation in this segment.
Operational Transconductance Amplifiers Market Regional Insights:
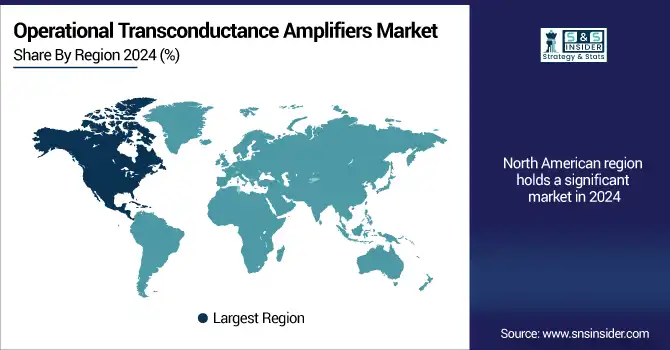
North America plays a vital role, with growing demand from consumer electronics, office automation, industrial automation and automotive sectors. The region derives from high-end semiconductor R&D, the global presence of key players, and early adopters of new analog technologies. Regional growth is driven by the U.S. with increased developments in EV systems, 5G networks, and defense electronics.
-
The U.S. dominates the North American operational transconductance amplifiers industry due to its strong semiconductor industry, advanced R&D infrastructure, and high demand across automotive, defense, and consumer electronics sectors, supported by leading companies, such as Texas Instruments and Analog Devices.
Asia Pacific accounted for the largest revenue share of approximately 31.7%, owing to the strong manufacturing base coupled with low-cost production and growing industrial and consumer electronics demand in the region. Asia Pacific is also set to witness the fastest CAGR of approximately 6.87% during 2024–2032, owing to an increase in investment in semiconductor fabs, increased adoption of EVs, and a high penetration of smartphones and smart devices in countries such as China, South Korea, and India.
-
China leads the Asia Pacific operational transconductance amplifiers market owing to its massive electronics manufacturing base, rapid industrialization, and rising adoption of analog components in consumer devices, electric vehicles, and telecommunication infrastructure, supported by strong domestic production and government-driven tech development initiatives.
Europe boasts this high demand across automotive, industrial automation and telecommunications sectors, which is driving the operational transconductance amplifiers market. This will be supported by the presence of established automotive OEMs, growing investments in EV technology, and stringent regulatory standards for electronic components in the region.
-
Germany dominates the European operational transconductance amplifiers market due to its strong automotive and industrial automation sectors. With major OEMs and electronics manufacturers based in the country, and companies, such as Infineon Technologies driving innovation, Germany leads in both demand and technological advancement for Operational Transconductance Amplifiers.
The UAE accounted for the largest market share of the operational transconductance amplifiers in the Middle East & Africa owing to smart infrastructure development and growing demand for electronics. As far as Latin America is concerned, Brazil also leads due to the presence of an increasing automotive and industrial market. Both countries gain from growth in analog components with modernization technologies and localized manufacturing.
Get Customized Report as per Your Business Requirement - Enquiry Now
Operational Transconductance Amplifiers Companies are:
Major Key Players in Operational Transconductance Amplifiers Market are Texas Instruments, Analog Devices, Inc., ON Semiconductor, STMicroelectronics, Infineon Technologies AG, NXP Semiconductors, Maxim Integrated, Renesas Electronics Corporation, ROHM Semiconductor, Cirrus Logic, Microchip Technology Inc., Toshiba Corporation, Diodes Incorporated, Skyworks Solutions, Semtech Corporation, Monolithic Power Systems, Honeywell International Inc., Broadcom Inc., Qualcomm Incorporated, and Vishay Intertechnology and others.
Recent Developments:
-
In February 2025, Texas Instruments announced that the classic LM13700 dual OTA is being phased out, leading hobbyist and industrial communities to explore alternative suppliers. Enthusiasts reported end‑of‑life concerns and potential counterfeit issues when sourcing LM13700 ICs for buffer and filter circuits.
-
In February 2025, Benchmark elevated Analog Devices to a Buy rating, citing growth potential in its mixed-signal ICs, including OTA-enhanced analog front ends. The confidence reflects increasing demand driven by automotive and AI/data center applications.
| Report Attributes | Details |
| Market Size in 2024 | USD 2.37 Billion |
| Market Size by 2032 | USD 3.91 Billion |
| CAGR | CAGR of 6.51% From 2025 to 2032 |
| Base Year | 2024 |
| Forecast Period | 2025-2032 |
| Historical Data | 2021-2023 |
| Report Scope & Coverage | Market Size, Segments Analysis, Competitive Landscape, Regional Analysis, DROC & SWOT Analysis, Forecast Outlook |
| Key Segments | • By Type (Bipolar, CMOS and BiCMOS) • By Frequency Range (Low Frequency (<1 MHz), Mid Frequency (1 MHz – 10 MHz) and High Frequency (>10 MHz)) • By Application (Audio Equipment, Consumer Electronics, Industrial, Automotive, Telecommunications and Others) • By End-User (Consumer Electronics, Automotive, Industrial, Telecommunications and Others) |
| Regional Analysis/Coverage | North America (US, Canada, Mexico), Europe (Germany, France, UK, Italy, Spain, Poland, Turkey, Rest of Europe), Asia Pacific (China, India, Japan, South Korea, Singapore, Australia,Taiwan, Rest of Asia Pacific), Middle East & Africa (UAE, Saudi Arabia, Qatar, South Africa, Rest of Middle East & Africa), Latin America (Brazil, Argentina, Rest of Latin America) |
| Company Profiles | Texas Instruments, Analog Devices, Inc., ON Semiconductor, STMicroelectronics, Infineon Technologies AG, NXP Semiconductors, Maxim Integrated , Renesas Electronics Corporation, ROHM Semiconductor, Cirrus Logic, Microchip Technology Inc., Toshiba Corporation, Diodes Incorporated, Skyworks Solutions, Semtech Corporation, Monolithic Power Systems, Honeywell International Inc., Broadcom Inc., Qualcomm Incorporated and Vishay Intertechnology |
Frequently Asked Questions
Ans: Asia Pacific dominated the Operational Transconductance Amplifiers Market in 2024.
Ans: The Consumer Electronics segment dominated the Operational Transconductance Amplifiers Market in 2024.
Ans: Rising demand for low-power, high-performance analog signal processing in consumer electronics, automotive systems, and IoT devices drives market growth.
Ans: The Operational Transconductance Amplifiers Market size was USD 2.37 Billion in 2024 and is expected to reach USD 3.91 Billion by 2032.
Ans: The Operational Transconductance Amplifiers Market is expected to grow at a CAGR of 6.51% from 2025-2032.
Get in Touch
