Optical Interconnect Market Report Scope & Overview:
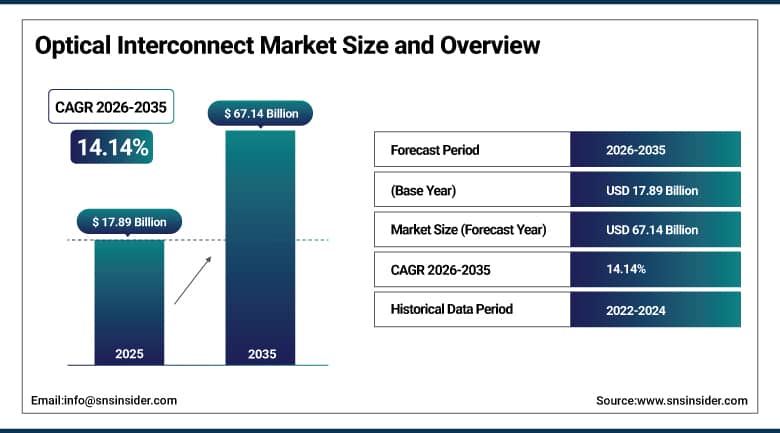
The Optical Interconnect Market was valued at USD 17.89 billion in 2025 and is expected to reach USD 67.14 billion by 2035, growing at a CAGR of 14.14% from 2026–2035.
Optical interconnects market is seeing the structural demand shift due to the intrinsic physical limitations of copper electrical interconnects in light of the increasing demands imposed by data traffic growth, artificial intelligence computing workload growth, and hyperscale cloud computing infrastructure expansion. Optical interconnects utilize light signals traveling over optical fibers and photonic waveguides to transfer information compared to copper cables carrying electrical signals. Optical interconnects have the clear advantage in terms of bandwidth capacity, signal latency, and power consumption efficiency when the data rates exceed 100 Gbps and distances are above several meters. More than 80 percent of data centers in the hyperscale segment utilize optical interconnects for internal connections instead of standard copper cabling. This indicates the fact that the optical interconnects are already proven to be an inherent component of today's cloud computing infrastructure. The combination of the demands brought about by AI-scale computing, GPU-centric cluster training, the densification of 5G networks, fronthaul connectivity, and coherent optical transport at speeds up to 800 Gbps and 1.6 Tbps is leading to unprecedented demand acceleration for all types of optical interconnect products.
The optical interconnect market's 14.14% CAGR from 2026 to 2035 reflects the structural inevitability that every layer of the global compute and communications stack is simultaneously demanding more bandwidth, lower latency, and improved energy efficiency per bit, and that optical interconnects represent the only technically credible path to delivering these performance requirements at the scale demanded by AI training clusters, hyperscale cloud platforms, 5G networks, and high-performance computing environments. Broadcom's May 2025 unveiling of its third-generation Co-Packaged Optics technology supporting 200 Gbit/s per lane and Corning's collaboration with Broadcom on CPO infrastructure for AI data centers exemplify the innovation velocity sustaining the market's exceptional growth through the forecast period.
Optical Interconnect Market Size and Forecast
-
Market Size in 2025: USD 17.89 Billion
-
Market Size by 2035: USD 67.14 Billion
-
CAGR: 14.14% from 2026 to 2035
-
Base Year: 2025
-
Forecast Period: 2026–2035
-
Historical Data: 2022–2024
To Get More Information On Optical Interconnect Market - Request Free Sample Report
Optical Interconnect Market Trends
-
Accelerating deployment of Co-Packaged Optics technology that integrates optical transceivers directly within switch and AI accelerator packages, eliminating pluggable transceiver power and signal integrity constraints while enabling 70% lower energy dissipation and dramatically higher bandwidth density for hyperscale AI cluster connectivity.
-
Growing adoption of silicon photonics platforms that integrate optical functionality directly onto silicon chips through CMOS-compatible fabrication processes, enabling mass production of low-cost, high-performance optical components at semiconductor manufacturing scale for AI accelerator and data center applications.
-
Rapid expansion of 800G and emerging 1.6T coherent optical transceiver deployment in metro and long-haul data center interconnect applications, enabling carriers and cloud operators to collapse multiple optical amplification and regeneration stages into single-span coherent links with significantly lower operational costs.
-
Increasing focus on chip-level and board-level optical interconnects for AI training cluster connectivity, where traditional electrical PCIe and NVLink interconnects face fundamental bandwidth and power limitations at the GPU-to-GPU and memory-to-processor bandwidths required by large language model training workloads.
-
Rising adoption of multifiber mode cable assemblies including MPO and MTP connectors for intra-data center and rack-level optical connectivity, enabling the high-density, short-reach optical link deployments required by AI server clusters where thousands of optical connections must be installed within compact data center footprints.
-
Growing investment by hyperscale operators including Amazon Web Services, Microsoft Azure, and Google Cloud in proprietary optical interconnect silicon and custom transceiver designs optimised for their specific AI and cloud infrastructure architectures, reducing dependence on merchant silicon and creating new demand vectors for optical component suppliers.
-
Accelerating 5G fronthaul and midhaul network densification creating growing demand for optical interconnects between base stations and centralized radio access network processing sites, as network operators deploy small cell architectures requiring dense optical connectivity across urban environments.
U.S. Optical Interconnect Market Size Outlook:
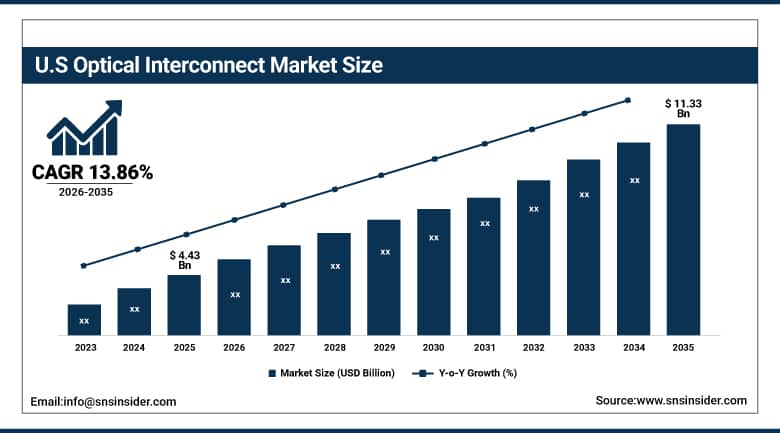
The U.S. Optical Interconnect Market was valued at USD 4.43 billion in 2025 and is expected to reach USD 11.33 billion by 2035 at a CAGR of 13.86%, driven by its dominant position in hyperscale data center infrastructure and silicon photonics innovation.
United States represents the world's largest single-country optical interconnect market, anchored by the extraordinary concentration of hyperscale data center capacity operated by Amazon Web Services, Microsoft Azure, Google Cloud, and Meta that collectively consume the world's largest volumes of optical transceiver and fiber connectivity hardware. The U.S. leads global silicon photonics R&D investment through university research programmes, national laboratory initiatives, and the commercial R&D programmes of Broadcom, Intel, and Cisco that are defining the co-packaged optics and silicon photonics technology standards that will govern the global optical interconnect market through the forecast period. The explosive growth of U.S.-based AI infrastructure investment, including the announced multi-hundred-billion-dollar data center capital expenditure programmes of Microsoft, Google, Amazon, and Meta, is directly translating into exceptional near-term optical interconnect demand growth that positions the U.S. for sustained market leadership throughout the forecast horizon.
In March 2025, Broadcom Inc. announced at OFC 2025 the expansion of its optical interconnect solutions for AI infrastructure including co-packaged optics, 200G per lane DSP, 400G optics, PCIe Gen6 over optics, and 800G AEC retimers, enabling high-bandwidth, low-power, and scalable AI networks. Simultaneously, Corning Incorporated announced a collaboration with Broadcom on CPO infrastructure for AI data centers, supplying advanced optical components for Broadcom's 51.2 Tbps Bailly Ethernet switch. These simultaneous product announcements confirm the exceptional pace of U.S.-driven optical interconnect innovation that is sustaining the market's technology leadership and commercial growth through the 2026 to 2035 forecast period.
Optical Interconnect Market Segment Insights
-
By Product, Optical Transceivers dominated with approximately 26.7% revenue share in 2025; Silicon Photonics is expected to be the fastest-growing product segment at approximately 12.82% CAGR from 2026 to 2035.
-
By Interconnect Level, Metro and Long-Haul held the highest revenue share of approximately 42% in 2025; Chip and Board-Level Optical Interconnect is expected to grow at the fastest CAGR of approximately 24.5% from 2026 to 2035.
-
By Fiber Mode, Single Fiber Mode dominated with approximately 61.5% revenue share in 2025; Multifiber Mode is expected to grow at the fastest CAGR of approximately 14.68% from 2026 to 2035.
-
By Data Rate, the 10 to 50 Gbps segment held the highest revenue share of approximately 30.5% in 2025; the More than 100 Gbps segment is projected to grow at the fastest CAGR of approximately 15.53% from 2026 to 2035.
-
By Application, Data Communication led with approximately 58.5% revenue share in 2025; Telecommunication is expected to see significant growth driven by 5G infrastructure deployment.
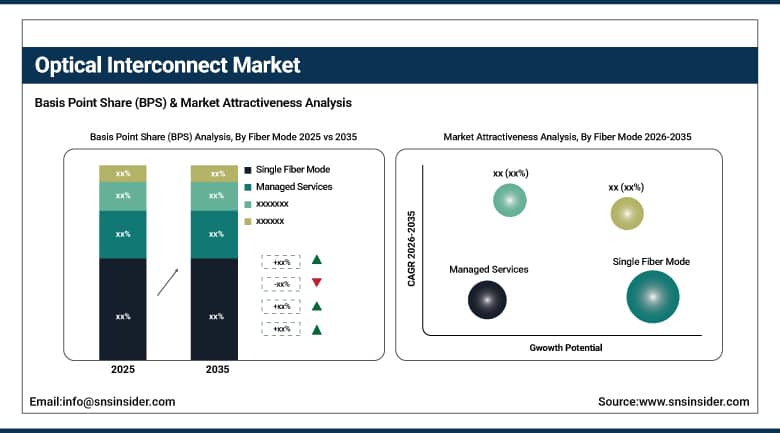
By Fiber Mode, Single Fiber Mode dominates, Multifiber Mode grows fastest
Single Fiber Mode dominates the Optical Interconnect market due to its superior bandwidth capacity, longer transmission distance, and reduced signal attenuation. It is widely adopted in hyperscale data centers, telecom backbones, and high-performance computing environments where reliable long-distance connectivity and high-speed data transfer are critical for operational efficiency.
Multifiber Mode grows fastest in the Optical Interconnect market owing to rising demand for compact, high-density connectivity solutions in AI clusters and cloud infrastructure. Multifiber systems support faster parallel data transmission, simplified cable management, and scalability, making them increasingly preferred for next-generation short-distance, high-capacity networking applications.
By Product, Optical Transceivers dominate, Silicon Photonics expected to grow fastest
Optical Transceivers dominated the global Optical Interconnect Market in 2025 with approximately 26.7% of total revenues, reflecting their established role as the foundational connectivity component enabling high-speed communication between servers, switches, and routers across data center and telecommunications networks. Optical transceivers convert electrical signals to optical for transmission and back to electrical for processing at the receiving end, serving as the critical interface between the optical fiber transmission medium and the electrical processing systems within network equipment. Companies including II-VI Incorporated, Lumentum, and Coherent have advanced transceiver technology from 100G through 400G and into 800G products that are now deployed in leading hyperscale data centers, enabling the bandwidth density required for AI cluster interconnectivity. The rapid advancement from 400G to 800G to emerging 1.6T transceiver technologies is sustaining strong revenue growth within the optical transceiver segment despite the commoditisation pressure on mature product generations.
The market for Silicon Photonics is expected to be the fastest-growing product segment, growing at a rate of around 12.82% during the forecast period of 2026-2035 due to the technology’s unique capability to incorporate optical functionalities on standard silicon chips using CMOS-based processes. Silicon photonics modules developed by companies like Intel, Broadcom, and Cisco are facilitating the incorporation of modulators, photodiodes, and waveguides in components and chips, gradually substituting bulky optical component modules with photonic circuits, which have resulted in smaller sizes, lower power requirements, and reduced costs per bit.
By Interconnect Level, Metro and Long-Haul dominates, Chip and Board-Level grows fastest
Metro and Long-Haul optical interconnect retained the highest revenue share at approximately 42% of the Optical Interconnect Market in 2025, reflecting the extensive existing deployment of DWDM optical backbone infrastructure connecting cities, regions, and countries that generates recurring equipment upgrade revenue as operators expand capacity and transition to newer coherent transceiver generations. Metro and long-haul optical infrastructure provides the bandwidth backbone for internet traffic growth, cloud service delivery, and enterprise wide-area networking, creating a large and stable installed base that generates continuous upgrade demand as data traffic volumes grow. Ciena Corporation, Nokia, and Infinera are key suppliers in this segment, continuously advancing coherent optical technology that enables transmission of multiple terabits per second over existing fiber infrastructure.
Chip and Board-Level Optical Interconnect is forecasted to exhibit the highest growth in terms of segment CAGR at 24.5% during the period from 2026 to 2035 due to the urgent need for optics for connectivity among AI processors, memory systems, and accelerators as electrical interconnects reach fundamental limits in terms of bandwidth and power consumption. There will be a need for optical inter-chip connections capable of providing terabits per second bandwidth among processor chips and consuming only picojoules per bit of power. Ayar Labs, Lightmatter, and Ranovus are some of the players that are working on commercial photonic interconnect solutions that will allow replacing electrical high-speed SerDes with optical counterparts, mainly focusing on AI accelerators and HPC processors where bandwidth and energy are the key bottlenecks.
Optical Interconnect Market Regional Analysis:
|
Region |
Major Country |
Share within Region (%) |
|---|---|---|
|
North America |
United States |
~82% |
|
Europe |
Germany |
~29% |
|
Asia Pacific |
China |
~46% |
|
Middle East & Africa |
UAE |
~27% |
|
Latin America |
Brazil |
~43% |
North America Optical Interconnect Market Insights
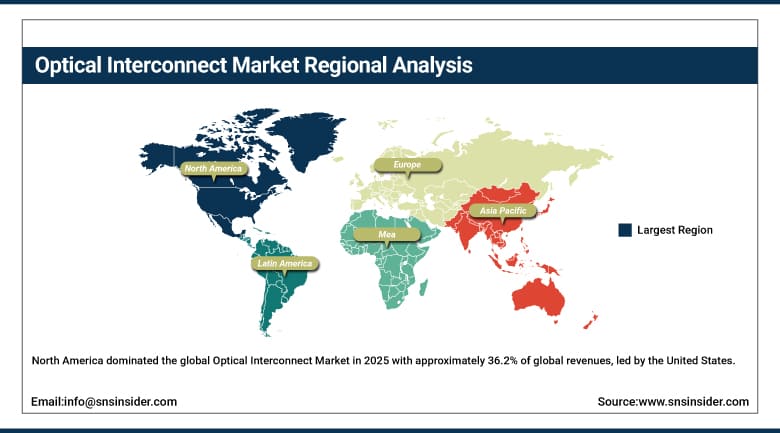
North America dominated the global Optical Interconnect Market in 2025 with approximately 36.2% of global revenues, led by the United States. North American market leadership is anchored by the extraordinary concentration of hyperscale data center infrastructure, the world's highest investment in AI computing capacity, and the commercial presence of leading optical interconnect technology companies including Broadcom, Cisco, Intel, Lumentum, and Coherent. The U.S. government's semiconductor and advanced manufacturing investment initiatives under the CHIPS and Science Act are further strengthening domestic optical component manufacturing capabilities, sustaining competitive advantage through the forecast period.
Get Customized Report as Per Your Business Requirement - Enquiry Now
Asia Pacific Optical Interconnect Market Insights
Asia Pacific region will experience the highest CAGR of around 14.99% from 2026 to 2035 due to rapid urbanization, high levels of data consumption, wide-ranging 5G deployment in China, India, Japan, and South Korea, as well as huge investments made in cloud computing infrastructures and high-speed connectivity solutions by both the public and private sectors. China will dominate regional market expansion owing to its aggressive construction of data centers that provide local cloud computing platforms, government investment in its own semiconductor and photonic technologies, and the need for denser 5G networks, which will require substantial optical fronthaul connectivity. In India, the growing digital economy and construction of data centers are driving increased demand for optical interconnects.
Europe Optical Interconnect Market Insights
Europe represents a significant optical interconnect market anchored by extensive telecommunications backbone infrastructure, growing data center investment across Germany, Ireland, the Netherlands, and Sweden, and the 5G network rollout across major European economies. European optical interconnect demand is further supported by EU-funded research programmes in silicon photonics and integrated photonics manufacturing, with the European Photonics Industry Consortium coordinating industry-academic collaboration to develop indigenous European photonic component manufacturing capabilities. Germany leads European optical interconnect adoption through its advanced manufacturing sector, sophisticated telecommunications infrastructure, and strong engineering education system producing photonics talent.
Middle East & Africa and Latin America Optical Interconnect Market Insights
MEA and Latin America are growing optical interconnect markets, driven by data center construction, telecommunications network modernisation, and submarine cable landing station development. The UAE leads MEA adoption through its world-class data center infrastructure serving regional cloud services and its extensive submarine cable connectivity to Europe, Asia, and Africa requiring high-capacity optical transmission systems. Brazil dominates Latin American optical interconnect revenues, supported by its extensive telecommunications infrastructure, growing domestic cloud adoption, and government investment in digital connectivity programmes extending broadband access across underserved regions.
Optical Interconnect Market Growth Drivers:
-
Explosive AI compute infrastructure investment and hyperscale data center expansion creating unprecedented optical interconnect demand across all deployment levels
The primary structural growth driver for the Optical Interconnect Market is the extraordinary scale and pace of AI infrastructure investment that is simultaneously driving optical interconnect demand at the chip level, the rack level, the data center level, and the metropolitan network level. Hyperscale operators including Microsoft, Google, Amazon, and Meta have announced combined data center capital expenditure programmes exceeding USD 300 billion for 2025 alone, with the majority of this investment directed toward AI-optimised facilities that require dramatically higher optical connectivity density than conventional cloud computing infrastructure. Each AI training cluster containing thousands of GPU accelerators requires high-bandwidth optical interconnects to enable the collective compute coordination that large language model training demands, creating sustained structural demand that is growing in direct proportion to AI model complexity and training scale.
In May 2025, Broadcom unveiled its third-generation Co-Packaged Optics technology supporting 200 Gbit/s per lane, specifically designed for AI-scale networks and demonstrating ecosystem readiness with improved port density and power efficiency for large-scale AI cluster connectivity. This announcement, combined with Corning's collaboration with Broadcom on CPO infrastructure supplying advanced optical components for the 51.2 Tbps Bailly Ethernet switch, represents the technical validation of CPO as a commercially ready architecture that will drive the transition from pluggable to co-packaged optical interconnects across hyperscale AI infrastructure through the 2026 to 2035 forecast period.
Optical Interconnect Market Restraints
-
High per-component costs of advanced photonic integration, manufacturing yield challenges for silicon photonics, and complexity of optical-electrical co-design limiting rapid adoption
A significant restraint on the Optical Interconnect Market is the substantial cost premium of advanced optical interconnect components relative to electrical interconnect alternatives, particularly for chip-level and board-level photonic integration where silicon photonics manufacturing yields and packaging costs remain challenging at scale. The co-design complexity of optical and electrical systems in co-packaged optics architectures requires deep cross-disciplinary expertise spanning photonics, semiconductor design, advanced packaging, and thermal management that is concentrated in relatively few organisations globally. Supply chain concentration for certain rare earth materials used in optical fiber manufacturing and specialized III-V semiconductor compounds used in laser and photodetector components creates strategic vulnerability to geopolitical supply disruptions.
Optical Interconnect Market Opportunities
-
Co-packaged optics commercialisation, AI accelerator optical I/O integration, and 6G network optical fronthaul development
The commercialisation of co-packaged optics within mainstream AI switch and accelerator products represents the optical interconnect market's most transformative near-term value creation opportunity, as CPO technology delivers bandwidth density and energy efficiency improvements that no alternative electrical or pluggable optical approach can match at AI cluster scale. The integration of photonic I/O directly within AI processor chiplets, enabling optical-speed connectivity between GPU dies that eliminates the electrical inter-chip bandwidth bottleneck constraining current AI accelerator architectures, represents the highest-value and most technically demanding photonics integration frontier. The development of 6G network optical fronthaul infrastructure, requiring terahertz frequency wireless transmission supported by ultra-high-capacity optical fiber backhaul, will create a new generation of optical interconnect demand that begins deployment toward the end of the forecast period.
Recent Developments:
-
May 2025: Broadcom unveiled its third-generation Co-Packaged Optics technology supporting 200 Gbit/s per lane for AI-scale networks, demonstrating improved port density and power efficiency and confirming CPO's commercial readiness for next-generation hyperscale AI switch deployment.
-
May 2025: Corning Incorporated announced a collaboration with Broadcom on co-packaged optics infrastructure for AI data centers, supplying advanced optical components for Broadcom's 51.2 Tbps Bailly Ethernet switch and reinforcing the supply chain ecosystem for CPO technology deployment.
Optical Interconnect Market Key Players:
-
Broadcom Inc.
-
Cisco Systems Inc.
-
Lumentum Holdings Inc.
-
Coherent Corp. (II-VI Incorporated)
-
Ciena Corporation
-
Nokia Corporation
-
Infinera Corporation
-
Intel Corporation (Intel Silicon Photonics)
-
Corning Incorporated
-
CommScope Holding Company Inc.
-
Ayar Labs Inc.
-
Lightmatter Inc.
-
HiSilicon Technologies Co. Ltd.
-
Ranovus Inc.
-
ColorChip Ltd.
-
Poet Technologies Inc.
-
Sumitomo Electric Industries Ltd.
-
Furukawa Electric Co. Ltd.
-
Finisar Corporation (Coherent)
-
Oclaro Inc. (Coherent)
Optical Interconnect Market Report Scope:
| Report Attributes | Details |
|---|---|
| Market Size in 2025 | USD 17.89 Billion |
| Market Size by 2035 | USD 67.14 Billion |
| CAGR | CAGR of 14.14% From 2026 to 2035 |
| Base Year | 2025 |
| Forecast Period | 2026-2035 |
| Historical Data | 2022-2024 |
| Report Scope & Coverage | Market Size, Segments Analysis, Competitive Landscape, Regional Analysis, DROC & SWOT Analysis, Forecast Outlook |
| Key Segments | •By Product (Optical Transceivers, Active Optical Cables, Optical Engines, Silicon Photonics, Others) •By Interconnect Level (Chip and Board-Level, Rack Level, Metro and Long-Haul) •By Fiber Mode (Single Fiber Mode, Multifiber Mode) •By Data Rate (Less than 10 Gbps, 10 to 50 Gbps, 50 to 100 Gbps, More than 100 Gbps) •By Application (Data Communication, Telecommunication) |
| Regional Analysis/Coverage | North America (US, Canada), Europe (Germany, UK, France, Italy, Spain, Russia, Poland, Rest of Europe), Asia Pacific (China, India, Japan, South Korea, Australia, ASEAN Countries, Rest of Asia Pacific), Middle East & Africa (UAE, Saudi Arabia, Qatar, South Africa, Rest of Middle East & Africa), Latin America (Brazil, Argentina, Mexico, Colombia, Rest of Latin America). |
| Company Profiles | Broadcom Inc., Cisco Systems Inc., Lumentum Holdings Inc., Coherent Corp. (II-VI Incorporated), Ciena Corporation, Nokia Corporation, Infinera Corporation, Intel Corporation (Intel Silicon Photonics), Corning Incorporated, CommScope Holding Company Inc., Ayar Labs Inc., Lightmatter Inc., HiSilicon Technologies Co. Ltd., Ranovus Inc., ColorChip Ltd., Poet Technologies Inc., Sumitomo Electric Industries Ltd., Furukawa Electric Co. Ltd., Finisar Corporation (Coherent), Oclaro Inc. (Coherent) |
Get in Touch
