image

Silicon Photonics Market Size:

Silicon Photonics Market Revenue Analysis

Get More Information on Silicon Photonics Market - Request Sample Report

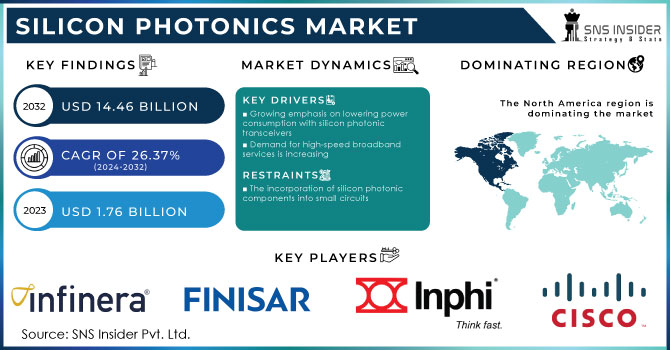
The Silicon Photonics Market size is expected to be valued at USD 1.76 Billion in 2023. It is estimated to reach USD 14.46 Billion by 2032, growing at a CAGR of 26.37% during 2024-2032.

The Silicon Photonics Market is witnessing significant growth on the back of technological advancements and an increasing need for high-speed data transfer. Due to the increasing popularity of cloud computing, big data, and the Internet of Things (IoT), data centers must now manage large volumes of data quickly. The exponential rise in data traffic is a major factor fueling the growth of the silicon photonics market. Silicon photonics provides a high-bandwidth optical communication solution on silicon chips, which can boost the performance of data centers and telecommunications infrastructure. In the year 2023, there was a significant rise in worldwide data usage due to different technological progress and changes in digital consumption trends. Global IP traffic reached around 6.7 zettabytes (ZB) at the end of the year, showing a 26% rise from the previous year's 5.3 ZB. There was a significant surge in mobile data traffic, with a 26% increase, totaling about 109 exabytes (EB) monthly.

Silicon photonics is used in the telecommunications industry to develop optical transceivers and modulators for data transmission that is faster and more efficient over long distances. This has become necessary to meet the increasing demand for higher access speeds of the internet and other access systems. Apart from this, owing to decreased consumption of power and reduced cost when compared to the conventional methods of telecommunication, telecom operators have started adopting silicon photonics technology. The Bipartisan Infrastructure Law has allotted USD 65 billion for upgrading the broadband infrastructure throughout the United States. This law has included the Broadband Equity, Access, and Deployment (BEAD) Program as one of the main projects and has allotted USD 42.45 billion to the states and territories to expand broadband access. Apart from these, the Digital Equity Act has allotted USD 2.75 billion to achieve digital equity and USD 1.44 billion has been made available to build state capacity for addressing the digital divide.

Silicon Photonics Market Dynamics:

Drivers

  • Growing emphasis on lowering power consumption with silicon photonic transceivers

The need to reduce power consumption continues to drive the silicon photonics market. This trend is mostly prominent in the development and outfitting of silicon photonic transceivers. In practical terms, with data centers and telecommunication networks continuing to grow and meeting the demand for higher data rates and bandwidth sizes, the performance pressure is growing. Additionally, the equipment must be energy-efficient to address sustainability considerations, attracting a higher demand for such devices. In this context, silicon photonic transceivers provide a clear benefit since they use the natural power advantage of silicon-based optical equipment to transmit data faster and with less power waste compared to traditional electronic transceivers.

  • Demand for high-speed broadband services is increasing

The market for silicon photonics is booming due to the increasing demand for ultra-fast broadband services. As the demand for data is growing at a rapid pace across the globe, high-speed internet has become the need of the hour. With the prevalent use of cloud services, streaming platforms, and other online services, the demand for data transmission services has surged. In addition, the rapid increase in smartphone and portable device users is making it tougher for traditional copper-based networks to withstand the data consumption demands. The older networks are restricted by their limitations in terms of both bandwidth and distance. However, silicon photonics technology is providing the ultimate solutions to the growing demand for data with its capability of data transmission over larger distances and that too at high speeds. In addition, the technology is highly sustainable as it uses photonic technology to transmit the data. The telecommunication companies across the globe are striving to implement silicon photonics technology to improve their network infrastructure and provide highly efficient ultra-fast broadband services.

Restraints

  • The incorporation of silicon photonic components into small circuits

Although silicon photonics technology is promising for faster data transfer and enhanced performance, it faces serious issues with further integrating optical components into small chips. The main problem arises from the inherent size mismatch of classical electronic elements and usually much larger photonic devices. Their alignment requires substantial engineering and extremely high-quality manufacturing, which is costly and complex. Moreover, silicon is not very efficient as a light source, so lasers also cannot be put on silicon chips. This prevents efficient coupling of mont silicon circuits with lasers, let alone processing the laser on the same chip. Proper location of the circuit in relation to the laser requires appropriate packaging, which adds to the cost. Consequently, it is quite difficult to introduce silicon photonic circuitry at the scale of miniaturized low-cost consumer electronics, thus limiting the growth of the market concerning small highly demanded devices.

Silicon Photonics Market Segment Overview:

By Product

The active optical cables segment dominated in 2023 with a market share of over 35%. These cables facilitate a high volume of data transfer to a great distance as compared to copper cables. They minimize the cost of integration concerning traditional optical modules. In addition, these cables are also anticipated to provide streamlined installation processes for HPC projects and data centers, along with other storage applications.

The optical multiplexer segment is anticipated to grow with the fastest CAGR during the forecast period. As the optical multiplexer is crucial for WDM systems, it enables different wavelengths to transfer the data over an optical fiber, thereby reducing the congestion of fibers required in such devices. In addition, the optical multiplexers enable the integration of multiple channel counts, compressing the chip design with minimal power loss. Hence, the advancement in multiplexers aids in enhancing the capacity and efficiency of optical communication systems throughout the forecast period.
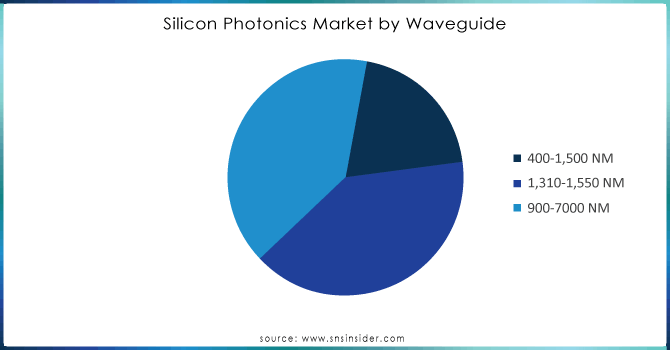
By Waveguide

The 1,310-1,550 NM led the market in 2023 with a market share of over 40%, as the range is widely used in telecommunications and data center applications because it offers optimal performance for long-distance data transmission with minimal attenuation. These wavelengths are ideal for fiber optic communications, which is a major application area for silicon photonics technology. The 1,310-1,550 NM range is also witnessing rapid growth due to increasing demand for high-speed data communication, cloud computing, and data centers. The expansion of internet infrastructure and the rise of 5G networks are further driving this growth. Additionally, advancements in silicon photonics technology are enhancing the performance and cost-effectiveness of devices operating in this wavelength range.

Silicon Photonics Market by Waveguide

Get Customized Report as per your Business Requirement - Request For Customized Report

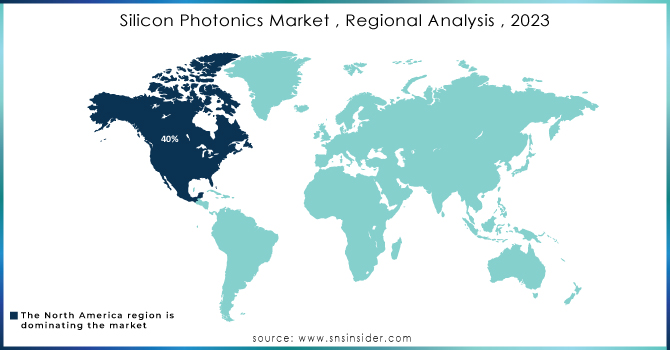
Silicon Photonics Market Regional Analysis:

North America held a major market share of around 40% in 2023. Increased investments by the Canadian government in SiPh chip provider, One Silicon Chip Photonics will also fuel market growth in the region. This, in turn, would result in the development of technology that would speed up driverless cars and drones. Furthermore, during the forecast period, the product demand is also driven by the presence of a large number of silicon photonics technology providers in countries, such as the U.S. and Canada.

Asia Pacific is expected to see the highest CAGR during the forecast period 2024-2032. Increased no of 5G users and the expanded use of smartphones and other smart devices in countries including China, India, and Japan would be one of the prominent factors propelling the product demand. The huge volumes of data are increasing in the region on account of substantial network capabilities. Therefore, to meet the increasing demand for SiPh, the demand for high-capacity data communication solutions will be on the rise. Thus, the Asia particular market will grow during the forecast period.

Silicon-Photonics-Market--Regional-Analysis--2023

KEY PLAYERS:

The key players in the Silicon Photonics market are Cisco Systems, Infinera, Finisar, GlobalFoundries, InPhi, IBM, Rockley Photonics, Intel, IPG Photonics, MACOM Technology, NeoPhotonics, II-VI, STMicroelectronics & Other Players.

Recent Development

  • In March 2024, Intel unveiled advanced 400G DR4 and 800G DR8 Silicon Photonics Optical Engines, designed for high-bandwidth data center interconnects. These engines support data rates of 100G per wavelength and offer improved power efficiency and integration, making them ideal for hyperscale cloud environments.

  • In March 2024, Marvell launched its 3D Silicon Photonics Engine which is the industry’s first 200G 3D Silicon Photonics Engine, providing 2x the bandwidth and 30% lower power consumption per bit compared to 100G interfaces. It integrates numerous components into a single device, optimizing it for high-density AI clusters and cloud data centers.

Silicon Photonics Market Report Scope:

Report Attributes Details
Market Size in 2023 USD 1.76 billion 
Market Size by 2032 USD 14.46 billion 
CAGR CAGR of 26.37% From 2024 to 2032
Base Year 2023
Forecast Period 2024-2032
Historical Data 2020-2022
Report Scope & Coverage Market Size, Segments Analysis, Competitive  Landscape, Regional Analysis, DROC & SWOT Analysis, Forecast Outlook
Key Segments • By Product (Transceivers, Switches, Optical Multiplexers, Variable Optical Attenuators, Optical Engines, Active Optical Cable, Sensors)
• By Component (Photo Detectors, Lasers, Modulators)
• By Waveguide (400-1,500 NM, 1,310-1,550 NM, 900-7000 NM)
• By Application (Military, Defense And Aerospace, IT And Telecommunication, Medical And Life Science, Data Centers And High-Performance Computing, Other)
Regional Analysis/Coverage North America (US, Canada, Mexico), Europe (Eastern Europe [Poland, Romania, Hungary, Turkey, Rest of Eastern Europe] Western Europe] Germany, France, UK, Italy, Spain, Netherlands, Switzerland, Austria, Rest of Western Europe]), Asia Pacific (China, India, Japan, South Korea, Vietnam, Singapore, Australia, Rest of Asia Pacific), Middle East & Africa (Middle East [UAE, Egypt, Saudi Arabia, Qatar, Rest of Middle East], Africa [Nigeria, South Africa, Rest of Africa], Latin America (Brazil, Argentina, Colombia, Rest of Latin America)
Company Profiles Cisco Systems, Infinera, Finisar, GlobalFoundries, InPhi, IBM, Rockley Photonics, Intel, IPG Photonics, MACOM Technology, NeoPhotonics, II-VI, STMicroelectronics
Key Drivers • Growing emphasis on lowering power consumption with silicon photonic transceivers.
• Demand for high-speed broadband services is increasing.
RESTRAINTS • The incorporation of silicon photonic components into small circuits.

Frequently Asked Questions

Ans: The Silicon Photonics Market is expected to grow at a CAGR of 26.37% during 2024-2032.

Ans: Silicon Photonics Market size was USD 1.76 billion in 2023 and is expected to Reach USD 14.46 billion by 2032.

Ans: Growing emphasis on lowering power consumption with silicon photonic transceivers is a major growth factor for the Silicon Photonics Market.

Ans: The transceivers segment dominated the Silicon Photonics Market.

Ans: Asia Pacific is the fastest-growing region in the Silicon Photonics Market in 2023.

Table of Content

1. Introduction

1.1 Market Definition

1.2 Scope (Inclusion and Exclusions)

1.3 Research Assumptions

2. Executive Summary

2.1 Market Overview

2.2 Regional Synopsis

2.3 Competitive Summary

3. Research Methodology

3.1 Top-Down Approach

3.2 Bottom-up Approach

3.3. Data Validation

3.4 Primary Interviews

4. Market Dynamics Impact Analysis

4.1 Market Driving Factors Analysis

4.1.1 Drivers

4.1.2 Restraints

4.1.3 Opportunities

4.1.4 Challenges

4.2 PESTLE Analysis

4.3 Porter’s Five Forces Model

5. Statistical Insights and Trends Reporting

      5.1 Key Vendors and Feature Analysis, 2023

      5.2 Performance Benchmarks, 2023

      5.3 Integration Capabilities, by Software

      5.4 Usage Statistics, 2023

6. Competitive Landscape

6.1 List of Major Companies, By Region

6.2 Market Share Analysis, By Region

6.3 Product Benchmarking

6.3.1 Product specifications and features

6.3.2 Pricing

6.4 Strategic Initiatives

6.4.1 Marketing and promotional activities

6.4.2 Distribution and Supply Chain Strategies

6.4.3 Expansion plans and new product launches

6.4.4 Strategic partnerships and collaborations

6.5 Technological Advancements

6.6 Market Positioning and Branding

7. Silicon Photonics Market Segmentation, by Product

7.1 Chapter Overview

7.2 Transceivers

7.2.1 Transceivers Market Trends Analysis (2020-2032)

7.2.2 Transceivers Market Size Estimates and Forecasts to 2032 (USD Million)

7.3 Switches

7.3.1 Switches Market Trends Analysis (2020-2032)

7.3.2 Switches Market Size Estimates and Forecasts to 2032 (USD Million)

7.4 Optical Multiplexers

7.4.1 Optical Multiplexers Market Trends Analysis (2020-2032)

7.4.2 Optical Multiplexers Market Size Estimates and Forecasts to 2032 (USD Million)

7.5 Variable Optical Attenuators

7.5.1 Variable Optical Attenuators Market Trends Analysis (2020-2032)

7.5.2 Variable Optical Attenuators Market Size Estimates and Forecasts to 2032 (USD Million)

7.6 Optical Engines

7.6.1 Optical Engines Market Trends Analysis (2020-2032)

7.6.2 Optical Engines Market Size Estimates and Forecasts to 2032 (USD Million)

7.7 Active Optical Cable

7.7.1 Active Optical Cable Market Trends Analysis (2020-2032)

7.7.2 Active Optical Cable Market Size Estimates and Forecasts to 2032 (USD Million)

7.8 Sensors

7.8.1 Sensors Market Trends Analysis (2020-2032)

7.8.2 Sensors Market Size Estimates and Forecasts to 2032 (USD Million)

8. Silicon Photonics Market Segmentation, by Component

8.1 Chapter Overview

8.2 Photo Detectors

8.2.1 Photo Detectors Market Trends Analysis (2020-2032)

8.2.2 Photo Detectors Market Size Estimates and Forecasts to 2032 (USD Million)

8.3 Lasers

8.3.1 Lasers Market Trends Analysis (2020-2032)

8.3.2 Lasers Market Size Estimates and Forecasts to 2032 (USD Million)

8.4 Modulators

8.4.1 Modulators Market Trends Analysis (2020-2032)

8.4.2 Modulators Market Size Estimates and Forecasts to 2032 (USD Million)

9. Silicon Photonics Market Segmentation, by Waveguide

9.1 Chapter Overview

9.2 400-1,500 NM

9.2.1 400-1,500 NM Market Trends Analysis (2020-2032)

9.2.2 400-1,500 NM Market Size Estimates and Forecasts to 2032 (USD Million)

9.3 1,310-1,550 NM

9.3.1 1,310-1,550 NM Market Trends Analysis (2020-2032)

9.3.2 1,310-1,550 NM Market Size Estimates and Forecasts to 2032 (USD Million)

9.4 900-7000 NM

               9.4.1 900-7000 NM Market Trends Analysis (2020-2032)

9.4.2 900-7000 NM Market Size Estimates and Forecasts to 2032 (USD Million)

10. Silicon Photonics Market Segmentation, by Application

10.1 Chapter Overview

10.2 Military, Defense, and Aerospace

10.2.1 Military, Defense, and Aerospace Market Trends Analysis (2020-2032)

10.2.2 Military, Defense, and Aerospace Market Size Estimates and Forecasts to 2032 (USD Million)

10.3 IT and Telecommunication

10.3.1 IT and Telecommunication Market Trends Analysis (2020-2032)

10.3.2 IT and Telecommunication Market Size Estimates and Forecasts to 2032 (USD Million)

10.4 Medical and Life Science

               10.4.1 Medical and Life Science Market Trends Analysis (2020-2032)

10.4.2 Medical and Life Science Market Size Estimates and Forecasts to 2032 (USD Million)

10.5 Data Centers and High-performance Computing

10.5.1 Data Centers and High-performance Computing Market Trends Analysis (2020-2032)

10.5.2 Data Centers and High-performance Computing Market Size Estimates and Forecasts to 2032 (USD Million)

10.6 Other

10.6.1 Other Market Trends Analysis (2020-2032)

10.6.2 Other Market Size Estimates and Forecasts to 2032 (USD Million)

11. Regional Analysis

11.1 Chapter Overview

11.2 North America

11.2.1 Trends Analysis

11.2.2 North America Silicon Photonics Market Estimates and Forecasts, by Country (2020-2032) (USD Million)

11.2.3 North America Silicon Photonics Market Estimates and Forecasts, by Product (2020-2032) (USD Million) 

11.2.4 North America Silicon Photonics Market Estimates and Forecasts, by Component (2020-2032) (USD Million)

11.2.5 North America Silicon Photonics Market Estimates and Forecasts, by Waveguide (2020-2032) (USD Million)

11.2.6 North America Silicon Photonics Market Estimates and Forecasts, by Application (2020-2032) (USD Million)

11.2.7 USA

11.2.7.1 USA Silicon Photonics Market Estimates and Forecasts, by Product (2020-2032) (USD Million)

11.2.7.2 USA Silicon Photonics Market Estimates and Forecasts, by Component (2020-2032) (USD Million)

11.2.7.3 USA Silicon Photonics Market Estimates and Forecasts, by Waveguide (2020-2032) (USD Million)

11.2.7.4 USA Silicon Photonics Market Estimates and Forecasts, by Application (2020-2032) (USD Million)

11.2.8 Canada

11.2.8.1 Canada Silicon Photonics Market Estimates and Forecasts, by Product (2020-2032) (USD Million)

11.2.8.2 Canada Silicon Photonics Market Estimates and Forecasts, by Component (2020-2032) (USD Million)

11.2.8.3 Canada Silicon Photonics Market Estimates and Forecasts, by Waveguide (2020-2032) (USD Million)

11.2.8.4 Canada Silicon Photonics Market Estimates and Forecasts, by Application (2020-2032) (USD Million)

11.2.9 Mexico

11.2.9.1 Mexico Silicon Photonics Market Estimates and Forecasts, by Product (2020-2032) (USD Million)

11.2.9.2 Mexico Silicon Photonics Market Estimates and Forecasts, by Component (2020-2032) (USD Million)

11.2.9.3 Mexico Silicon Photonics Market Estimates and Forecasts, by Waveguide (2020-2032) (USD Million)

11.2.9.4 Mexico Silicon Photonics Market Estimates and Forecasts, by Application (2020-2032) (USD Million)

11.3 Europe

11.3.1 Eastern Europe

11.3.1.1 Trends Analysis

11.3.1.2 Eastern Europe Silicon Photonics Market Estimates and Forecasts, by Country (2020-2032) (USD Million)

11.3.1.3 Eastern Europe Silicon Photonics Market Estimates and Forecasts, by Product (2020-2032) (USD Million) 

11.3.1.4 Eastern Europe Silicon Photonics Market Estimates and Forecasts, by Component (2020-2032) (USD Million)

11.3.1.5 Eastern Europe Silicon Photonics Market Estimates and Forecasts, by Waveguide (2020-2032) (USD Million)

11.3.1.6 Eastern Europe Silicon Photonics Market Estimates and Forecasts, by Application (2020-2032) (USD Million)

11.3.1.7 Poland

11.3.1.7.1 Poland Silicon Photonics Market Estimates and Forecasts, by Product (2020-2032) (USD Million)

11.3.1.7.2 Poland Silicon Photonics Market Estimates and Forecasts, by Component (2020-2032) (USD Million)

11.3.1.7.3 Poland Silicon Photonics Market Estimates and Forecasts, by Waveguide (2020-2032) (USD Million)

11.3.1.7.4 Poland Silicon Photonics Market Estimates and Forecasts, by Application (2020-2032) (USD Million)

11.3.1.8 Romania

11.3.1.8.1 Romania Silicon Photonics Market Estimates and Forecasts, by Product (2020-2032) (USD Million)

11.3.1.8.2 Romania Silicon Photonics Market Estimates and Forecasts, by Component (2020-2032) (USD Million)

11.3.1.8.3 Romania Silicon Photonics Market Estimates and Forecasts, by Waveguide (2020-2032) (USD Million)

11.3.1.8.4 Romania Silicon Photonics Market Estimates and Forecasts, by Application (2020-2032) (USD Million)

11.3.1.9 Hungary

11.3.1.9.1 Hungary Silicon Photonics Market Estimates and Forecasts, by Product (2020-2032) (USD Million)

11.3.1.9.2 Hungary Silicon Photonics Market Estimates and Forecasts, by Component (2020-2032) (USD Million)

11.3.1.9.3 Hungary Silicon Photonics Market Estimates and Forecasts, by Waveguide (2020-2032) (USD Million)

11.3.1.9.4 Hungary Silicon Photonics Market Estimates and Forecasts, by Application (2020-2032) (USD Million)

11.3.1.10 Turkey

11.3.1.10.1 Turkey Silicon Photonics Market Estimates and Forecasts, by Product (2020-2032) (USD Million)

11.3.1.10.2 Turkey Silicon Photonics Market Estimates and Forecasts, by Component (2020-2032) (USD Million)

11.3.1.10.3 Turkey Silicon Photonics Market Estimates and Forecasts, by Waveguide (2020-2032) (USD Million)

11.3.1.10.4 Turkey Silicon Photonics Market Estimates and Forecasts, by Application (2020-2032) (USD Million)

11.3.1.11 Rest of Eastern Europe

11.3.1.11.1 Rest of Eastern Europe Silicon Photonics Market Estimates and Forecasts, by Product (2020-2032) (USD Million)

11.3.1.11.2 Rest of Eastern Europe Silicon Photonics Market Estimates and Forecasts, by Component (2020-2032) (USD Million)

11.3.1.11.3 Rest of Eastern Europe Silicon Photonics Market Estimates and Forecasts, by Waveguide (2020-2032) (USD Million)

11.3.1.11.4 Rest of Eastern Europe Silicon Photonics Market Estimates and Forecasts, by Application (2020-2032) (USD Million)

11.3.2 Western Europe

11.3.2.1 Trends Analysis

11.3.2.2 Western Europe Silicon Photonics Market Estimates and Forecasts, by Country (2020-2032) (USD Million)

11.3.2.3 Western Europe Silicon Photonics Market Estimates and Forecasts, by Product (2020-2032) (USD Million) 

11.3.2.4 Western Europe Silicon Photonics Market Estimates and Forecasts, by Component (2020-2032) (USD Million)

11.3.2.5 Western Europe Silicon Photonics Market Estimates and Forecasts, by Waveguide (2020-2032) (USD Million)

11.3.2.6 Western Europe Silicon Photonics Market Estimates and Forecasts, by Application (2020-2032) (USD Million)

11.3.2.7 Germany

11.3.2.7.1 Germany Silicon Photonics Market Estimates and Forecasts, by Product (2020-2032) (USD Million)

11.3.2.7.2 Germany Silicon Photonics Market Estimates and Forecasts, by Component (2020-2032) (USD Million)

11.3.2.7.3 Germany Silicon Photonics Market Estimates and Forecasts, by Waveguide (2020-2032) (USD Million)

11.3.2.7.4 Germany Silicon Photonics Market Estimates and Forecasts, by Application (2020-2032) (USD Million)

11.3.2.8 France

11.3.2.8.1 France Silicon Photonics Market Estimates and Forecasts, by Product (2020-2032) (USD Million)

11.3.2.8.2 France Silicon Photonics Market Estimates and Forecasts, by Component (2020-2032) (USD Million)

11.3.2.8.3 France Silicon Photonics Market Estimates and Forecasts, by Waveguide (2020-2032) (USD Million)

11.3.2.8.4 France Silicon Photonics Market Estimates and Forecasts, by Application (2020-2032) (USD Million)

11.3.2.9 UK

11.3.2.9.1 UK Silicon Photonics Market Estimates and Forecasts, by Product (2020-2032) (USD Million)

11.3.2.9.2 UK Silicon Photonics Market Estimates and Forecasts, by Component (2020-2032) (USD Million)

11.3.2.9.3 UK Silicon Photonics Market Estimates and Forecasts, by Waveguide (2020-2032) (USD Million)

11.3.2.9.4 UK Silicon Photonics Market Estimates and Forecasts, by Application (2020-2032) (USD Million)

11.3.2.10 Italy

11.3.2.10.1 Italy Silicon Photonics Market Estimates and Forecasts, by Product (2020-2032) (USD Million)

11.3.2.10.2 Italy Silicon Photonics Market Estimates and Forecasts, by Component (2020-2032) (USD Million)

11.3.2.10.3 Italy Silicon Photonics Market Estimates and Forecasts, by Waveguide (2020-2032) (USD Million)

11.3.2.10.4 Italy Silicon Photonics Market Estimates and Forecasts, by Application (2020-2032) (USD Million)

11.3.2.11 Spain

11.3.2.11.1 Spain Silicon Photonics Market Estimates and Forecasts, by Product (2020-2032) (USD Million)

11.3.2.11.2 Spain Silicon Photonics Market Estimates and Forecasts, by Component (2020-2032) (USD Million)

11.3.2.11.3 Spain Silicon Photonics Market Estimates and Forecasts, by Waveguide (2020-2032) (USD Million)

11.3.2.11.4 Spain Silicon Photonics Market Estimates and Forecasts, by Application (2020-2032) (USD Million)

11.3.2.12 Netherlands

11.3.2.12.1 Netherlands Silicon Photonics Market Estimates and Forecasts, by Product (2020-2032) (USD Million)

11.3.2.12.2 Netherlands Silicon Photonics Market Estimates and Forecasts, by Component (2020-2032) (USD Million)

11.3.2.12.3 Netherlands Silicon Photonics Market Estimates and Forecasts, by Waveguide (2020-2032) (USD Million)

11.3.2.12.4 Netherlands Silicon Photonics Market Estimates and Forecasts, by Application (2020-2032) (USD Million)

11.3.2.13 Switzerland

11.3.2.13.1 Switzerland Silicon Photonics Market Estimates and Forecasts, by Product (2020-2032) (USD Million)

11.3.2.13.2 Switzerland Silicon Photonics Market Estimates and Forecasts, by Component (2020-2032) (USD Million)

11.3.2.13.3 Switzerland Silicon Photonics Market Estimates and Forecasts, by Waveguide (2020-2032) (USD Million)

11.3.2.13.4 Switzerland Silicon Photonics Market Estimates and Forecasts, by Application (2020-2032) (USD Million)

11.3.2.14 Austria

11.3.2.14.1 Austria Silicon Photonics Market Estimates and Forecasts, by Product (2020-2032) (USD Million)

11.3.2.14.2 Austria Silicon Photonics Market Estimates and Forecasts, by Component (2020-2032) (USD Million)

11.3.2.14.3 Austria Silicon Photonics Market Estimates and Forecasts, by Waveguide (2020-2032) (USD Million)

11.3.2.14.4 Austria Silicon Photonics Market Estimates and Forecasts, by Application (2020-2032) (USD Million)

11.3.2.15 Rest of Western Europe

11.3.2.15.1 Rest of Western Europe Silicon Photonics Market Estimates and Forecasts, by Product (2020-2032) (USD Million)

11.3.2.15.2 Rest of Western Europe Silicon Photonics Market Estimates and Forecasts, by Component (2020-2032) (USD Million)

11.3.2.15.3 Rest of Western Europe Silicon Photonics Market Estimates and Forecasts, by Waveguide (2020-2032) (USD Million)

11.3.2.15.4 Rest of Western Europe Silicon Photonics Market Estimates and Forecasts, by Application (2020-2032) (USD Million)

11.4 Asia Pacific

11.4.1 Trends Analysis

11.4.2 Asia Pacific Silicon Photonics Market Estimates and Forecasts, by Country (2020-2032) (USD Million)

11.4.3 Asia Pacific Silicon Photonics Market Estimates and Forecasts, by Product (2020-2032) (USD Million) 

11.4.4 Asia Pacific Silicon Photonics Market Estimates and Forecasts, by Component (2020-2032) (USD Million)

11.4.5 Asia Pacific Silicon Photonics Market Estimates and Forecasts, by Waveguide (2020-2032) (USD Million)

11.4.6 Asia Pacific Silicon Photonics Market Estimates and Forecasts, by Application (2020-2032) (USD Million)

11.4.7 China

11.4.7.1 China Silicon Photonics Market Estimates and Forecasts, by Product (2020-2032) (USD Million)

11.4.7.2 China Silicon Photonics Market Estimates and Forecasts, by Component (2020-2032) (USD Million)

11.4.7.3 China Silicon Photonics Market Estimates and Forecasts, by Waveguide (2020-2032) (USD Million)

11.4.7.4 China Silicon Photonics Market Estimates and Forecasts, by Application (2020-2032) (USD Million)

11.4.8 India

11.4.8.1 India Silicon Photonics Market Estimates and Forecasts, by Product (2020-2032) (USD Million)

11.4.8.2 India Silicon Photonics Market Estimates and Forecasts, by Component (2020-2032) (USD Million)

11.4.8.3 India Silicon Photonics Market Estimates and Forecasts, by Waveguide (2020-2032) (USD Million)

11.4.8.4 India Silicon Photonics Market Estimates and Forecasts, by Application (2020-2032) (USD Million)

11.4.9 Japan

11.4.9.1 Japan Silicon Photonics Market Estimates and Forecasts, by Product (2020-2032) (USD Million)

11.4.9.2 Japan Silicon Photonics Market Estimates and Forecasts, by Component (2020-2032) (USD Million)

11.4.9.3 Japan Silicon Photonics Market Estimates and Forecasts, by Waveguide (2020-2032) (USD Million)

11.4.9.4 Japan Silicon Photonics Market Estimates and Forecasts, by Application (2020-2032) (USD Million)

11.4.10 South Korea

11.4.10.1 South Korea Silicon Photonics Market Estimates and Forecasts, by Product (2020-2032) (USD Million)

11.4.10.2 South Korea Silicon Photonics Market Estimates and Forecasts, by Component (2020-2032) (USD Million)

11.4.10.3 South Korea Silicon Photonics Market Estimates and Forecasts, by Waveguide (2020-2032) (USD Million)

11.4.10.4 South Korea Silicon Photonics Market Estimates and Forecasts, by Application (2020-2032) (USD Million)

11.4.11 Vietnam

11.4.11.1 Vietnam Silicon Photonics Market Estimates and Forecasts, by Product (2020-2032) (USD Million)

11.4.11.2 Vietnam Silicon Photonics Market Estimates and Forecasts, by Component (2020-2032) (USD Million)

11.4.11.3 Vietnam Silicon Photonics Market Estimates and Forecasts, by Waveguide (2020-2032) (USD Million)

11.4.11.4 Vietnam Silicon Photonics Market Estimates and Forecasts, by Application (2020-2032) (USD Million)

11.4.12 Singapore

11.4.12.1 Singapore Silicon Photonics Market Estimates and Forecasts, by Product (2020-2032) (USD Million)

11.4.12.2 Singapore Silicon Photonics Market Estimates and Forecasts, by Component (2020-2032) (USD Million)

11.4.12.3 Singapore Silicon Photonics Market Estimates and Forecasts, by Waveguide (2020-2032) (USD Million)

11.4.12.4 Singapore Silicon Photonics Market Estimates and Forecasts, by Application (2020-2032) (USD Million)

11.4.13 Australia

11.4.13.1 Australia Silicon Photonics Market Estimates and Forecasts, by Product (2020-2032) (USD Million)

11.4.13.2 Australia Silicon Photonics Market Estimates and Forecasts, by Component (2020-2032) (USD Million)

11.4.13.3 Australia Silicon Photonics Market Estimates and Forecasts, by Waveguide (2020-2032) (USD Million)

11.4.13.4 Australia Silicon Photonics Market Estimates and Forecasts, by Application (2020-2032) (USD Million)

11.4.14 Rest of Asia Pacific

11.4.14.1 Rest of Asia Pacific Silicon Photonics Market Estimates and Forecasts, by Product (2020-2032) (USD Million)

11.4.14.2 Rest of Asia Pacific Silicon Photonics Market Estimates and Forecasts, by Component (2020-2032) (USD Million)

11.4.14.3 Rest of Asia Pacific Silicon Photonics Market Estimates and Forecasts, by Waveguide (2020-2032) (USD Million)

11.4.14.4 Rest of Asia Pacific Silicon Photonics Market Estimates and Forecasts, by Application (2020-2032) (USD Million)

11.5 Middle East and Africa

11.5.1 Middle East

11.5.1.1 Trends Analysis

11.5.1.2 Middle East Silicon Photonics Market Estimates and Forecasts, by Country (2020-2032) (USD Million)

11.5.1.3 Middle East Silicon Photonics Market Estimates and Forecasts, by Product (2020-2032) (USD Million) 

11.5.1.4 Middle East Silicon Photonics Market Estimates and Forecasts, by Component (2020-2032) (USD Million)

11.5.1.5 Middle East Silicon Photonics Market Estimates and Forecasts, by Waveguide (2020-2032) (USD Million)

11.5.1.6 Middle East Silicon Photonics Market Estimates and Forecasts, by Application (2020-2032) (USD Million)

11.5.1.7 UAE

11.5.1.7.1 UAE Silicon Photonics Market Estimates and Forecasts, by Product (2020-2032) (USD Million)

11.5.1.7.2 UAE Silicon Photonics Market Estimates and Forecasts, by Component (2020-2032) (USD Million)

11.5.1.7.3 UAE Silicon Photonics Market Estimates and Forecasts, by Waveguide (2020-2032) (USD Million)

11.5.1.7.4 UAE Silicon Photonics Market Estimates and Forecasts, by Application  (2020-2032) (USD Million)

11.5.1.8 Egypt

11.5.1.8.1 Egypt Silicon Photonics Market Estimates and Forecasts, by Product (2020-2032) (USD Million)

11.5.1.8.2 Egypt Silicon Photonics Market Estimates and Forecasts, by Component (2020-2032) (USD Million)

11.5.1.8.3 Egypt Silicon Photonics Market Estimates and Forecasts, by Waveguide (2020-2032) (USD Million)

11.5.1.8.4 Egypt Silicon Photonics Market Estimates and Forecasts, by Application (2020-2032) (USD Million)

11.5.1.9 Saudi Arabia

11.5.1.9.1 Saudi Arabia Silicon Photonics Market Estimates and Forecasts, by Product (2020-2032) (USD Million)

11.5.1.9.2 Saudi Arabia Silicon Photonics Market Estimates and Forecasts, by Component (2020-2032) (USD Million)

11.5.1.9.3 Saudi Arabia Silicon Photonics Market Estimates and Forecasts, by Waveguide (2020-2032) (USD Million)

11.5.1.9.4 Saudi Arabia Silicon Photonics Market Estimates and Forecasts, by Application (2020-2032) (USD Million)

11.5.1.10 Qatar

11.5.1.10.1 Qatar Silicon Photonics Market Estimates and Forecasts, by Product (2020-2032) (USD Million)

11.5.1.10.2 Qatar Silicon Photonics Market Estimates and Forecasts, by Component (2020-2032) (USD Million)

11.5.1.10.3 Qatar Silicon Photonics Market Estimates and Forecasts, by Waveguide (2020-2032) (USD Million)

11.5.1.10.4 Qatar Silicon Photonics Market Estimates and Forecasts, by Application (2020-2032) (USD Million)

11.5.1.11 Rest of Middle East

11.5.1.11.1 Rest of Middle East Silicon Photonics Market Estimates and Forecasts, by Product (2020-2032) (USD Million)

11.5.1.11.2 Rest of Middle East Silicon Photonics Market Estimates and Forecasts, by Component (2020-2032) (USD Million)

11.5.1.11.3 Rest of Middle East Silicon Photonics Market Estimates and Forecasts, by Waveguide (2020-2032) (USD Million)

11.5.1.11.4 Rest of Middle East Silicon Photonics Market Estimates and Forecasts, by Application (2020-2032) (USD Million)

11.5.2 Africa

11.5.2.1 Trends Analysis

11.5.2.2 Africa Silicon Photonics Market Estimates and Forecasts, by Country (2020-2032) (USD Million)

11.5.2.3 Africa Silicon Photonics Market Estimates and Forecasts, by Product (2020-2032) (USD Million) 

11.5.2.4 Africa Silicon Photonics Market Estimates and Forecasts, by Component (2020-2032) (USD Million)

11.5.2.5 Africa Silicon Photonics Market Estimates and Forecasts, by Waveguide (2020-2032) (USD Million)

11.5.2.6 Africa Silicon Photonics Market Estimates and Forecasts, by Application (2020-2032) (USD Million)

11.5.2.7 South Africa

11.5.2.7.1 South Africa Silicon Photonics Market Estimates and Forecasts, by Product (2020-2032) (USD Million)

11.5.2.7.2 South Africa Silicon Photonics Market Estimates and Forecasts, by Component (2020-2032) (USD Million)

11.5.2.7.3 South Africa Silicon Photonics Market Estimates and Forecasts, by Waveguide (2020-2032) (USD Million)

11.5.2.7.4 South Africa Silicon Photonics Market Estimates and Forecasts, by Application (2020-2032) (USD Million)

11.5.2.8 Nigeria

11.5.2.8.1 Nigeria Silicon Photonics Market Estimates and Forecasts, by Product (2020-2032) (USD Million)

11.5.2.8.2 Nigeria Silicon Photonics Market Estimates and Forecasts, by Component (2020-2032) (USD Million)

11.5.2.8.3 Nigeria Silicon Photonics Market Estimates and Forecasts, by Waveguide (2020-2032) (USD Million)

11.5.2.8.4 Nigeria Silicon Photonics Market Estimates and Forecasts, by Application (2020-2032) (USD Million)

11.5.2.9 Rest of Africa

11.5.2.9.1 Rest of Africa Silicon Photonics Market Estimates and Forecasts, by Product (2020-2032) (USD Million)

11.5.2.9.2 Rest of Africa Silicon Photonics Market Estimates and Forecasts, by Component (2020-2032) (USD Million)

11.5.2.9.3 Rest of Africa Silicon Photonics Market Estimates and Forecasts, by Waveguide (2020-2032) (USD Million)

11.5.2.9.4 Rest of Africa Silicon Photonics Market Estimates and Forecasts, by Application (2020-2032) (USD Million)

11.6 Latin America

11.6.1 Trends Analysis

11.6.2 Latin America Silicon Photonics Market Estimates and Forecasts, by Country (2020-2032) (USD Million)

11.6.3 Latin America Silicon Photonics Market Estimates and Forecasts, by Product (2020-2032) (USD Million) 

11.6.4 Latin America Silicon Photonics Market Estimates and Forecasts, by Component (2020-2032) (USD Million)

11.6.5 Latin America Silicon Photonics Market Estimates and Forecasts, by Waveguide (2020-2032) (USD Million)

11.6.6 Latin America Silicon Photonics Market Estimates and Forecasts, by Application (2020-2032) (USD Million)

11.6.7 Brazil

11.6.7.1 Brazil Silicon Photonics Market Estimates and Forecasts, by Product (2020-2032) (USD Million)

11.6.7.2 Brazil Silicon Photonics Market Estimates and Forecasts, by Component (2020-2032) (USD Million)

11.6.7.3 Brazil Silicon Photonics Market Estimates and Forecasts, by Waveguide (2020-2032) (USD Million)

11.6.7.4 Brazil Silicon Photonics Market Estimates and Forecasts, by Application (2020-2032) (USD Million)

11.6.8 Argentina

11.6.8.1 Argentina Silicon Photonics Market Estimates and Forecasts, by Product (2020-2032) (USD Million)

11.6.8.2 Argentina Silicon Photonics Market Estimates and Forecasts, by Component (2020-2032) (USD Million)

11.6.8.3 Argentina Silicon Photonics Market Estimates and Forecasts, by Waveguide (2020-2032) (USD Million)

11.6.8.4 Argentina Silicon Photonics Market Estimates and Forecasts, by Application (2020-2032) (USD Million)

11.6.9 Colombia

11.6.9.1 Colombia Silicon Photonics Market Estimates and Forecasts, by Product (2020-2032) (USD Million)

11.6.9.2 Colombia Silicon Photonics Market Estimates and Forecasts, by Component (2020-2032) (USD Million)

11.6.9.3 Colombia Silicon Photonics Market Estimates and Forecasts, by Waveguide (2020-2032) (USD Million)

11.6.9.4 Colombia Silicon Photonics Market Estimates and Forecasts, by Application (2020-2032) (USD Million)

11.6.10 Rest of Latin America

11.6.10.1 Rest of Latin America Silicon Photonics Market Estimates and Forecasts, by Product (2020-2032) (USD Million)

11.6.10.2 Rest of Latin America Silicon Photonics Market Estimates and Forecasts, by Component (2020-2032) (USD Million)

11.6.10.3 Rest of Latin America Silicon Photonics Market Estimates and Forecasts, by Waveguide (2020-2032) (USD Million)

11.6.10.4 Rest of Latin America Silicon Photonics Market Estimates and Forecasts, by Application (2020-2032) (USD Million)

12. Company Profiles

12.1 Cisco Systems

12.1.1 Company Overview

12.1.2 Financial

12.1.3 Products/ Services Offered

12.1.4 SWOT Analysis

12.2 Infinera

12.2.1 Company Overview

12.2.2 Financial

12.2.3 Products/ Services Offered

12.2.4 SWOT Analysis

12.3 Finisar

12.3.1 Company Overview

12.3.2 Financial

12.3.3 Products/ Services Offered

12.3.4 SWOT Analysis

12.4 GlobalFoundries

             12.4.1 Company Overview

12.4.2 Financial

12.4.3 Products/ Services Offered

12.4.4 SWOT Analysis

12.5 InPhi

             12.5.1 Company Overview

12.5.2 Financial

12.5.3 Products/ Services Offered

12.5.4 SWOT Analysis

12.6 IBM

12.6.1 Company Overview

12.6.2 Financial

12.6.3 Products/ Services Offered

12.6.4 SWOT Analysis

12.7 Rockley Photonics

12.7.1 Company Overview

12.7.2 Financial

12.7.3 Products/ Services Offered

12.7.4 SWOT Analysis

12.8 Intel

             12.8.1 Company Overview

12.8.2 Financial

12.8.3 Products/ Services Offered

12.8.4 SWOT Analysis

12.9 IPG Photonics

12.9.1 Company Overview

12.9.2 Financial

12.9.3 Products/ Services Offered

12.9.4 SWOT Analysis

12.10 NeoPhotonics

               12.10.1 Company Overview

12.10.2 Financial

12.10.3 Products/ Services Offered

12.10.4 SWOT Analysis

13. Use Cases and Best Practices

14. Conclusion

An accurate research report requires proper strategizing as well as implementation. There are multiple factors involved in the completion of good and accurate research report and selecting the best methodology to compete the research is the toughest part. Since the research reports we provide play a crucial role in any company’s decision-making process, therefore we at SNS Insider always believe that we should choose the best method which gives us results closer to reality. This allows us to reach at a stage wherein we can provide our clients best and accurate investment to output ratio.

Each report that we prepare takes a timeframe of 350-400 business hours for production. Starting from the selection of titles through a couple of in-depth brain storming session to the final QC process before uploading our titles on our website we dedicate around 350 working hours. The titles are selected based on their current market cap and the foreseen CAGR and growth.


The 5 steps process:

Step 1: Secondary Research:

Secondary Research or Desk Research is as the name suggests is a research process wherein, we collect data through the readily available information. In this process we use various paid and unpaid databases which our team has access to and gather data through the same. This includes examining of listed companies’ annual reports, Journals, SEC filling etc. Apart from this our team has access to various associations across the globe across different industries. Lastly, we have exchange relationships with various university as well as individual libraries.

Secondary Research

Step 2: Primary Research

When we talk about primary research, it is a type of study in which the researchers collect relevant data samples directly, rather than relying on previously collected data.  This type of research is focused on gaining content specific facts that can be sued to solve specific problems. Since the collected data is fresh and first hand therefore it makes the study more accurate and genuine.

We at SNS Insider have divided Primary Research into 2 parts.

Part 1 wherein we interview the KOLs of major players as well as the upcoming ones across various geographic regions. This allows us to have their view over the market scenario and acts as an important tool to come closer to the accurate market numbers. As many as 45 paid and unpaid primary interviews are taken from both the demand and supply side of the industry to make sure we land at an accurate judgement and analysis of the market.

This step involves the triangulation of data wherein our team analyses the interview transcripts, online survey responses and observation of on filed participants. The below mentioned chart should give a better understanding of the part 1 of the primary interview.

Primary Research

Part 2: In this part of primary research the data collected via secondary research and the part 1 of the primary research is validated with the interviews from individual consultants and subject matter experts.

Consultants are those set of people who have at least 12 years of experience and expertise within the industry whereas Subject Matter Experts are those with at least 15 years of experience behind their back within the same space. The data with the help of two main processes i.e., FGDs (Focused Group Discussions) and IDs (Individual Discussions). This gives us a 3rd party nonbiased primary view of the market scenario making it a more dependable one while collation of the data pointers.

Step 3: Data Bank Validation

Once all the information is collected via primary and secondary sources, we run that information for data validation. At our intelligence centre our research heads track a lot of information related to the market which includes the quarterly reports, the daily stock prices, and other relevant information. Our data bank server gets updated every fortnight and that is how the information which we collected using our primary and secondary information is revalidated in real time.

Data Bank Validation

Step 4: QA/QC Process

After all the data collection and validation our team does a final level of quality check and quality assurance to get rid of any unwanted or undesired mistakes. This might include but not limited to getting rid of the any typos, duplication of numbers or missing of any important information. The people involved in this process include technical content writers, research heads and graphics people. Once this process is completed the title gets uploader on our platform for our clients to read it.

Step 5: Final QC/QA Process:

This is the last process and comes when the client has ordered the study. In this process a final QA/QC is done before the study is emailed to the client. Since we believe in giving our clients a good experience of our research studies, therefore, to make sure that we do not lack at our end in any way humanly possible we do a final round of quality check and then dispatch the study to the client.

Maket Segmentation:

By Product

  • Transceivers

  • Switches

  • Optical Multiplexers

  • Variable Optical Attenuators

  • Optical Engines

  • Active Optical Cable

  • Sensors

By Component

  • Photo Detectors

  • Lasers

  • Modulators

By Waveguide

  • 400-1,500 NM

  • 1,310-1,550 NM

  • 900-7000 NM

By Application

  • Military, Defense, and Aerospace

  • IT and Telecommunication

  • Medical and Life Science

  • Data Centers and High-performance Computing

  • Other Applications

Request for Segment Customization as per your Business Requirement: Segment Customization Request

REGIONAL COVERAGE:

North America

  • US

  • Canada

  • Mexico

Europe

  • Eastern Europe

    • Poland

    • Romania

    • Hungary

    • Turkey

    • Rest of Eastern Europe

  • Western Europe

    • Germany

    • France

    • UK

    • Italy

    • Spain

    • Netherlands

    • Switzerland

    • Austria

    • Rest of Western Europe

Asia Pacific

  • China

  • India

  • Japan

  • South Korea

  • Vietnam

  • Singapore

  • Australia

  • Rest of Asia Pacific

Middle East & Africa

  • Middle East

    • UAE

    • Egypt

    • Saudi Arabia

    • Qatar

    • Rest of the Middle East

  • Africa

    • Nigeria

    • South Africa

    • Rest of Africa

Latin America

  • Brazil

  • Argentina

  • Colombia

Request for Country Level Research Report: Country Level Customization Request

Available Customization

With the given market data, SNS Insider offers customization as per the company’s specific needs. The following customization options are available for the report:

  • Product Analysis

  • Criss-Cross segment analysis (e.g. Product X Application)

  • Product Matrix which gives a detailed comparison of the product portfolio of each company

  • Geographic Analysis

  • Additional countries in any of the regions

  • Company Information

  • Detailed analysis and profiling of additional market players (Up to five)


  •            5000 (33% Discount)


  •            8950 (40% Discount)


  •            3050 (23% Discount)

Start a Conversation

Hi! Click one of our member below to chat on Phone