image

Optical Transceiver Market REPORT SCOPE & OVERVIEW:

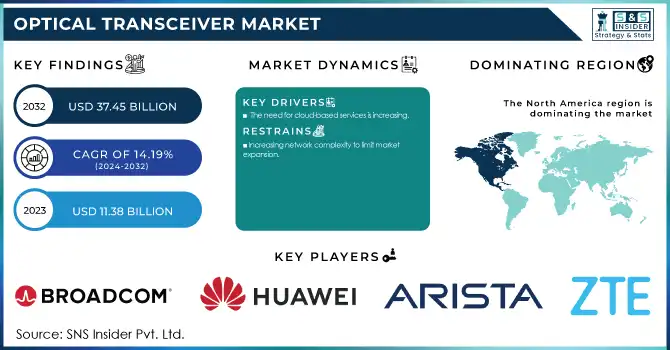
The Optical Transceiver Market size was valued at USD 8.75 Billion in 2022 and is expected to grow to USD 27.33 Billion by 2030 and grow at a CAGR Of 15.3% over the forecast period of 2023-2030.

A computer's electrical data streams are converted into optical data signals using an Optical Transceiver, or OT.or convert them into signals that are specific to a laser's wavelength before sending those signals through an optical fiber. They also perform a variety of other tasks, such as modulation transfer, signal detection, optical power control, IV conversions, regeneration of the limiting amplifier decision, and more.

Optical Transceiver market Revenue Analysis

Get more information on Optical Transceiver Market - Request Free Sample Report

MARKET DYNAMICS

KEY DRIVERS:

  • Increased need for modern communications

  • The need for cloud-based services is increasing

As 5G technology develops and base stations are deployed, the bearer network is projected to advance and upgrade, leading to an increase in demand for optical communication network equipment. According to the Ericsson mobility report, fixed broadband subscription penetration and LTE network penetration have both grown significantly since 2019 and are expected to continue in the foreseeable future. The fixed broadband connection is expected to increase by 3% annually by 2024, according to the research. Over the forecast period, this is then anticipated to boost the growth of the worldwide Optical Transceiver market.

RESTRAIN:

  • Increasing network complexity to limit market expansion

Laser diodes and signal decoders are frequently used with Optical Transceivers. The optical pulses produced by laser diodes and the electric signals that the signal decoder converts between the receiver and transmitter are what allow transceivers to function. This procedure works with fiber optic devices and lines, however numerous data centers include copper-based networking equipment that is incompatible with fiber optic transmission. As a result, networks become more complex, which is projected to further impede the growth of the worldwide Optical Transceiver market throughout the forecast period.

OPPORTUNITY:

  • Growing Innovation

  • Demand for digital services.

During the anticipated period, there are expected to be numerous potential prospects in the global Optical Transceiver market due to the steadily increasing demand for digital services. A key component of modern advanced civilization is data communications. To meet the continuously increasing demand for digital services around the world, optical fiber networks have shown to be promising in carrying data over long distances and delivering it on a massive scale.

CHALLENGES:

  • Network complexity is increasing

  • Negative effects of the COVID-19 pandemic

  • Applications for big data and cloud computing are expanding quickly

Data centers are managing a sizable quantity of traffic as big data and cloud computing applications continue to rise. Increasing Optical Transceiver speeds has become essential to meet the increased demand for high-bandwidth data transmission while retaining the same power usage, data center space, and cost. Silicon-photonic technology is being used by market players to address this issue since it reduces the size of transceivers and makes design and production simpler by integrating numerous optical components into a single silicon photonic chip. This is boosting the demand for Optical Transceivers, which will likely sustain market expansion in the years to come.

IMPACT OF COVID-19

The COVID-19 outbreak has had a large effect on the world economy, which includes the Optical Transceiver business. Due to the rise in internet usage for remote work, online education, and leisure during the pandemic, Optical Transceivers are now more in demand. However, The total market growth has been impacted by supply chain disruptions, production halts, and logistical difficulties. Due to factory closures, import and export bans, and reduced manufacturing capacity brought on by the COVID-19 epidemic, there is a shortage of vital parts needed to make Optical Transceivers. The epidemic has also impacted the distribution of finished goods and the availability of skilled labor, which has caused delayed shipments and longer lead times.

KEY MARKET SEGMENTS:

By form factor

  • SFF & SFP

  • QSFP

  • CFP

  • XFP

  • CFP

By Data Rate

  • Less than 10 Gbps

  • Gbps to 40 Gbps

  • Gbps to 100 Gbps

  • More than 100 Gbps

By Fiber Type

  • Single-mode fiber

  • Multimode fiber

By Distance

  • Less than 1 km

  • 1-10 km

  • 11-100 km

  • More than 100 km

By wavelength

  • 850 nm band

  • 1310 nm band

  • 1550 nm band

  • Others

By application

  • Telecommunication

  • Data centers

By connector

  • LC connector

  • SC connector

  • MPO connector

  • RJ-45

Optical Transceiver market Segmentation Analysis

Need any customization research on Optical Transceiver Market - Enquiry Now

REGIONAL ANALYSIS

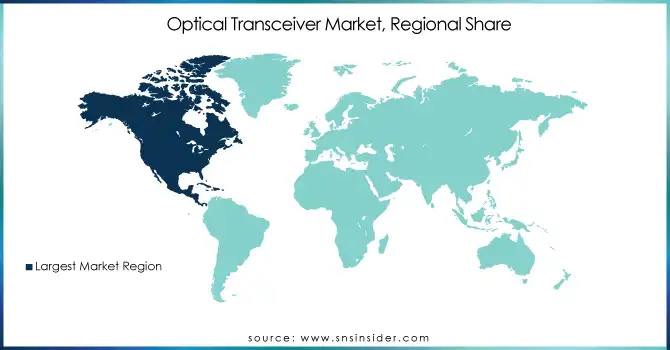
  • North America is among the areas that is anticipated to obtain a significant market share for Optical Transceivers worldwide,Over the projection period.This may be caused by the enormous internet penetration and the changing communication landscape. Improved connectivity is in high demand as a result of these changes, which also increases the demand for Optical Transceivers in the area. Additionally, as businesses throughout the world adjust to a post-pandemic future, major investment in network infrastructure transformation in the region is also anticipated to boost market expansion in the region.

  • Asia Pacific is predicted to have significant expansion in the worldwide Optical Transceiver market over the course of the forecast period. Due to the region's consistently developing communication technologies, In this region, telecom network operators are building fibre.

REGIONAL COVERAGE:

North America

  • USA

  • Canada

  • Mexico

Europe

  • Germany

  • UK

  • France

  • Italy

  • Spain

  • The Netherlands

  • Rest of Europe

Asia-Pacific

  • Japan

  • South Korea

  • China

  • India

  • Australia

  • Rest of Asia-Pacific

The Middle East & Africa

  • Israel

  • UAE

  • South Africa

  • Rest of the Middle East & Africa

Latin America

  • Brazil

  • Argentina

  • Rest of Latin American

KEY PLAYERS

The major players are ZTE Corporation, A Arista Networks Inc., Huawei Technologies Co., Ltd., Fujitsu Optical Components Limited, Broadcom Inc., Juniper Networks, Inc., Sumitomo Electric Industries Ltd, Cisco Systems, Inc., NEC Corporation, Lumentum Operations LLC, and other players are listed in the final report.

Huawei Technologies Co Ltd​​​​​​​​​​​​​​​​​​​​​​​​​​​​-Company Financial Analysis

Company Landscape Analysis​​​​​​​

RECENT DEVELOPMENTS

  •    NeoPhotonics, a top creator and manufacturer of optoelectronic and laser systems, was purchased by Lumentum Operations LLC in November 2021 for US$ 16.00 per share in cash, or roughly US$ 918 million in total equity.

  • Fujitsu Optical Components Ltd. announced the creation of the 400Gbps DWDM open systems CFP2-DCO coherent transceiver in March 2022 and started to increase sales in the second half of 2021.

  • Smiths Interconnect unveiled their LightCONEX optical plug-in and backplane module connectors in February 2022. For VPX systems, integrating an Optical Transceiver into the plug-in module connection is probably a ground-breaking approach.

  • The enhanced portfolio of 100Gb, 200Gb, 400Gb, and 800Gb electro-optic platform solutions for cloud networks was released by Broadcom Inc. in June 2021.

Optical Transceiver Market Report Scope:
Report Attributes Details
Market Size in 2022  US$ 8.75 Bn
Market Size by 2030  US$ 27.33 Bn
CAGR   CAGR of  15.3 % From 2023 to 2030
Base Year  2022
Forecast Period  2023-2030
Historical Data  2020-2021
Report Scope & Coverage Market Size, Segments Analysis, Competitive  Landscape, Regional Analysis, DROC & SWOT Analysis, Forecast Outlook
Key Segments • By form factor (SFF & SFP, QSFP, CFP, XFP, CFP)
• By data rate (Less than 10 Gbps, Gbps to 40 Gbps, Gbps to 100 Gbps, More than 100 Gbps)
• By fiber type (Single-mode fiber, Multimode fiber)
• By Distance (Less than 1 km, 1-10 km, 11-100 km, More than 100 km)
• By wavelength (850 nm band, 1310 nm band, 1550 nm band, Others)
• By Application (Telecommunication, Data centers)
• By connector (LC connector, SC connector, MPO connector, RJ-45)
Regional Analysis/Coverage North America (USA, Canada, Mexico), Europe
(Germany, UK, France, Italy, Spain, Netherlands,
Rest of Europe), Asia-Pacific (Japan, South Korea,
China, India, Australia, Rest of Asia-Pacific), The
Middle East & Africa (Israel, UAE, South Africa,
Rest of Middle East & Africa), Latin America (Brazil, Argentina, Rest of Latin America)
Company Profiles ZTE Corporation, A Arista Networks Inc., Huawei Technologies Co., Ltd., Fujitsu Optical Components Limited, Broadcom Inc., Juniper Networks, Inc., Sumitomo Electric Industries Ltd, Cisco Systems, Inc., NEC Corporation, Lumentum Operations LLC
Key Drivers • Increased need for modern communications
• The need for cloud-based services is increasing
Market Opportunities • Growing Innovation
• Demand for digital services.


Frequently Asked Questions

Ans: The Optical Transceiver Market is to grow at a CAGR of 15.3% over the forecast period 2023-2030.

Ans:  The Optical Transceiver Market is estimated to reach US$ 27.33 Bn by 2030.

Ans: The Optical Transceiver market size was valued at USD 8.75 Bn in 2022.

Ans: North America is dominating the Market

Ans : Increased need for modern communications and The need for cloud-based services is increasing.

Table of Contents

1. Introduction
1.1 Market Definition
1.2 Scope
1.3 Research Assumptions

2. Research Methodology

3. Market Dynamics
3.1 Drivers
3.2 Restraints
3.3 Opportunities
3.4 Challenges

4. Impact Analysis
4.1 Impact of the Russia-Ukraine War
4.2 Impact of Ongoing Recession
4.2.1 Introduction
4.2.2 Impact on major economies
4.2.2.1 US
4.2.2.2 Canada
4.2.2.3 Germany
4.2.2.4 France
4.2.2.5 United Kingdom
4.2.2.6 China
4.2.2.7 Japan
4.2.2.8 South Korea
4.2.2.9 Rest of the World
4.3 Supply Demand Gap Analysis

5. Value Chain Analysis

6. Porter’s 5 forces model

7. PEST Analysis

8. Optical Transceiver market Segmentation, By form factor
8.1 SFF & SFP
8.2 QSFP
8.3 CFP
8.4 XFP
8.5 CFP

9. Optical Transceiver market Segmentation, By Data Rate
9.1 Less than 10 Gbps
9.2 Gbps to 40 Gbps
9.3 Gbps to 100 Gbps
9.4 More than 100 Gbps

10. Optical Transceiver market Segmentation, By Fiber Type
10.1 Single-mode fiber
10.2 Multimode fiber

11. Optical Transceiver market Segmentation, By Distance
11.1 Less than 1 km
11.2 1-10 km
11.3 11-100 km
11.4 More than 100 km

12. Optical Transceiver market Segmentation, By Wavelength
12.1 850 nm band
12.2 1310 nm band
12.3 1550 nm band
12.4 Others

13. Optical Transceiver market Segmentation, By Application
13.1 Telecommunication
13.2 Data centers

14. Optical Transceiver market Segmentation, By Connector
14.1 LC connector
14.2 SC connector
14.3 MPO connector
14.4 RJ-45

15. Regional Analysis
15.1 Introduction
15.2 North America
15.2.1 North America Optical Transceiver market by Country
15.2.2North America Optical Transceiver market by form factor
15.2.3 North America Optical Transceiver market by data rate
15.2.4 North America Optical Transceiver market by fiber type
15.2.5 North America Optical Transceiver market by distance
15.2.6 North America Optical Transceiver market by wavelength
15.2.7 North America Optical Transceiver market by Application
15.2.8 North America Optical Transceiver market by connector
15.2.9 USA
15.2.9.1 USA Optical Transceiver market by form factor
15.2.9.2 USA Optical Transceiver market by data rate
15.2.9.3 USA Optical Transceiver market by fiber type
15.2.9.4 USA Optical Transceiver market by distance
15.2.9.5 USA Optical Transceiver market by wavelength
15.2.9.6 USA Optical Transceiver market by Application
15.2.9.7 USA Optical Transceiver market by Connector
15.2.10 Canada
15.2.10.1 Canada Optical Transceiver market by form factor
15.2.10.2 Canada Optical Transceiver market by data rate
15.2.10.3 Canada Optical Transceiver market by fiber type
15.2.10.4 Canada Optical Transceiver market by Distance
15.2.10.5 Canada Optical Transceiver market by Wavelength
15.2.10.6 Canada Optical Transceiver market by Application
15.2.10.7Canada Optical Transceiver market by Connector
15.2.11 Mexico
15.2.11.1 Mexico Optical Transceiver market by form factor
15.2.11.2 Mexico Optical Transceiver market by data rate
15.2.11.3 Mexico Optical Transceiver market by fiber type
15.2.11.4 Mexico Optical Transceiver market by distance
15.2.11.5 Mexico Optical Transceiver market by wavelength
15.2.11.6 Mexico Optical Transceiver market by Application
15.2.11.7 Mexico Optical Transceiver market by Connector
15.3 Europe
15.3.1 Europe Optical Transceiver market by Country
1.3.3.2 Europe Optical Transceiver market by form factor
15.3.3 Europe Optical Transceiver market by data rate
15.3.4 Europe Optical Transceiver market by fiber type
15.3.5 Europe Optical Transceiver market by distance
15.3.6 Europe Optical Transceiver market by wavelength
15.3.7 Europe Optical Transceiver market by Application
15.3.8 Europe Optical Transceiver market by Connector
15.3.9Germany
15.3.9.1 Germany Optical Transceiver market by form factor
15.3.9.2 Germany Optical Transceiver market by data rate
15.3.9.3 Germany Optical Transceiver market by fiber type
15.3.9.4 Germany Optical Transceiver market by distance
15.3.9.5 Germany Optical Transceiver market by wavelength
15.3.9.6 Germany Optical Transceiver market by Application
15.3.9.7Germany Optical Transceiver market by Connector
15.3.10 UK
15.3.10.1 UK Optical Transceiver market by form factor
15.3.10.2 UK Optical Transceiver market by data rate
15.3.10.3 UK Optical Transceiver market by fiber type
15.3.10.4 UK Optical Transceiver market by distance
15.3.10.5 UK Optical Transceiver market by wavelength
15.3.10.6 UK Optical Transceiver market by Application
15.3.10.7 UK Optical Transceiver market by Connector
15.3.11 France
15.3.11.1 France Optical Transceiver market by form factor
15.3.11.2 France Optical Transceiver market by data rate
15.3.11.3 France Optical Transceiver market by fiber type
15.3.11.4 France Optical Transceiver market by distance
15.3.11.5 France Optical Transceiver market by wavelength
15.3.11.6 France Optical Transceiver market by Application
15.3.11.7 France Optical Transceiver market by Connector
15.3.12 Italy
15.3.12.1 Italy Optical Transceiver market by form factor
15.3.12.2 Italy Optical Transceiver market by data rate
15.3.12.3 Italy Optical Transceiver market by fiber type
15.3.12.4 Italy Optical Transceiver market by distance
15.3.12.5 Italy Optical Transceiver market by wavelength
15.3.12.6 Italy Optical Transceiver market by Application
15.3.12.7 Italy Optical Transceiver market by Connector
15.3.13 Spain
15.3.13.1 Spain Optical Transceiver market by form factor
15.3.13.2 Spain Optical Transceiver market by data rate
15.3.13.3 Spain Optical Transceiver market by fiber type
15.3.13.4 Spain Optical Transceiver market by distance
15.3.13.5 Spain Optical Transceiver market by wavelength
15.3.13.6 Spain Optical Transceiver market by Application
15.3.13.7 Spain Optical Transceiver market by Connector
15.3.14 The Netherlands
15.3.14.1 Netherlands Optical Transceiver market by form factor
15.3.14.2 Netherlands Optical Transceiver market by data rate
15.3.14.3 Netherlands Optical Transceiver market by fiber type
15.3.14.4 Netherlands Optical Transceiver market by distance
15.3.14.5 Netherlands Optical Transceiver market by wavelength
15.3.14.6Netherlands Optical Transceiver market by Application
15.3.14.7 Netherlands Optical Transceiver market by Connector
15.3.15 Rest of Europe
15.3.15.1 Rest of Europe Optical Transceiver market by form factor
15.3.15.2 Rest of Europe Optical Transceiver market by data rate
15.3.15.3 Rest of Europe Optical Transceiver market by fiber type
15.3.15.4 Rest of Europe Optical Transceiver market by distance
15.3.15.5 Rest of Europe Optical Transceiver market by wavelength
15.3.15.6 Rest of Europe Optical Transceiver market by Application
15.3.15.7 Rest of Europe Optical Transceiver market by Connector
15.4 Asia-Pacific
15.4.1 Asia Pacific Optical Transceiver market by Country
15.4.2 Asia Pacific Optical Transceiver market by form factor
15.4.3 Asia Pacific Optical Transceiver market by data rate
15.4.4Asia Pacific Optical Transceiver market by fiber type
15.4.5Asia Pacific Optical Transceiver market by distance
15.4.6 Asia Pacific Optical Transceiver market by wavelength
15.4.7 Asia Pacific Optical Transceiver market by Application
15.4.8 Asia Pacific Optical Transceiver market by Connector
15.4.9 Japan
15.4.9.1 Japan Optical Transceiver market by form factor
15.4.9.2 Japan Optical Transceiver market by data rate
15.4.9.3 Japan Optical Transceiver market by fiber type
15.4.9.4 Japan Optical Transceiver market by distance
15.4.9. 5 Japan Optical Transceiver market by wavelength
15.4.9. 6 Japan Optical Transceiver market by Application
15.4.9. 7 Japan Optical Transceiver market by Connector
15.4.10 South Korea
15.4.10.1 South Korea Optical Transceiver market by form factor
15.4.10.2 South Korea Optical Transceiver market by data rate
15.4.10.3 South Korea Optical Transceiver market by fiber type
15.4.10.4 South Korea Optical Transceiver market by distance
15.4.10.5 South Korea Optical Transceiver market by wavelength
15.4.10.6 South Korea Optical Transceiver market by Application
15.4.10.7 South Korea Optical Transceiver market by Connector
15.4.11 China
15.4.11.1 China Optical Transceiver market by form factor
15.4.11.2 China Optical Transceiver market by data rate
15.4.11.3 China Optical Transceiver market by fiber type
15.4.11.4 China Optical Transceiver market by distance
15.4.11.5 China Optical Transceiver market by wavelength
15.4.11.6 China Optical Transceiver market by Application
15.4.11.7 China Optical Transceiver market by Connector
15.4.12 India
15.4.12.1 India Optical Transceiver market by form factor
15.4.12.2 India Optical Transceiver market by data rate
15.4.12.3 India Optical Transceiver market by fiber type
15.4.12.4 India Optical Transceiver market by distance
15.4.12.5 India Optical Transceiver market by wavelength
15.4.12.6 India Optical Transceiver market by Application
15.4.12.7 India Optical Transceiver market by Connector
15.4.13 Australia
15.4.13.1 Australia Optical Transceiver market by form factor
15.4.13.2 Australia Optical Transceiver market by data rate
15.4.13.3 Australia Optical Transceiver market by fiber type
15.4.13.4 Australia Optical Transceiver market by distance
15.4.13.5 Australia Optical Transceiver market by wavelength
15.4.13.6 Australia Optical Transceiver market by Application
15.4.13.7 Australia Optical Transceiver market by Connector
15.4.14 Rest of Asia-Pacific
15.4.14.1 APAC Optical Transceiver market by form factor
15.4.14.2 APAC Optical Transceiver market by data rate
15.4.14.3 APAC Optical Transceiver market by fiber type
15.4.14.4 APAC Optical Transceiver market by distance
15.4.14.5 APAC Optical Transceiver market by wavelength
15.4.14.6 APAC Optical Transceiver market by Application
15.4.14.7 APAC Optical Transceiver market by Connector
15.5 The Middle East & Africa
15.5.1 The Middle East & Africa Optical Transceiver market by Country
15.5.2 The Middle East & Africa Optical Transceiver market by form factor
15.5.3 The Middle East & Africa Optical Transceiver market by data rate
15.5.4 The Middle East & Africa Optical Transceiver market by fiber type
15.5.5 The Middle East & Africa Optical Transceiver market by distance
15.5.6 The Middle East & Africa Optical Transceiver market by wavelength
15.5.7 The Middle East & Africa Optical Transceiver market by Application
15.5.8 The Middle East & Africa Optical Transceiver market by Connector
15.5.9 Israel
15.5.9.1 Israel Optical Transceiver market by form factor
15.5.9.2 Israel Optical Transceiver market by data rate
15.5.9.3 Israel Optical Transceiver market by fiber type
15.5.9.4 Israel Optical Transceiver market by distance
15.5.9.5 Israel Optical Transceiver market by wavelength
15.5.9.6 Israel Optical Transceiver market by Application
15.5.9.7 Israel Optical Transceiver market by Connector
15.5.10 UAE
15.5.10.1 UAE Optical Transceiver market by form factor
15.5.10.2 UAE Optical Transceiver market by data rate
15.5.10.3 UAE Optical Transceiver market by fiber type
15.5.10.4 UAE Optical Transceiver market by distance
15.5.10.5 UAE Optical Transceiver market by wavelength
15.5.10.6 UAE Optical Transceiver market by Application
15.5.10.7 UAE Optical Transceiver market by Connector
15.5.11 South Africa
15.5.11.1 South Africa Optical Transceiver market by form factor
15.5.11.2 South Africa Optical Transceiver market by data rate
15.5.11.3 South Africa Optical Transceiver market by fiber type
15.5.11.4 South Africa Optical Transceiver market by distance
15.5.11.5 South Africa Optical Transceiver market by wavelength
15.5.11.6 South Africa Optical Transceiver market by Application
15.5.11.7 South Africa Optical Transceiver market by Connector
15.5.12 Rest of Middle East & Africa
15.5.12.1 Rest of Middle East & Asia Optical Transceiver market by form factor
15.5.12.2 Rest of Middle East & Asia Optical Transceiver market by data rate
15.5.12.3 Rest of Middle East & Asia Optical Transceiver market Phase
15.5.12.4 Rest of Middle East & Asia Optical Transceiver market by distance
15.5.12.5 Rest of Middle East & Asia Optical Transceiver market by wavelength
15.5.12.6 Rest of Middle East & Asia Optical Transceiver market by Application
15.5.12.7 Rest of Middle East & Asia Optical Transceiver market by Connector
15.6 Latin America
15.6.1 Latin America Optical Transceiver market by Country
15.6.2 Latin America Optical Transceiver market by form factor
15.6.3 Latin America Optical Transceiver market by data rate
15.6.4 Latin America Optical Transceiver market by fiber type
15.6.5 Latin America Optical Transceiver market by distance
15.6.6 Latin America Optical Transceiver market by wavelength
15.6.7 Latin America Optical Transceiver market by Application
15.6.8 Latin America Optical Transceiver market by Connector
15.6.9 Brazil
15.6.9.1 Brazil Optical Transceiver market by form factor
15.6.9.2 Brazil Africa Optical Transceiver market by data rate
15.6.9.3 Brazil Optical Transceiver market by fiber type
15.6.9.4 Brazil Optical Transceiver market by distance
15.6.9.5 Brazil Optical Transceiver market by wavelength
15.6.9.6 Brazil Optical Transceiver market by Application
15.6.9.7 Brazil Optical Transceiver market by Connector
15.6.10 Argentina
15.6.10.1 Argentina Optical Transceiver market by form factor
15.6.10.2 Argentina Optical Transceiver market by data rate
15.6.10.3 Argentina Optical Transceiver market by fiber type
15.6.10.4 Argentina Optical Transceiver market by distance
15.6.10.5 Argentina Optical Transceiver market by wavelength
15.6.10.6 Argentina Optical Transceiver market by Application
15.6.10.7 Argentina Optical Transceiver market by Connector
15.6.11 Rest of Latin America
15.6.11.1 Rest of Latin America Optical Transceiver market by form factor
15.6.11.2 Rest of Latin America Optical Transceiver market by data rate
15.6.11.3 Rest of Latin America Optical Transceiver market by fiber type
15.6.11.4 Rest of Latin America Optical Transceiver market by distance
15.6.11.5 Rest of Latin America Optical Transceiver market by wavelength
15.6.11.6 Rest of Latin America Optical Transceiver market by Application
15.6.11.7 Rest of Latin America Optical Transceiver market by Connector

16. Company Profile
16.1 ZTE Corporation
16.1.1 Market Overview
16.1.2 Financials
16.1.3 Product/Services/Offerings
16.1.4 SWOT Analysis
16.1.5 The SNS View
16.2 A Arista Networks Inc
16.2.1 Market Overview
16.2.2 Financials
16.2.3 Product/Services/Offerings
16.2.4 SWOT Analysis
16.2.5 The SNS View
16.3 Huawei Technologies Co., Ltd.
16.3.1 Market Overview
16.3.2 Financials
16.3.3 Product/Services/Offerings
16.3.4 SWOT Analysis
16.3.5 The SNS View
16.4 Fujitsu Optical Components Limited
16.4.1 Market Overview
16.4.2 Financials
16.4.3 Product/Services/Offerings
16.4.4 SWOT Analysis
16.4.5 The SNS View
16.5 Broadcom Inc.,
16.5.1 Market Overview
16.5.2 Financials
16.5.3 Product/Services/Offerings
16.5.4 SWOT Analysis
16.5.5 The SNS View
16.6 Juniper Networks, Inc.,
16.6.1 Market Overview
16.6.2 Financials
16.6.3 Product/Services/Offerings
16.6.4 SWOT Analysis
16.6.5 The SNS View
16.7 Sumitomo Electric Industries Ltd.
16.7.1 Market Overview
16.7.2 Financials
16.7.3 Product/Services/Offerings
16.7.4 SWOT Analysis
16.7.5 The SNS View
16.8 Cisco Systems, Inc.,
16.8.1 Market Overview
16.8.2 Financials
16.8.3 Product/Services/Offerings
16.8.4 SWOT Analysis
16.8.5 The SNS View
16.9 NEC Corporation
16.9.1 Market Overview
16.9.2 Financials
16.9.3 Product/Services/Offerings
16.9.4 SWOT Analysis
16.9.5 The SNS View
16.10 Lumentum Operations LLC
16.10.1 Market Overview
16.10.2 Financials
16.10.3 Product/Services/Offerings
16.10.4 SWOT Analysis
16.10.5 The SNS View

17. Competitive Landscape
17.1 Competitive Benchmarking
17.2 Market Share Analysis
17.3 Recent Developments

18. USE Cases And Best Practices

19. Conclusion

An accurate research report requires proper strategizing as well as implementation. There are multiple factors involved in the completion of good and accurate research report and selecting the best methodology to compete the research is the toughest part. Since the research reports we provide play a crucial role in any company’s decision-making process, therefore we at SNS Insider always believe that we should choose the best method which gives us results closer to reality. This allows us to reach at a stage wherein we can provide our clients best and accurate investment to output ratio.

Each report that we prepare takes a timeframe of 350-400 business hours for production. Starting from the selection of titles through a couple of in-depth brain storming session to the final QC process before uploading our titles on our website we dedicate around 350 working hours. The titles are selected based on their current market cap and the foreseen CAGR and growth.


The 5 steps process:

Step 1: Secondary Research:

Secondary Research or Desk Research is as the name suggests is a research process wherein, we collect data through the readily available information. In this process we use various paid and unpaid databases which our team has access to and gather data through the same. This includes examining of listed companies’ annual reports, Journals, SEC filling etc. Apart from this our team has access to various associations across the globe across different industries. Lastly, we have exchange relationships with various university as well as individual libraries.

Secondary Research

Step 2: Primary Research

When we talk about primary research, it is a type of study in which the researchers collect relevant data samples directly, rather than relying on previously collected data.  This type of research is focused on gaining content specific facts that can be sued to solve specific problems. Since the collected data is fresh and first hand therefore it makes the study more accurate and genuine.

We at SNS Insider have divided Primary Research into 2 parts.

Part 1 wherein we interview the KOLs of major players as well as the upcoming ones across various geographic regions. This allows us to have their view over the market scenario and acts as an important tool to come closer to the accurate market numbers. As many as 45 paid and unpaid primary interviews are taken from both the demand and supply side of the industry to make sure we land at an accurate judgement and analysis of the market.

This step involves the triangulation of data wherein our team analyses the interview transcripts, online survey responses and observation of on filed participants. The below mentioned chart should give a better understanding of the part 1 of the primary interview.

Primary Research

Part 2: In this part of primary research the data collected via secondary research and the part 1 of the primary research is validated with the interviews from individual consultants and subject matter experts.

Consultants are those set of people who have at least 12 years of experience and expertise within the industry whereas Subject Matter Experts are those with at least 15 years of experience behind their back within the same space. The data with the help of two main processes i.e., FGDs (Focused Group Discussions) and IDs (Individual Discussions). This gives us a 3rd party nonbiased primary view of the market scenario making it a more dependable one while collation of the data pointers.

Step 3: Data Bank Validation

Once all the information is collected via primary and secondary sources, we run that information for data validation. At our intelligence centre our research heads track a lot of information related to the market which includes the quarterly reports, the daily stock prices, and other relevant information. Our data bank server gets updated every fortnight and that is how the information which we collected using our primary and secondary information is revalidated in real time.

Data Bank Validation

Step 4: QA/QC Process

After all the data collection and validation our team does a final level of quality check and quality assurance to get rid of any unwanted or undesired mistakes. This might include but not limited to getting rid of the any typos, duplication of numbers or missing of any important information. The people involved in this process include technical content writers, research heads and graphics people. Once this process is completed the title gets uploader on our platform for our clients to read it.

Step 5: Final QC/QA Process:

This is the last process and comes when the client has ordered the study. In this process a final QA/QC is done before the study is emailed to the client. Since we believe in giving our clients a good experience of our research studies, therefore, to make sure that we do not lack at our end in any way humanly possible we do a final round of quality check and then dispatch the study to the client.

Start a Conversation

Hi! Click one of our member below to chat on Phone