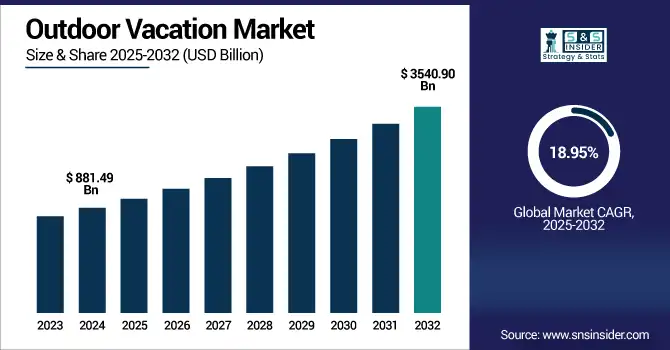
Outdoor Vacation Market was valued at USD 881.49 billion in 2024 and is expected to reach USD 3540.90 billion by 2032, growing at a CAGR of 18.95% from 2025-2032.
The Outdoor Vacation Market is witnessing robust growth due to rising consumer interest in nature-based experiences, wellness tourism, and adventure travel. Increasing awareness about physical and mental health benefits associated with outdoor activities, coupled with growing disposable incomes, is encouraging more people to explore natural destinations. Post-pandemic lifestyle shifts have further boosted demand for open-air, socially distanced travel. Government initiatives promoting eco-tourism and infrastructure development in remote regions are also enhancing accessibility. Additionally, social media influence and digital platforms are making outdoor travel more appealing and easier to plan, accelerating participation among younger, experience-driven travelers across the globe.
Data Axle and Overseas Adventure Travel (O.A.T.), which targets travelers aged 50 and above, have enhanced engagement using AI-driven data for personalized marketing across email, social, and direct mail channels to boost customer acquisition.
Meanwhile, Backroads expanded its Women’s Adventures program for 2025, adding over 40 new walking and hiking itineraries with more than 125 departures worldwide.
U.S. Outdoor Vacation Market was valued at USD 221.99 billion in 2024 and is expected to reach USD 866.83 billion by 2032, growing at a CAGR of 18.56% from 2025-2032.
The U.S. Outdoor Vacation Market is growing due to rising health consciousness, increasing demand for adventure and nature-based experiences, and strong domestic travel trends. Technological ease in planning trips and expanding eco-tourism infrastructure also contribute to market expansion.
Drivers
Growing demand for nature-based experiences is fueling the rise in outdoor vacations among urban and millennial populations worldwide.
Urban fatigue, increased mental health awareness, and the growing preference for digital detox are pushing travelers toward immersive nature-based outdoor vacations. Millennials and Gen Z travelers, in particular, are increasingly valuing meaningful travel experiences like hiking, camping, or eco-tours over luxury or conventional holidays. As wellness and sustainability trends influence travel preferences, national parks, trails, beaches, and mountains are seeing unprecedented interest. Governments promoting eco-tourism and improved access to remote outdoor locations further bolster market growth, driving the outdoor vacation segment upward globally.
Restraints
Unpredictable weather conditions and climate change impacts are limiting outdoor vacation planning and affecting traveler confidence significantly.
Extreme weather events, rising temperatures, wildfires, floods, and unseasonal storms are increasingly disrupting outdoor vacation plans and deterring potential tourists. Activities like hiking, camping, or skiing are directly impacted by environmental volatility, which not only reduces travel demand but also strains local tourism operators. Climate change has led to temporary closures of national parks, trail systems, and coastal destinations, limiting availability. This unpredictability makes planning and insuring such trips more difficult for both consumers and providers. As environmental risks grow more frequent, weather-related concerns stand as a formidable barrier to consistent outdoor vacation market expansion.
Opportunities
Rising focus on sustainable tourism presents major growth opportunities for eco-conscious outdoor vacation providers and destinations worldwide.
The increasing global emphasis on environmental preservation, conservation travel, and low-impact experiences is aligning well with the outdoor vacation sector. Eco-lodges, carbon-neutral tours, and community-based travel models are gaining traction among consumers. Travelers now prefer destinations that promote leave-no-trace policies, waste management systems, and wildlife protection. Governments and NGOs are investing in sustainable tourism frameworks, offering incentives for green infrastructure. This paves the way for local businesses and tour operators to expand offerings that cater to responsible travelers. Embracing eco-certification, low-emission transport, and regenerative tourism can open new markets for the outdoor vacation industry.
Challenges
Safety concerns and lack of preparedness for outdoor emergencies deter tourists from engaging in remote adventure travel.
Outdoor vacations often involve remote terrain, unpredictable weather, and physical challenges that can result in accidents or medical emergencies. Many travelers lack proper training or underestimate risks associated with hiking, rafting, or wildlife encounters. Limited access to medical services, emergency communication gaps, and inadequate guiding standards further heighten the danger. This leads to lower participation from cautious segments such as families, older adults, and solo travelers. Liability concerns and rising insurance costs also disincentivize operators. Unless safety infrastructure, traveler education, and preparedness improve, safety fears will continue to hinder broader adoption of outdoor vacations.
By Age Group
Millennials dominated the Outdoor Vacation Market in 2024 with a 48% revenue share due to their strong preference for experiential and wellness-driven travel. Their financial independence, work flexibility, and desire for digital detox experiences fueled demand for hiking, camping, and eco-tourism. Social media influence and a strong inclination toward sustainable, meaningful getaways made this segment the most active and high-spending group in the outdoor travel landscape.
Generation Z is projected to grow at the fastest CAGR of 20.81% from 2025 to 2032 owing to their early adoption of adventure travel and digital-first planning behavior. This tech-savvy group seeks unique, off-the-beaten-path outdoor experiences driven by social influence and climate consciousness. Their growing disposable income and prioritization of values-driven travel, such as sustainability and inclusivity, are making Gen Z an emerging powerhouse in the outdoor vacation market.
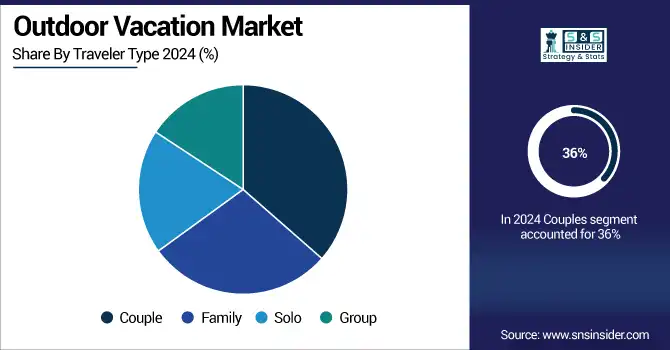
By Traveler Type
Couples held the highest revenue share of 36% in the Outdoor Vacation Market in 2024 due to rising demand for romantic and adventure-filled getaways. Popular choices include glamping, trekking, and wellness retreats that offer seclusion, scenic beauty, and bonding experiences. With higher discretionary income and interest in short, frequent outdoor escapes, couples increasingly seek personalized and luxury-based outdoor vacations that blend nature with comfort and emotional connection.
Families are expected to grow at a CAGR of 20.76% from 2025 to 2032, driven by increased interest in multigenerational outdoor experiences. Parents seek nature-based vacations to disconnect from screens and foster active lifestyles for children. National parks, guided camping tours, and nature-based learning programs attract this segment. Additionally, safety-focused offerings and improved accessibility are encouraging more families to opt for outdoor vacations as a wholesome bonding experience.
By Tour Type
Leisure tour segment dominated the Outdoor Vacation Market in 2024 with a 41% revenue share due to the rising preference for relaxing, scenic, and rejuvenating getaways. Tourists increasingly seek slow-paced outdoor experiences like nature walks, lakeside stays, and countryside retreats for stress relief and digital detox. This segment appeals to diverse age groups, especially working professionals and retirees. From 2025 to 2032, it is expected to grow at a CAGR of 19.55% as wellness tourism, scenic exploration, and sustainable travel become core lifestyle preferences among global travelers.
By Mode of Booking
OTA segment captured the highest revenue share of 66% in 2024 in the Outdoor Vacation Market due to its convenience, price transparency, and wide choice offerings. Online travel agencies provide streamlined booking, real-time information, and customer reviews, empowering travelers to plan personalized outdoor vacations with ease. Their mobile-friendly platforms and integrated itineraries attract tech-savvy millennials and Gen Z travelers. From 2025 to 2032, this segment is projected to grow at the fastest CAGR of 19.64% as digital adoption, contactless booking, and dynamic packaging continue transforming outdoor travel planning globally.
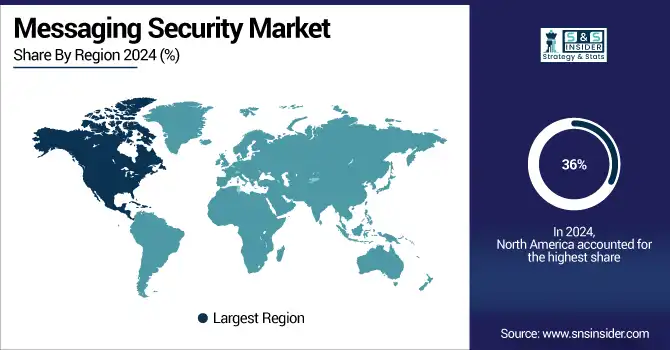
North America dominated the Outdoor Vacation Market in 2024 with a 36% revenue share due to its vast natural landscapes, well-developed tourism infrastructure, and strong outdoor culture. National parks, coastal routes, and mountain trails attract millions of domestic and international travelers. High disposable incomes, strong participation in adventure tourism, and government investment in eco-tourism further boosted North America's position as the leading outdoor vacation destination globally.
The United States is dominating the Outdoor Vacation Market due to its vast natural parks, advanced infrastructure, and high domestic travel participation across all age groups.
Asia Pacific is expected to grow at the fastest CAGR of 21.41% from 2025 to 2032, driven by rising middle-class income, increasing interest in adventure tourism, and expanding tourism infrastructure. Countries like India, China, and Southeast Asian nations are seeing growing demand for outdoor travel among younger populations. Government campaigns promoting domestic tourism and nature-based experiences are accelerating growth, along with better digital connectivity and accessibility to previously untapped natural destinations.
China is dominating the Outdoor Vacation Market in Asia Pacific due to its vast natural landscapes, rising middle-class travel demand, and strong domestic tourism infrastructure.
Europe plays a significant role in the Outdoor Vacation Market, driven by rich natural diversity, strong cross-border travel, and government-supported eco-tourism initiatives. Countries like Germany, France, and the UK lead due to their developed infrastructure and outdoor travel culture.
Germany is dominating the Outdoor Vacation Market in Europe due to its strong domestic tourism, outdoor culture, and well-connected national parks and nature reserves.
The Middle East & Africa and Latin America are emerging in the Outdoor Vacation Market, supported by growing adventure tourism, unique landscapes, and cultural heritage. Improved infrastructure, eco-tourism efforts, and increasing international arrivals are boosting regional outdoor travel growth.
Outdoor Vacation Market companies are Tauck, Inc., TUI Group, JTB Americas, Ltd., Scott Dunn Ltd., Butterfield & Robinson, Travel Leaders Group, Travcoa Corporation, American Express Travel, Thomas Cook India Ltd., Carlson Wagonlit Travel (CWT), Cox and Kings Ltd., Expedia Group, World Travel, Inc., Abercrombie & Kent USA LLC, Kensington Tours, Priceline (Booking Holdings Inc.), Micato Safaris, G Adventures, Intrepid Travel, REI Adventures (REI Co-op)
2025 – Expedia launched its Island Hot List, showcasing top global islands based on verified traveler data with interest rising ~30%, including Koh Samui, Jamaica, Fiji, Paros, and Sardinia
2024 –Expedia, Hotels.com, and Vrbo released Unpack '25 travel trends: Detour Destinations, JOMO Travel, One‑Click Trips, guiding nature‑driven and less crowded outdoor travel in 2025.
2024 – Tauck partners with Approach Guides to launch enhanced Content Experiences, enabling travel advisors to customize co‑branded marketing pages with group‑specific itinerary, pricing, and messaging to boost river cruise group sales.
Report Attributes | Details |
---|---|
Market Size in 2024 | USD 881.49 Billion |
Market Size by 2032 | USD 3504.90 Billion |
CAGR | CAGR of 18.95% From 2025 to 2032 |
Base Year | 2024 |
Forecast Period | 2025-2032 |
Historical Data | 2021-2023 |
Report Scope & Coverage | Market Size, Segments Analysis, Competitive Landscape, Regional Analysis, DROC & SWOT Analysis, Forecast Outlook |
Key Segments | • By Tour Type (Volunteering Trips, Culinary Tour, Leisure Tour, Heritage Trip, Others) • By Traveler Type (Couple, Family, Solo, Group) • By Age Group (Generation Z, Millennial, Baby Boomers) • By Mode of Booking (Travel Agent, OTA) |
Regional Analysis/Coverage | North America (US, Canada), Europe (Germany, UK, France, Italy, Spain, Russia, Poland, Rest of Europe), Asia Pacific (China, India, Japan, South Korea, Australia, ASEAN Countries, Rest of Asia Pacific), Middle East & Africa (UAE, Saudi Arabia, Qatar, South Africa, Rest of Middle East & Africa), Latin America (Brazil, Argentina, Mexico, Colombia, Rest of Latin America) |
Company Profiles | Tauck, Inc., TUI Group, JTB Americas, Ltd., Scott Dunn Ltd., Butterfield & Robinson, Travel Leaders Group, Travcoa Corporation, American Express Travel, Thomas Cook India Ltd., Carlson Wagonlit Travel (CWT), Cox and Kings Ltd., Expedia Group, World Travel, Inc., Abercrombie & Kent USA LLC, Kensington Tours, Priceline (Booking Holdings Inc.), Micato Safaris, G Adventures, Intrepid Travel, REI Adventures (REI Co-op) |
Ans: The Outdoor Vacation Market is expected to grow at a CAGR of 18.95% from 2025 to 2032, driven by rising demand for nature-based travel.
Ans: In 2024, the Outdoor Vacation Market was valued at USD 881.49 billion globally, with strong growth across wellness, adventure, and eco-tourism segments.
Ans: Rising interest in wellness, eco-tourism, and adventure travel is driving demand for nature-based outdoor vacations among millennials and Gen Z travelers.
Ans: The leisure tour segment dominated the market with a 41% share in 2024 and is expected to grow fastest at a 19.55% CAGR.
Ans: North America led the market in 2024 with a 36% revenue share, driven by its vast natural parks, tourism infrastructure, and high domestic participation.
Table Of Contents
1. Introduction
1.1 Market Definition & Scope
1.2 Research Assumptions & Abbreviations
1.3 Research Methodology
2. Executive Summary
2.1 Market Snapshot
2.2 Market Absolute $ Opportunity Assessment & Y-o-Y Analysis, 2021–2032
2.3 Market Size & Forecast, By Segmentation, 2021–2032
2.3.1 Market Size By Traveler Type
2.3.2 Market Size By Age Group
2.3.3 Market Size By Tour Type
2.3.4 Market Size By Mode of Booking
2.4 Market Share & Bps Analysis By Region, 2024
2.5 Industry Growth Scenarios – Conservative, Likely & Optimistic
2.6 Industry CxO’s Perspective
3. Market Overview
3.1 Market Dynamics
3.1.1 Drivers
3.1.2 Restraints
3.1.3 Opportunities
3.1.4 Key Market Trends
3.2 Industry PESTLE Analysis
3.3 Key Industry Forces (Porter’s) Impacting Market Growth
3.4 Industry Supply Chain Analysis
3.4.1 Raw Material Suppliers
3.4.2 Manufacturers
3.4.3 Distributors/Suppliers
3.4.4 Customers/End-Users
3.5 Industry Life Cycle Assessment
3.6 Parent Market Overview
3.7 Market Risk Assessment
4. Statistical Insights & Trends Reporting
4.1 Tourism Flow & Participation Metrics
4.1.1 Overview
4.1.2 Number of Domestic vs. International Outdoor Travelers (in Millions)
4.1.3 % Share of Total Tourism Attributed to Outdoor Vacations
4.1.4 Year-on-Year Growth Rate in Outdoor Tourism Participation (%)
4.1.5 Share of First-Time vs. Repeat Outdoor Vacationers (%)
4.1.6 Average Number of Outdoor Vacations Per Traveler Per Year
4.2 Spending & Budget Patterns
4.2.1 Overview
4.2.2 Average Spending Per Outdoor Vacation
4.2.3 % Breakdown of Spending: Accommodation, Travel, Gear, Experiences
4.2.4 Budget vs. Luxury Outdoor Vacation Spending Comparison
4.2.5 Average Cost Per Day by Outdoor Activity
4.3 Duration & Seasonality
4.3.1 Overview
4.3.2 Average Duration of Outdoor Vacations (in Days)
4.3.3 % of Trips Taken During Peak vs. Off-Season
4.3.4 Seasonal Demand Index (Q1–Q4)
4.3.5 Top 3 Months by Outdoor Vacation Volume
4.4 Technology Adoption
4.4.1 Overview
4.4.2 % of Travelers Using Fitness Trackers, Smart Maps, Outdoor Apps
4.4.3 VR/AR Usage in Planning Outdoor Vacations (% of Travelers)
4.4.4 % of Outdoor Tourists Influenced by Social Media/Influencers
4.4.5 Wearable Device Adoption Rate Among Outdoor Tourists
5. Outdoor Vacation Market Segmental Analysis & Forecast, By Traveler Type, 2021 – 2032, Value (USD Billion)
5.1 Introduction
5.2 Couple
5.2.1 Key Trends
5.2.2 Market Size & Forecast, 2021 – 2032
5.3 Family
5.3.1 Key Trends
5.3.2 Market Size & Forecast, 2021 – 2032
5.4 Solo
5.4.1 Key Trends
5.4.2 Market Size & Forecast, 2021 – 2032
5.5 Group
5.5.1 Key Trends
5.5.2 Market Size & Forecast, 2021 – 2032
6. Outdoor Vacation Market Segmental Analysis & Forecast, By Age Group, 2021 – 2032, Value (USD Billion)
6.1 Introduction
6.2 Generation Z
6.2.1 Key Trends
6.2.2 Market Size & Forecast, 2021 – 2032
6.3 Millennial
6.3.1 Key Trends
6.3.2 Market Size & Forecast, 2021 – 2032
6.4 Baby Boomers
6.4.1 Key Trends
6.4.2 Market Size & Forecast, 2021 – 2032
7. Outdoor Vacation Market Segmental Analysis & Forecast, By Mode of Booking, 2021 – 2032, Value (USD Billion)
7.1 Introduction
7.2 Travel Agent
7.2.1 Key Trends
7.2.2 Market Size & Forecast, 2021 – 2032
7.3 OTA
7.3.1 Key Trends
7.3.2 Market Size & Forecast, 2021 – 2032
8. Outdoor Vacation Market Segmental Analysis & Forecast, By Tour Type, 2021 – 2032, Value (USD Billion)
8.1 Introduction
8.2 Volunteering trips
8.2.1 Key Trends
8.2.2 Market Size & Forecast, 2021 – 2032
8.3 Culinary Tour
8.3.1 Key Trends
8.3.2 Market Size & Forecast, 2021 – 2032
8.4 Leisure Tour
8.4.1 Key Trends
8.4.2 Market Size & Forecast, 2021 – 2032
8.5 Heritage trip
8.5.1 Key Trends
8.5.2 Market Size & Forecast, 2021 – 2032
8.6 Others
8.6.1 Key Trends
8.6.2 Market Size & Forecast, 2021 – 2032
9. Outdoor Vacation Market Segmental Analysis & Forecast By Region, 2021 – 2025, Value (USD Billion)
9.1 Introduction
9.2 North America
9.2.1 Key Trends
9.2.2 Outdoor Vacation Market Size & Forecast, By Traveler Type, 2021 – 2032
9.2.3 Outdoor Vacation Market Size & Forecast, By Age Group, 2021 – 2032
9.2.4 Outdoor Vacation Market Size & Forecast, By Mode of Booking, 2021 – 2032
9.2.5 Outdoor Vacation Market Size & Forecast, By Tour Type, 2021 – 2032
9.2.6 Outdoor Vacation Market Size & Forecast, By Country, 2021 – 2032
9.2.6.1 USA
9.2.6.1.1 Outdoor Vacation Market Size & Forecast, By Traveler Type, 2021 – 2032
9.2.6.1.2 Outdoor Vacation Market Size & Forecast, By Age Group, 2021 – 2032
9.2.6.1.3 Outdoor Vacation Market Size & Forecast, By Mode of Booking, 2021 – 2032
9.2.6.1.4 Outdoor Vacation Market Size & Forecast, By Tour Type, 2021 – 2032
9.2.6.2 Canada
9.2.6.2.1 Outdoor Vacation Market Size & Forecast, By Traveler Type, 2021 – 2032
9.2.6.2.2 Outdoor Vacation Market Size & Forecast, By Age Group, 2021 – 2032
9.2.6.2.3 Outdoor Vacation Market Size & Forecast, By Mode of Booking, 2021 – 2032
9.2.6.2.4 Outdoor Vacation Market Size & Forecast, By Tour Type, 2021 – 2032
9.3 Europe
9.3.1 Key Trends
9.3.2 Outdoor Vacation Market Size & Forecast, By Traveler Type, 2021 – 2032
9.3.3 Outdoor Vacation Market Size & Forecast, By Age Group, 2021 – 2032
9.3.4 Outdoor Vacation Market Size & Forecast, By Mode of Booking, 2021 – 2032
9.3.5 Outdoor Vacation Market Size & Forecast, By Tour Type, 2021 – 2032
9.3.6 Outdoor Vacation Market Size & Forecast, By Country, 2021 – 2032
9.3.6.1 Germany
9.3.6.1.1 Outdoor Vacation Market Size & Forecast, By Traveler Type, 2021 – 2032
9.3.6.1.2 Outdoor Vacation Market Size & Forecast, By Age Group, 2021 – 2032
9.3.6.1.3 Outdoor Vacation Market Size & Forecast, By Mode of Booking, 2021 – 2032
9.3.6.1.4 Outdoor Vacation Market Size & Forecast, By Tour Type, 2021 – 2032
9.3.6.2 UK
9.3.6.2.1 Outdoor Vacation Market Size & Forecast, By Traveler Type, 2021 – 2032
9.3.6.2.2 Outdoor Vacation Market Size & Forecast, By Age Group, 2021 – 2032
9.3.6.2.3 Outdoor Vacation Market Size & Forecast, By Mode of Booking, 2021 – 2032
9.3.6.2.4 Outdoor Vacation Market Size & Forecast, By Tour Type, 2021 – 2032
9.3.6.3 France
9.3.6.3.1 Outdoor Vacation Market Size & Forecast, By Traveler Type, 2021 – 2032
9.3.6.3.2 Outdoor Vacation Market Size & Forecast, By Age Group, 2021 – 2032
9.3.6.3.3 Outdoor Vacation Market Size & Forecast, By Mode of Booking, 2021 – 2032
9.3.6.3.4 Outdoor Vacation Market Size & Forecast, By Tour Type, 2021 – 2032
9.3.6.4 Italy
9.3.6.4.1 Outdoor Vacation Market Size & Forecast, By Traveler Type, 2021 – 2032
9.3.6.4.2 Outdoor Vacation Market Size & Forecast, By Age Group, 2021 – 2032
9.3.6.4.3 Outdoor Vacation Market Size & Forecast, By Mode of Booking, 2021 – 2032
9.3.6.4.4 Outdoor Vacation Market Size & Forecast, By Tour Type, 2021 – 2032
9.3.6.5 Spain
9.3.6.5.1 Outdoor Vacation Market Size & Forecast, By Traveler Type, 2021 – 2032
9.3.6.5.2 Outdoor Vacation Market Size & Forecast, By Age Group, 2021 – 2032
9.3.6.5.3 Outdoor Vacation Market Size & Forecast, By Mode of Booking, 2021 – 2032
9.3.6.5.4 Outdoor Vacation Market Size & Forecast, By Tour Type, 2021 – 2032
9.3.6.6 Russia
9.3.6.6.1 Outdoor Vacation Market Size & Forecast, By Traveler Type, 2021 – 2032
9.3.6.6.2 Outdoor Vacation Market Size & Forecast, By Age Group, 2021 – 2032
9.3.6.6.3 Outdoor Vacation Market Size & Forecast, By Mode of Booking, 2021 – 2032
9.3.6.6.4 Outdoor Vacation Market Size & Forecast, By Tour Type, 2021 – 2032
9.3.6.7 Poland
9.3.6.7.1 Outdoor Vacation Market Size & Forecast, By Traveler Type, 2021 – 2032
9.3.6.7.2 Outdoor Vacation Market Size & Forecast, By Age Group, 2021 – 2032
9.3.6.7.3 Outdoor Vacation Market Size & Forecast, By Mode of Booking, 2021 – 2032
9.3.6.7.4 Outdoor Vacation Market Size & Forecast, By Tour Type, 2021 – 2032
9.3.6.8 Rest of Europe
9.3.6.8.1 Outdoor Vacation Market Size & Forecast, By Traveler Type, 2021 – 2032
9.3.6.8.2 Outdoor Vacation Market Size & Forecast, By Age Group, 2021 – 2032
9.3.6.8.3 Outdoor Vacation Market Size & Forecast, By Mode of Booking, 2021 – 2032
9.3.6.8.4 Outdoor Vacation Market Size & Forecast, By Tour Type, 2021 – 2032
9.4 Asia-Pacific
9.4.1 Key Trends
9.4.2 Outdoor Vacation Market Size & Forecast, By Traveler Type, 2021 – 2032
9.4.3 Outdoor Vacation Market Size & Forecast, By Age Group, 2021 – 2032
9.4.4 Outdoor Vacation Market Size & Forecast, By Mode of Booking, 2021 – 2032
9.4.5 Outdoor Vacation Market Size & Forecast, By Tour Type, 2021 – 2032
9.4.6 Outdoor Vacation Market Size & Forecast, By Country, 2021 – 2032
9.4.6.1 China
9.4.6.1.1 Outdoor Vacation Market Size & Forecast, By Traveler Type, 2021 – 2032
9.4.6.1.2 Outdoor Vacation Market Size & Forecast, By Age Group, 2021 – 2032
9.4.6.1.3 Outdoor Vacation Market Size & Forecast, By Mode of Booking, 2021 – 2032
9.4.6.1.4 Outdoor Vacation Market Size & Forecast, By Tour Type, 2021 – 2032
9.4.6.2 India
9.4.6.2.1 Outdoor Vacation Market Size & Forecast, By Traveler Type, 2021 – 2032
9.4.6.2.2 Outdoor Vacation Market Size & Forecast, By Age Group, 2021 – 2032
9.4.6.2.3 Outdoor Vacation Market Size & Forecast, By Mode of Booking, 2021 – 2032
9.4.6.2.4 Outdoor Vacation Market Size & Forecast, By Tour Type, 2021 – 2032
9.4.6.3 Japan
9.4.6.3.1 Outdoor Vacation Market Size & Forecast, By Traveler Type, 2021 – 2032
9.4.6.3.2 Outdoor Vacation Market Size & Forecast, By Age Group, 2021 – 2032
9.4.6.3.3 Outdoor Vacation Market Size & Forecast, By Mode of Booking, 2021 – 2032
9.4.6.3.4 Outdoor Vacation Market Size & Forecast, By Tour Type, 2021 – 2032
9.4.6.4 South Korea
9.4.6.4.1 Outdoor Vacation Market Size & Forecast, By Traveler Type, 2021 – 2032
9.4.6.4.2 Outdoor Vacation Market Size & Forecast, By Age Group, 2021 – 2032
9.4.6.4.3 Outdoor Vacation Market Size & Forecast, By Mode of Booking, 2021 – 2032
9.4.6.4.4 Outdoor Vacation Market Size & Forecast, By Tour Type, 2021 – 2032
9.4.6.5 Australia
9.4.6.5.1 Outdoor Vacation Market Size & Forecast, By Traveler Type, 2021 – 2032
9.4.6.5.2 Outdoor Vacation Market Size & Forecast, By Age Group, 2021 – 2032
9.4.6.5.3 Outdoor Vacation Market Size & Forecast, By Mode of Booking, 2021 – 2032
9.4.6.5.4 Outdoor Vacation Market Size & Forecast, By Tour Type, 2021 – 2032
9.4.6.6 ASEAN Countries
9.4.6.6.1 Outdoor Vacation Market Size & Forecast, By Traveler Type, 2021 – 2032
9.4.6.6.2 Outdoor Vacation Market Size & Forecast, By Age Group, 2021 – 2032
9.4.6.6.3 Outdoor Vacation Market Size & Forecast, By Mode of Booking, 2021 – 2032
9.4.6.6.4 Outdoor Vacation Market Size & Forecast, By Tour Type, 2021 – 2032
9.4.6.7 Rest of Asia-Pacific
9.4.6.7.1 Outdoor Vacation Market Size & Forecast, By Traveler Type, 2021 – 2032
9.4.6.7.2 Outdoor Vacation Market Size & Forecast, By Age Group, 2021 – 2032
9.4.6.7.3 Outdoor Vacation Market Size & Forecast, By Mode of Booking, 2021 – 2032
9.4.6.7.4 Outdoor Vacation Market Size & Forecast, By Tour Type, 2021 – 2032
9.5 Latin America
9.5.1 Key Trends
9.5.2 Outdoor Vacation Market Size & Forecast, By Traveler Type, 2021 – 2032
9.5.3 Outdoor Vacation Market Size & Forecast, By Age Group, 2021 – 2032
9.5.4 Outdoor Vacation Market Size & Forecast, By Mode of Booking, 2021 – 2032
9.5.5 Outdoor Vacation Market Size & Forecast, By Tour Type, 2021 – 2032
9.5.6 Outdoor Vacation Market Size & Forecast, By Country, 2021 – 2032
9.5.6.1 Brazil
9.5.6.1.1 Outdoor Vacation Market Size & Forecast, By Traveler Type, 2021 – 2032
9.5.6.1.2 Outdoor Vacation Market Size & Forecast, By Age Group, 2021 – 2032
9.5.6.1.3 Outdoor Vacation Market Size & Forecast, By Mode of Booking, 2021 – 2032
9.5.6.1.4 Outdoor Vacation Market Size & Forecast, By Tour Type, 2021 – 2032
9.5.6.2 Argentina
9.5.6.2.1 Outdoor Vacation Market Size & Forecast, By Traveler Type, 2021 – 2032
9.5.6.2.2 Outdoor Vacation Market Size & Forecast, By Age Group, 2021 – 2032
9.5.6.2.3 Outdoor Vacation Market Size & Forecast, By Mode of Booking, 2021 – 2032
9.5.6.2.4 Outdoor Vacation Market Size & Forecast, By Tour Type, 2021 – 2032
9.5.6.3 Mexico
9.5.6.3.1 Outdoor Vacation Market Size & Forecast, By Traveler Type, 2021 – 2032
9.5.6.3.2 Outdoor Vacation Market Size & Forecast, By Age Group, 2021 – 2032
9.5.6.3.3 Outdoor Vacation Market Size & Forecast, By Mode of Booking, 2021 – 2032
9.5.6.3.4 Outdoor Vacation Market Size & Forecast, By Tour Type, 2021 – 2032
9.5.6.4 Colombia
9.5.6.4.1 Outdoor Vacation Market Size & Forecast, By Traveler Type, 2021 – 2032
9.5.6.4.2 Outdoor Vacation Market Size & Forecast, By Age Group, 2021 – 2032
9.5.6.4.3 Outdoor Vacation Market Size & Forecast, By Mode of Booking, 2021 – 2032
9.5.6.4.4 Outdoor Vacation Market Size & Forecast, By Tour Type, 2021 – 2032
9.5.6.5 Rest of Latin America
9.5.6.5.1 Outdoor Vacation Market Size & Forecast, By Traveler Type, 2021 – 2032
9.5.6.5.2 Outdoor Vacation Market Size & Forecast, By Age Group, 2021 – 2032
9.5.6.5.3 Outdoor Vacation Market Size & Forecast, By Mode of Booking, 2021 – 2032
9.5.6.5.4 Outdoor Vacation Market Size & Forecast, By Tour Type, 2021 – 2032
9.6 Middle East & Africa
9.6.1 Key Trends
9.6.2 Outdoor Vacation Market Size & Forecast, By Traveler Type, 2021 – 2032
9.6.3 Outdoor Vacation Market Size & Forecast, By Age Group, 2021 – 2032
9.6.4 Outdoor Vacation Market Size & Forecast, By Mode of Booking, 2021 – 2032
9.6.5 Outdoor Vacation Market Size & Forecast, By Tour Type, 2021 – 2032
9.6.6 Outdoor Vacation Market Size & Forecast, By Country, 2021 – 2032
9.6.6.1 UAE
9.6.6.1.1 Outdoor Vacation Market Size & Forecast, By Traveler Type, 2021 – 2032
9.6.6.1.2 Outdoor Vacation Market Size & Forecast, By Age Group, 2021 – 2032
9.6.6.1.3 Outdoor Vacation Market Size & Forecast, By Mode of Booking, 2021 – 2032
9.6.6.1.4 Outdoor Vacation Market Size & Forecast, By Tour Type, 2021 – 2032
9.6.6.2 Saudi Arabia
9.6.6.2.1 Outdoor Vacation Market Size & Forecast, By Traveler Type, 2021 – 2032
9.6.6.2.2 Outdoor Vacation Market Size & Forecast, By Age Group, 2021 – 2032
9.6.6.2.3 Outdoor Vacation Market Size & Forecast, By Mode of Booking, 2021 – 2032
9.6.6.2.4 Outdoor Vacation Market Size & Forecast, By Tour Type, 2021 – 2032
9.6.6.3 Qatar
9.6.6.3.1 Outdoor Vacation Market Size & Forecast, By Traveler Type, 2021 – 2032
9.6.6.3.2 Outdoor Vacation Market Size & Forecast, By Age Group, 2021 – 2032
9.6.6.3.3 Outdoor Vacation Market Size & Forecast, By Mode of Booking, 2021 – 2032
9.6.6.3.4 Outdoor Vacation Market Size & Forecast, By Tour Type, 2021 – 2032
9.6.6.4 Egypt
9.6.6.4.1 Outdoor Vacation Market Size & Forecast, By Traveler Type, 2021 – 2032
9.6.6.4.2 Outdoor Vacation Market Size & Forecast, By Age Group, 2021 – 2032
9.6.6.4.3 Outdoor Vacation Market Size & Forecast, By Mode of Booking, 2021 – 2032
9.6.6.4.4 Outdoor Vacation Market Size & Forecast, By Tour Type, 2021 – 2032
9.6.6.5 South Africa
9.6.6.5.1 Outdoor Vacation Market Size & Forecast, By Traveler Type, 2021 – 2032
9.6.6.5.2 Outdoor Vacation Market Size & Forecast, By Age Group, 2021 – 2032
9.6.6.5.3 Outdoor Vacation Market Size & Forecast, By Mode of Booking, 2021 – 2032
9.6.6.5.4 Outdoor Vacation Market Size & Forecast, By Tour Type, 2021 – 2032
9.6.6.6 Rest of Middle East & Africa
9.6.6.6.1 Outdoor Vacation Market Size & Forecast, By Traveler Type, 2021 – 2032
9.6.6.6.2 Outdoor Vacation Market Size & Forecast, By Age Group, 2021 – 2032
9.6.6.6.3 Outdoor Vacation Market Size & Forecast, By Mode of Booking, 2021 – 2032
9.6.6.6.4 Outdoor Vacation Market Size & Forecast, By Tour Type, 2021 – 2032
10. Competitive Landscape
10.1 Key Players' Positioning
10.2 Competitive Developments
10.2.1 Key Strategies Adopted (%), By Key Players, 2024
10.2.2 Year-Wise Strategies & Development, 2021 – 2025
10.2.3 Number Of Strategies Adopted By Key Players, 2024
10.3 Market Share Analysis, 2024
10.4 Product/Service & Application Benchmarking
10.4.1 Product/Service Specifications & Features By Key Players
10.4.2 Product/Service Heatmap By Key Players
10.4.3 Application Heatmap By Key Players
10.5 Industry Start-Up & Innovation Landscape
10.6 Key Company Profiles
10.6.1 Tauck, Inc.
10.6.1.1 Company Overview & Snapshot
10.6.1.2 Product/Service Portfolio
10.6.1.3 Key Company Financials
10.6.1.4 SWOT Analysis
10.6.2 TUI Group
10.6.2.1 Company Overview & Snapshot
10.6.2.2 Product/Service Portfolio
10.6.2.3 Key Company Financials
10.6.2.4 SWOT Analysis
10.6.3 JTB Americas, Ltd.
10.6.3.1 Company Overview & Snapshot
10.6.3.2 Product/Service Portfolio
10.6.3.3 Key Company Financials
10.6.3.4 SWOT Analysis
10.6.4 Scott Dunn Ltd.
10.6.4.1 Company Overview & Snapshot
10.6.4.2 Product/Service Portfolio
10.6.4.3 Key Company Financials
10.6.4.4 SWOT Analysis
10.6.5 Butterfield & Robinson
10.6.5.1 Company Overview & Snapshot
10.6.5.2 Product/Service Portfolio
10.6.5.3 Key Company Financials
10.6.5.4 SWOT Analysis
10.6.6 Travel Leaders Group
10.6.6.1 Company Overview & Snapshot
10.6.6.2 Product/Service Portfolio
10.6.6.3 Key Company Financials
10.6.6.4 SWOT Analysis
10.6.7 Travcoa Corporation
10.6.7.1 Company Overview & Snapshot
10.6.7.2 Product/Service Portfolio
10.6.7.3 Key Company Financials
10.6.7.4 SWOT Analysis
10.6.8 American Express Travel
10.6.8.1 Company Overview & Snapshot
10.6.8.2 Product/Service Portfolio
10.6.8.3 Key Company Financials
10.6.8.4 SWOT Analysis
10.6.9 Thomas Cook India Ltd.
10.6.9.1 Company Overview & Snapshot
10.6.9.2 Product/Service Portfolio
10.6.9.3 Key Company Financials
10.6.9.4 SWOT Analysis
10.6.10 Carlson Wagonlit Travel (CWT)
10.6.10.1 Company Overview & Snapshot
10.6.10.2 Product/Service Portfolio
10.6.10.3 Key Company Financials
10.6.10.4 SWOT Analysis
10.6.11 Cox and Kings Ltd.
10.6.11.1 Company Overview & Snapshot
10.6.11.2 Product/Service Portfolio
10.6.11.3 Key Company Financials
10.6.11.4 SWOT Analysis
10.6.12 Expedia Group
10.6.12.1 Company Overview & Snapshot
10.6.12.2 Product/Service Portfolio
10.6.12.3 Key Company Financials
10.6.12.4 SWOT Analysis
10.6.13 World Travel, Inc.
10.6.13.1 Company Overview & Snapshot
10.6.13.2 Product/Service Portfolio
10.6.13.3 Key Company Financials
10.6.13.4 SWOT Analysis
10.6.14 Abercrombie & Kent USA LLC
10.6.14.1 Company Overview & Snapshot
10.6.14.2 Product/Service Portfolio
10.6.14.3 Key Company Financials
10.6.14.4 SWOT Analysis
10.6.15 Kensington Tours
10.6.15.1 Company Overview & Snapshot
10.6.15.2 Product/Service Portfolio
10.6.15.3 Key Company Financials
10.6.15.4 SWOT Analysis
10.6.16 Priceline (Booking Holdings Inc.)
10.6.16.1 Company Overview & Snapshot
10.6.16.2 Product/Service Portfolio
10.6.16.3 Key Company Financials
10.6.16.4 SWOT Analysis
10.6.17 Micato Safaris
10.6.17.1 Company Overview & Snapshot
10.6.17.2 Product/Service Portfolio
10.6.17.3 Key Company Financials
10.6.17.4 SWOT Analysis
10.6.18 G Adventures
10.6.18.1 Company Overview & Snapshot
10.6.18.2 Product/Service Portfolio
10.6.18.3 Key Company Financials
10.6.18.4 SWOT Analysis
10.6.19 Intrepid Travel
10.6.19.1 Company Overview & Snapshot
10.6.19.2 Product/Service Portfolio
10.6.19.3 Key Company Financials
10.6.19.4 SWOT Analysis
10.6.20 REI Adventures (REI Co-op)
10.6.20.1 Company Overview & Snapshot
10.6.20.2 Product/Service Portfolio
10.6.20.3 Key Company Financials
10.6.20.4 SWOT Analysis
11. Analyst Recommendations
11.1 SNS Insider Opportunity Map
11.2 Industry Low-Hanging Fruit Assessment
11.3 Market Entry & Growth Strategy
11.4 Analyst Viewpoint & Suggestions On Market Growth
12. Assumptions
13. Disclaimer
14. Appendix
14.1 List Of Tables
14.2 List Of Figures
An accurate research report requires proper strategizing as well as implementation. There are multiple factors involved in the completion of good and accurate research report and selecting the best methodology to compete the research is the toughest part. Since the research reports we provide play a crucial role in any company’s decision-making process, therefore we at SNS Insider always believe that we should choose the best method which gives us results closer to reality. This allows us to reach at a stage wherein we can provide our clients best and accurate investment to output ratio.
Each report that we prepare takes a timeframe of 350-400 business hours for production. Starting from the selection of titles through a couple of in-depth brain storming session to the final QC process before uploading our titles on our website we dedicate around 350 working hours. The titles are selected based on their current market cap and the foreseen CAGR and growth.
The 5 steps process:
Step 1: Secondary Research:
Secondary Research or Desk Research is as the name suggests is a research process wherein, we collect data through the readily available information. In this process we use various paid and unpaid databases which our team has access to and gather data through the same. This includes examining of listed companies’ annual reports, Journals, SEC filling etc. Apart from this our team has access to various associations across the globe across different industries. Lastly, we have exchange relationships with various university as well as individual libraries.
Step 2: Primary Research
When we talk about primary research, it is a type of study in which the researchers collect relevant data samples directly, rather than relying on previously collected data. This type of research is focused on gaining content specific facts that can be sued to solve specific problems. Since the collected data is fresh and first hand therefore it makes the study more accurate and genuine.
We at SNS Insider have divided Primary Research into 2 parts.
Part 1 wherein we interview the KOLs of major players as well as the upcoming ones across various geographic regions. This allows us to have their view over the market scenario and acts as an important tool to come closer to the accurate market numbers. As many as 45 paid and unpaid primary interviews are taken from both the demand and supply side of the industry to make sure we land at an accurate judgement and analysis of the market.
This step involves the triangulation of data wherein our team analyses the interview transcripts, online survey responses and observation of on filed participants. The below mentioned chart should give a better understanding of the part 1 of the primary interview.
Part 2: In this part of primary research the data collected via secondary research and the part 1 of the primary research is validated with the interviews from individual consultants and subject matter experts.
Consultants are those set of people who have at least 12 years of experience and expertise within the industry whereas Subject Matter Experts are those with at least 15 years of experience behind their back within the same space. The data with the help of two main processes i.e., FGDs (Focused Group Discussions) and IDs (Individual Discussions). This gives us a 3rd party nonbiased primary view of the market scenario making it a more dependable one while collation of the data pointers.
Step 3: Data Bank Validation
Once all the information is collected via primary and secondary sources, we run that information for data validation. At our intelligence centre our research heads track a lot of information related to the market which includes the quarterly reports, the daily stock prices, and other relevant information. Our data bank server gets updated every fortnight and that is how the information which we collected using our primary and secondary information is revalidated in real time.
Step 4: QA/QC Process
After all the data collection and validation our team does a final level of quality check and quality assurance to get rid of any unwanted or undesired mistakes. This might include but not limited to getting rid of the any typos, duplication of numbers or missing of any important information. The people involved in this process include technical content writers, research heads and graphics people. Once this process is completed the title gets uploader on our platform for our clients to read it.
Step 5: Final QC/QA Process:
This is the last process and comes when the client has ordered the study. In this process a final QA/QC is done before the study is emailed to the client. Since we believe in giving our clients a good experience of our research studies, therefore, to make sure that we do not lack at our end in any way humanly possible we do a final round of quality check and then dispatch the study to the client.
Key Segments:
By Tour Type
Volunteering trips
Culinary Tour
Leisure Tour
Heritage trip
Others
Traveler Type
Couple
Family
Solo
Group
By Age Group
Generation Z
Millennial
Baby Boomers
By Mode of Booking
Travel Agent
OTA
Request for Segment Customization as per your Business Requirement: Segment Customization Request
Regional Coverage:
North America
US
Canada
Europe
Germany
France
UK
Italy
Spain
Poland
Russia
Rest of Europe
Asia Pacific
China
India
Japan
South Korea
Australia
ASEAN Countries
Rest of Asia Pacific
Middle East & Africa
UAE
Saudi Arabia
Qatar
South Africa
Rest of Middle East & Africa
Latin America
Brazil
Argentina
Mexico
Colombia
Rest of Latin America
Request for Country Level Research Report: Country Level Customization Request
Available Customization
With the given market data, SNS Insider offers customization as per the company’s specific needs. The following customization options are available for the report:
Detailed Volume Analysis
Criss-Cross segment analysis (e.g. Product X Application)
Competitive Product Benchmarking
Geographic Analysis
Additional countries in any of the regions
Customized Data Representation
Detailed analysis and profiling of additional market players