Enterprise Collaboration Market Key Insights:
To Get More Information on Enterprise Collaboration Market - Request Sample Report
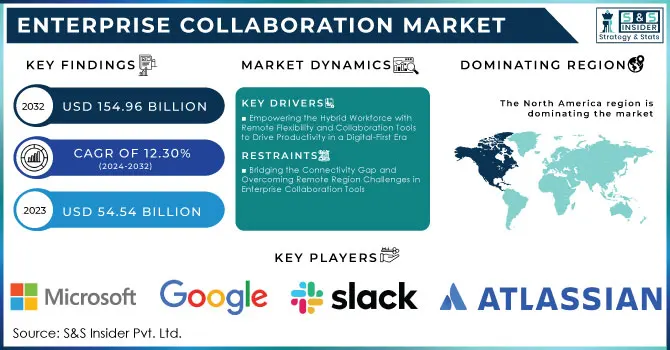
The Enterprise Collaboration Market size was valued at USD 54.54 Billion in 2023 and is estimated to reach over USD 154.96 Billion in 2032 with an increasing CAGR of 12.30% From 2024-2032.
The Enterprise Collaboration Market is experiencing substantial growth, fueled by the increasing adoption of cloud-based collaboration and the integration of emerging technologies like generative AI. As businesses continue to embrace remote and hybrid work models, the demand for cloud platforms that enable seamless collaboration has surged. A recent survey indicates a 44% rise in the use of collaboration among workers since, reflecting the shift towards digital workplaces. Major companies such as Cisco, Google, and Microsoft are enhancing their collaboration platforms to meet the growing demand for flexible work solutions. For example, Microsoft and Infosys recently expanded their partnership to accelerate the adoption of generative AI, aiming to improve collaboration and productivity in the workplace. In the cloud collaboration space, like Microsoft 365 and Google Workspace continue to lead, offering integrated solutions for document sharing, project management, and communication. Cisco WebEx and Slack are also key players, with Cisco unveiling AI-driven at WebexOne 2024 to improve employee collaboration and customer service experiences. Zoom, another prominent player, is expanding its features to include virtual meetings, chat, and cloud storage solutions, capitalizing on the growing need for remote communication. The market is also benefiting from the rise of hybrid cloud solutions, as highlighted by partnerships between companies like Dell Technologies and Nutanix, which aim to simplify cloud management for enterprises. The surge in cloud services usage is expected to continue, with AI-powered collaboration transforming workplaces across industries such as IT, healthcare, education, and finance. The market is poised for significant expansion, driven by AI-driven innovations and increased cloud adoption. Overall, the Enterprise Collaboration Market is on track for strong growth, with cloud adoption, AI integration, and remote work solutions playing a central role in shaping the future of collaboration.
Market Dynamics
Drivers
- Empowering the Hybrid Workforce with Remote Flexibility and Collaboration Tools to Drive Productivity in a Digital-First Era
Increased adoption of remote and hybrid work models, which has transformed how organizations operate and interact. According to recent reports, hybrid work setups are shown to enhance productivity and well-being, providing employees with the "best of both worlds" by allowing them to balance in-office and remote tasks. High-paying remote roles, for example, have surged as companies strive to offer competitive packages that appeal to skilled professionals while maintaining flexible work arrangements. In addition, companies like Wipro have responded to employee demand for flexible work arrangements by extending remote workdays, adding up to an extra 30 days per year of remote flexibility to their hybrid policy. Google, too, has implemented a flexible remote work policy aimed at supporting employees' work-life balance while ensuring efficient operations, underscoring the trend's traction among tech giants. As hybrid models continue to reshape traditional work environments, employers increasingly turn to enterprise collaboration to support seamless communication across distributed teams, reduce operational silos, and boost engagement, critical to counteracting productivity losses. For example, the flexibility offered by these has helped address challenges in sectors like nursing, where hybrid models have shown to help mitigate burnout. Moreover, studies reveal that employee disengagement and low productivity in rigid work structures can cost the economy nearly USD 2 trillion annually. Thus, as the need for adaptable work environments grows, so does the demand for collaboration that cater to diverse and geographically dispersed teams, enabling companies to thrive in a digital-first workplace where hybrid and remote work policies are increasingly the norm.
Restraints
- Bridging the Connectivity Gap and Overcoming Remote Region Challenges in Enterprise Collaboration
As enterprises increasingly adopt collaboration to facilitate remote and hybrid work, the issue of limited internet accessibility in rural and underdeveloped regions becomes a significant barrier. Organizations with geographically dispersed teams face connectivity challenges that can hinder the reliability of these, ultimately affecting seamless communication and productivity. In regions with inadequate internet infrastructure, workers may experience frequent disruptions, slow speeds, or complete outages, which compromise the effectiveness of cloud-based platforms and real-time collaboration features. This issue is particularly prominent in countries with vast rural areas or developing regions, where internet penetration is still growing. For instance, India’s efforts to deploy over 50,000 4G sites in remote regions aim to address connectivity challenges, yet the process remains ongoing, and full coverage is not yet achieved. Similarly, hyperscalers across continents are working towards better collaboration and reliable internet access, but progress is slow, with collaboration still needed to bridge the gap. These limitations not only affect employee engagement and communication but also increase operational risks and inefficiencies. The high reliance on the internet for running enterprise collaboration means that without robust and stable connections, businesses cannot fully leverage the potential of these platforms. Moreover, while global efforts like partnerships between Oracle and Vodafone aim to enhance global IoT connectivity, challenges remain in remote regions that require significant investment to ensure widespread and consistent access. In summary, limited internet access in remote and underdeveloped areas is a critical restraint in the enterprise collaboration market, slowing the adoption and effectiveness of collaboration in such regions.
Segment Analysis
By Type
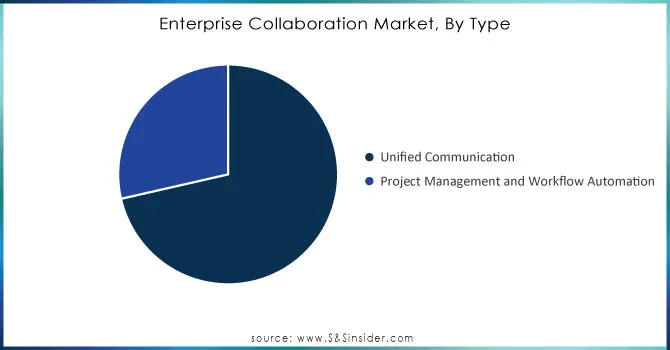
In 2023, the Project Management and Workflow Automation segment captured 72% of the enterprise collaboration market, driven by the growing need for that streamline task management, enhance collaboration, and boost efficiency. Project management are crucial for organizing tasks, tracking timelines, and ensuring team alignment, especially in remote and hybrid environments. Workflow automation eliminates repetitive tasks, reducing errors and improving efficiency across various industries. With digital transformation and remote work models on the rise, these are essential for maintaining productivity. As AI and technology evolve, this segment is expected to continue leading the market in the coming years.
Do You Need any Customization Research on Enterprise Collaboration Market - Inquire Now
By Deployment
In 2023, the On-premise deployment segment captured 54% of the enterprise collaboration market share, highlighting its dominance. On-premise solutions offer organizations greater control over their data and security, making them a preferred choice for industries with strict compliance regulations, such as healthcare, finance, and government. These solutions allow companies to manage their infrastructure internally, ensuring privacy and minimizing external risks. Additionally, on premise deployments provide customization options to meet the specific needs of large organizations, especially those with complex IT environments. While cloud-based solutions are growing in popularity, on premise solutions remain critical for businesses that prioritize security, control, and compliance. As the demand for data privacy and regulatory adherence continues to rise, the on premise segment is expected to maintain its significant share in the enterprise collaboration market.
Regional Analysis
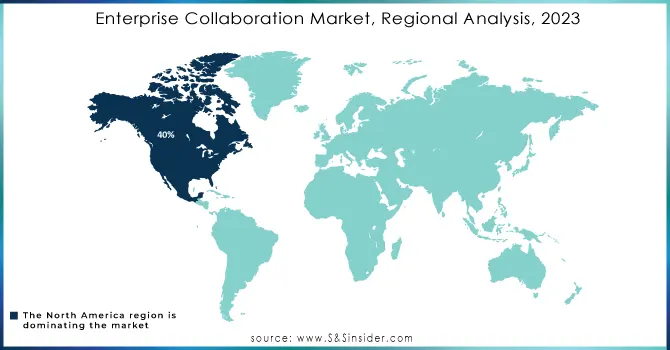
In 2023, North America led the enterprise collaboration market with a 40% share, driven by the presence of major tech companies, robust infrastructure, and high digital transformation adoption across industries. The region’s emphasis on remote and hybrid work, particularly in IT, finance, and healthcare, fueled demand for collaboration solutions. The U.S., as a hub for innovation, houses key players like Microsoft, Slack, and Cisco, further boosting the market. With growing AI integration and investments in automation and security, North America’s market dominance is set to continue, driven by the increasing need for seamless communication and workflow management.
In 2023, Asia-Pacific was the fastest-growing region in the enterprise collaboration market, driven by digital transformation, the rise of remote and hybrid work models, and a booming tech ecosystem. Countries such as China, India, Japan, and South Korea are seeing increased demand for collaboration solutions across sectors like IT, manufacturing, and healthcare. The region’s industrial growth, expanding SMEs, and heavy investments in cloud infrastructure and AI technologies are boosting market demand. Additionally, higher internet penetration and mobile usage in emerging economies are enhancing cross-border collaboration, positioning Asia-Pacific for sustained growth in the enterprise collaboration market.
Key Players
Some of the major product in Enterprise Collaboration market with product:
-
Microsoft (Microsoft Teams, Microsoft 365, OneDrive, SharePoint)
-
Slack Technologies (Salesforce) (Slack, Slack Connect, Slack Huddles)
-
Google (Google Workspace, Google Meet, Google Drive, Google Docs)
-
Cisco Systems (Cisco WebEx, Cisco WebEx Teams, Cisco Jabber)
-
Zoom Video Communications (Zoom Meetings, Zoom Chat, Zoom Rooms, Zoom Webinar)
-
Atlassian (Jira Software, Confluence, Trello, Bitbucket)
-
Workplace from Facebook (Meta) (Workplace by Facebook, Workplace Chat, Workplace Live)
-
Monday.com (Monday Work OS, Monday Projects, Monday Marketing)
-
RingCentral (RingCentral Video, RingCentral Office, RingCentral MVP)
-
Dropbox (Dropbox Business, Dropbox Paper, Dropbox Smart Sync)
-
Zoho Corporation (Zoho Workplace, Zoho Projects, Zoho Cliq)
-
Trello (Atlassian) (Trello, Trello Power-Ups)
-
Basecamp (Basecamp 3, Basecamp Projects, Basecamp To-do Lists)
-
Asana (Asana Project Management, Asana Goals, Asana Workflow Automation)
-
Veeva Systems (Veeva Vault QMS, Veeva CRM, Veeva Collaboration)
-
Miro (Miro Online Whiteboard, Miro Enterprise, Miro Templates)
-
Smartsheet (Smartsheet Platform, Smartsheet for IT, Smartsheet for Marketing)
-
Box (Box Cloud Storage, Box Notes, Box Relay, Box Governance)
-
Salesforce (Salesforce Chatter, Salesforce Collaboration Cloud, Salesforce Quip)
-
Flock (Flock Messaging, Flock Video Calls, Flock Apps Integration)
List of potential customers in the Enterprise Collaboration Market, which includes companies across various industries that are likely to adopt or already use collaboration to improve productivity, communication, and teamwork within their organizations:
1. Large Enterprises (Multinational Corporations)
Examples:
Amazon (E-commerce, Cloud Computing)
Microsoft (Software, Technology)
Apple (Technology, Consumer Electronics)
Google (Alphabet) (Technology, Internet Services)
IBM (Technology, Consulting)
2. Technology Companies
Examples:
Salesforce (Cloud Computing, Customer Relationship Management)
Adobe (Software, Creative Tools)
Oracle (Cloud Services, Enterprise Software)
Intel (Semiconductors, Technology)
3. Financial Institutions
Examples:
HSBC (Banking)
JPMorgan Chase (Banking, Financial Services)
Goldman Sachs (Investment Banking)
Barclays (Banking, Financial Services)
4. Retail Chains
Examples:
Walmart (Retail, E-commerce)
Target (Retail)
Best Buy (Consumer Electronics, Retail)
Costco (Wholesale, Retail)
5. Healthcare Providers
Examples:
Mayo Clinic (Healthcare Services)
Cigna (Insurance, Healthcare Services)
Medtronic (Medical Devices, Healthcare)
Kaiser Permanente (Healthcare Services)
6. Manufacturing Companies
Examples:
General Electric (GE) (Diversified Manufacturing, Technology)
Toyota (Automotive Manufacturing)
Siemens (Industrial Manufacturing, Technology)
Caterpillar (Construction Equipment Manufacturing)
7. Educational Institutions
Examples:
Harvard University (Education)
Stanford University (Education)
University of California System (Higher Education)
Coursera (Online Education, Training)
8. Telecommunications Companies
Examples:
AT&T (Telecommunications)
Verizon (Telecommunications)
T-Mobile (Telecommunications)
Vodafone (Telecommunications)
9. Government and Public Sector Organizations
Examples:
U.S. Federal Government (Various agencies, Administration)
United Nations (International Organization)
European Commission (Governance and Public Services)
Local Government Bodies (Various Public Services)
10. Consulting and Professional Services Firms
Examples:
Accenture (Consulting, Professional Services)
Deloitte (Consulting, Auditing)
PwC (PricewaterhouseCoopers) (Consulting, Auditing)
McKinsey & Company (Management Consulting)
11. Legal Firms
Examples:
Baker McKenzie (Law Firm)
Clifford Chance (Law Firm)
Latham & Watkins (Law Firm)
Kirkland & Ellis (Law Firm)
12. Energy Companies
Examples:
ExxonMobil (Oil & Gas)
Shell (Energy, Oil & Gas)
Chevron (Energy, Oil & Gas)
BP (Energy, Oil & Gas)
13. Transportation and Logistics Companies
Examples:
UPS (Logistics, Delivery Services)
FedEx (Logistics, Delivery Services)
DHL (Logistics)
Delta Air Lines (Airline)
14. Media and Entertainment Companies
Examples:
Disney (Media, Entertainment)
Warner Bros. Discovery (Media, Entertainment)
NBC Universal (Media, Entertainment)
Netflix (Streaming Service)
15. Startups
Examples:
Stripe (Fintech, Payment Solutions)
Dropbox (Cloud Storage, Collaboration Tools)
Zoom Video Communications (Video Conferencing)
Slack Technologies (Collaboration Tools)
Recent Development
-
In March 2024, Zoom Video Communications partnered with Avaya to deliver a streamlined management experience for communication environments and workflows using the Zoom Workplace solution.
-
In April 2023, Google Cloud introduced an AI-powered platform for prior authorization and claims processing, featuring a new data and analytics tool. This innovative solution is designed to transform unstructured data into structured data, assisting payers in complying with current and upcoming CMS regulations on interoperability and prior authorization, including the use of HL7 FHIR standards.
| Report Attributes | Details |
|---|---|
| Market Size in 2023 | USD 54.54 Billion |
| Market Size by 2032 | USD 154.96 Billion |
| CAGR | CAGR of 12.30% From 2024 to 2032 |
| Base Year | 2023 |
| Forecast Period | 2024-2032 |
| Historical Data | 2020-2022 |
| Report Scope & Coverage | Market Size, Segments Analysis, Competitive Landscape, Regional Analysis, DROC & SWOT Analysis, Forecast Outlook |
| Key Segments | • By Type (Unified Communication and Project Management and Workflow Automation) • By Deployment (On-premises and Cloud) • By Enterprise Type (Small & Medium Enterprises and Large Enterprises) • By Industry (BFSI, Manufacturing, Retail & Consumer Goods, Education, IT & Telecommunication, Energy & Utilities, Public Sector, Healthcare, and Others) |
| Regional Analysis/Coverage | North America (US, Canada, Mexico), Europe (Eastern Europe [Poland, Romania, Hungary, Turkey, Rest of Eastern Europe] Western Europe] Germany, France, UK, Italy, Spain, Netherlands, Switzerland, Austria, Rest of Western Europe]), Asia-Pacific (China, India, Japan, South Korea, Vietnam, Singapore, Australia, Rest of Asia-Pacific), Middle East & Africa (Middle East [UAE, Egypt, Saudi Arabia, Qatar, Rest of Middle East], Africa [Nigeria, South Africa, Rest of Africa], Latin America (Brazil, Argentina, Colombia, Rest of Latin America) |
| Company Profiles | Microsoft, Slack Technologies, Google, Cisco Systems, Zoom Video Communications, Atlassian, Workplace from Facebook, Monday.com, RingCentral, Dropbox, Zoho Corporation, Trello, Basecamp, Asana, Veeva Systems, Miro, Smartsheet, Box, Salesforce, and Flock are key players in the enterprise collaboration market, offering a range of communication, project management, and collaboration solutions. |
| Key Drivers | • Empowering the Hybrid Workforce with Remote Flexibility and Collaboration Tools to Drive Productivity in a Digital-First Era |
| RESTRAINTS | • Bridging the Connectivity Gap and Overcoming Remote Region Challenges in Enterprise Collaboration Tools |
Frequently Asked Questions
Ans: Project Management and Workflow Automation Segment is dominating in Enterprise Collaboration Market in 2023.
Ans: North America is the dominating region in Enterprise Collaboration Market in 2023.
Ans: Driving the demand for advanced communication and collaboration tools to effectively manage distributed teams.
Ans: The CAGR of the Enterprise Collaboration Market for the forecast period 2024-2032 is 12.30%.
Ans: The market is expected to grow to USD 154.96 billion by the forecast period of 2032.
Get in Touch
