P2P Payment Market Report Scope & Overview:
Get more information on P2P Payment Market - Request Sample Report
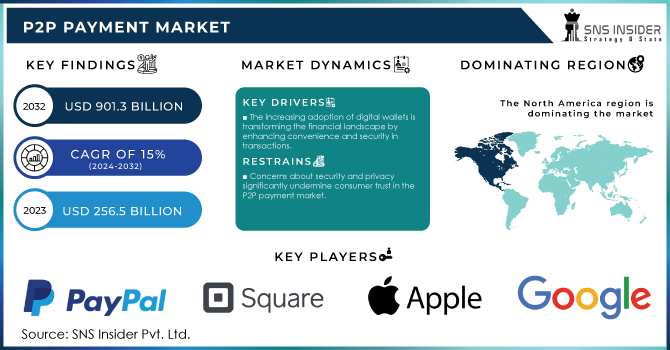
The P2P Payment Market Size was USD 256.5 Billion in 2023 and is expected to reach USD 901.3 billion by 2032 and grow at a CAGR of 15% over the forecast period of 2024-2032.
The P2P payment market is experiencing significant expansion, driven by factors such as the widespread adoption of smartphones, increased internet penetration, and a growing preference for cashless transactions among consumers. Technological advancements, including block chain and artificial intelligence, are shaping the P2P payment landscape by enhancing security, streamlining transactions, and improving user experiences. As a result, consumers are increasingly inclined to use P2P payment apps for personal transactions, paying bills, and making purchases from small retailers. Moreover, the integration of new features, such as the recently launched "Tap to Cash" by Apple, demonstrates the industry's focus on innovation to retain and attract users. However, the P2P payment market also faces challenges, including security concerns and a lack of transparency in reimbursement policies, particularly concerning scams. Regulatory bodies are stepping up to address these issues, aiming to create a safer environment for users. Overall, the future of the P2P payment market looks promising, with continued growth driven by evolving consumer preferences and technological advancements. As competition intensifies, P2P payment providers must focus on enhancing their offerings and addressing user concerns to remain relevant in this rapidly changing landscape.
Consumer digital payments have become mainstream, with P2P payment systems gaining substantial traction. The U.S. mobile P2P payments market has shown impressive growth, with transaction values reaching USD 1,261.53 billion in 2023 and projected to increase to approximately USD 1,375.93 billion in 2024. This shift towards P2P payments has prompted many consumers to seek safer and more efficient ways to conduct financial transactions. Younger consumers are more inclined to adopt digital payment methods, preferring the instant transaction capabilities offered by platforms like Venmo, Cash App, and Zelle. Furthermore, the seamless integration of P2P payment services into social media and e-commerce platforms has enhanced accessibility and appeal among users. However, challenges remain, including concerns over security, transaction fees, and regulatory scrutiny. Despite these challenges, the potential for technological innovations, such as block chain and decentralized finance, provides exciting opportunities for the market. Overall, as consumer preferences continue to evolve, the P2P payment market is positioned for sustained growth, solidifying its importance in the broader financial services landscape.
P2P Payment Market Dynamics
Drivers
-
The increasing adoption of digital wallets is transforming the financial landscape by enhancing convenience and security in transactions.
Digital wallets provide users with a convenient way to store multiple payment methods in one platform, facilitating seamless P2P transactions. The ease of use and enhanced security features have made these wallets increasingly popular among consumers. For instance, 54% of UK consumers have already embraced digital wallets, with a notable 43% expressing a preference for these platforms over traditional payment methods. This shift towards digital wallets is further propelled by the rapid growth of smartphone penetration and advancements in mobile technology. Approximately 70% of mobile users in the United States now utilize digital payment solutions, demonstrating a strong correlation between smartphone usage and the rise of digital wallets. As businesses adapt to this consumer trend, many have reported a 65% increase in sales after implementing digital wallet solutions, showcasing the positive impact on business revenues. Moreover, the integration of advanced technologies like biometric authentication and AI-driven fraud detection enhances consumer confidence in using digital wallets, resulting in greater market penetration. A survey indicated that 59% of businesses are either exploring or actively implementing digital wallet solutions as part of their payment strategies, emphasizing the growing recognition of digital wallets as a critical component in modern financial transactions. As digital wallets continue to gain traction, the P2P payment market is poised for significant growth. The increasing reliance on these platforms not only streamlines transactions for users but also contributes to the broader shift towards cashless economies, aligning with global trends in digital transformation and financial inclusion. This momentum positions the P2P payment market for robust expansion, driven by the ongoing popularity of digital wallets as a primary method for personal and business transactions.
Restraints
-
Concerns about security and privacy significantly undermine consumer trust in the P2P payment market.
Consumer trust issues significantly hinder the growth of the Peer-to-Peer (P2P) payment market, as many users remain skeptical about the security of digital wallets and payment apps. While P2P payment apps offer ease and convenience, they also pose potential financial and privacy risks, leading to heightened concerns among users. A recent report found that approximately 55% of consumers are worried about the security of their financial information when using digital wallets. Additionally, nearly 40% of users believe that P2P payment services are not as safe as traditional credit cards. The lack of transparency regarding potential scams further exacerbates these concerns, as many users have reported experiencing scams while using these services. As these platforms continue to evolve, addressing trust issues is critical for market growth. Providers must enhance security measures, improve transparency regarding risks, and educate consumers on safe usage practices to foster confidence in digital payment solutions. Building consumer trust is essential for increasing adoption rates and solidifying the future of P2P payment services.
P2P Payment Market Segmentation Overview
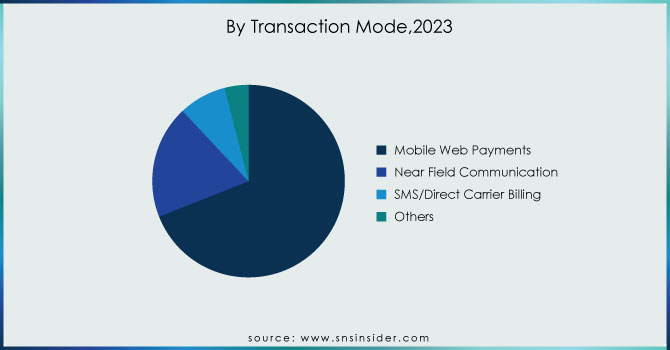
By Transaction Mode
In 2023, mobile web payments secured the largest revenue share in the transaction mode segment, accounting for approximately 69%. This significant market share reflects the increasing preference for mobile web payment solutions among both consumers and businesses. Several key factors contribute to this trend. First, the widespread use of smartphones has enabled consumers to easily conduct online transactions, enhancing access to mobile payment options. Additionally, mobile web payments offer unmatched convenience, allowing users to make transactions anytime and anywhere, which resonates with the fast-paced lifestyles of today’s consumers. User-friendly interfaces are also crucial; advancements in mobile web technology have resulted in intuitive designs that improve the overall user experience, making features like one-click payments and straightforward navigation more appealing. Furthermore, the integration of mobile web payment solutions with major e-commerce platforms has accelerated their adoption, as businesses increasingly optimize their websites for mobile transactions. Enhanced security features, including biometric authentication and encryption, have addressed previous security concerns, boosting consumer confidence and leading to increased usage of mobile web payments. Merchants also incentivize consumers by offering exclusive promotions and discounts for mobile transactions, further encouraging this payment method. As mobile web payments continue to dominate the transaction mode segment, businesses are likely to invest more in optimizing their payment systems. The combination of convenience, accessibility, and security will propel further growth in this segment, establishing it as a vital part of the overall P2P payment market.
By End User
In 2023, the personal end-user segment dominated the Peer-to-Peer (P2P) payment market, capturing around 75% of the revenue share. This significant market presence is driven by the growing adoption of P2P payment solutions among individual consumers, owing to several appealing factors. The ease of use of P2P payment apps, offering quick and simple transactions with features like instant money transfers and user-friendly interfaces, makes them highly attractive for daily use. The rise of digital communication and social media has also transformed how people share expenses, split bills, and transfer money, particularly among younger users. The shift toward a cashless society further fuels this trend, with mobile wallets and payment apps offering a convenient way to manage personal finances without physical cash. Integration with social media platforms has simplified transactions, encouraging more users to adopt these services. Enhanced security measures such as encryption, fraud detection, and identity verification have also boosted consumer confidence in P2P payment platforms. Additionally, promotional offers, discounts, and referral bonuses attract personal users, driving growth in this segment. As the P2P payment market expands, the personal end-user segment is expected to remain a dominant force due to its convenience, social integration, and security.
P2P Payment Market Regional Analysis
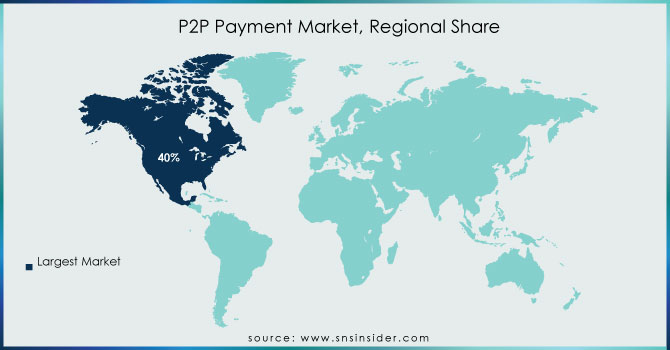
In 2023, North America captured approximately 40% of the global Peer-to-Peer (P2P) payment market, making it the largest regional player. This dominance is driven by several key factors. North America, particularly the United States and Canada, boasts advanced digital infrastructure, including widespread internet access, robust mobile networks, and high smartphone penetration, enabling seamless P2P payment transactions. The region has also seen a surge in mobile wallet usage, with consumers increasingly relying on apps like PayPal, Venmo, Zelle, and Cash App for daily financial transactions. The well-established financial ecosystem in North America, backed by strong banks and fintech companies, has integrated P2P payment solutions, providing users with fast and secure fund transfers. Additionally, a clear shift in consumer behavior toward digital and cashless payments, driven by the convenience and security of P2P platforms, has accelerated market growth. The demand for contactless payment solutions, especially post-pandemic, further strengthens this trend. North America benefits from a robust regulatory framework, ensuring consumer protection and instilling trust in digital payment systems. As a result, the region’s leadership in the P2P payment market is expected to continue, driven by growing adoption of cashless transactions and advanced digital solutions.
In 2023, Asia-Pacific became the fastest-growing region in the Peer-to-Peer (P2P) payment market, driven by rapid digital transformation, increased smartphone penetration, and the expansion of mobile payment platforms. Several factors have fueled this growth, making the region a hub for P2P payment innovation. The region's digital infrastructure has significantly improved, particularly in countries like China, India, and Southeast Asia. Better internet connectivity and mobile networks have enabled more consumers to access digital financial services, boosting the demand for P2P payments. Asia-Pacific also has one of the highest rates of smartphone adoption globally, providing a vast user base for mobile payments. As more consumers use smartphones for online transactions, P2P payments have become an increasingly popular and convenient way to transfer funds. Leading companies in the region are driving growth through product development. For example, Ant Group’s Alipay and Tencent’s WeChat Pay continue to dominate the Chinese market, while India’s Paytm has expanded its offerings to include P2P payments. In 2023, Grab in Southeast Asia enhanced its financial services by integrating P2P payment features. Additionally, government support and fintech development across the region have encouraged the adoption of digital payments, leading to rapid market expansion.
Need any customization research on P2P Payment Market - Enquiry Now
Key Players in P2P Payment Market
Some of the Major key Players in P2P Payment market who provide product:
-
PayPal Holdings Inc (PayPal, Venmo)
-
Square, Inc. (Cash App)
-
Zelle (Zelle)
-
Google (Google Pay)
-
Samsung (Samsung Pay)
-
Alipay (Ant Group)
-
WePay Inc (Tencent)
-
TransferWise (Wise)
-
Revolut (Revolut)
-
Venmo (PayPal)
-
Facebook (Facebook Pay)
-
Cash App (Square, Inc.)
-
Doku (Doku)
-
Skrill (Skrill)
-
Remitly (Remitly)
-
Payoneer (Payoneer)
-
CashSend (CashSend)
-
Dwolla (Dwolla)
-
WorldRemit (WorldRemit)
List of notable outsourcing suppliers and service providers in the Peer-to-Peer (P2P) payment market, specializing in various aspects such as payment processing, technology solutions, and financial services:
-
FIS
-
PayU
-
Adyen
-
Stripe
-
Worldpay
-
Payoneer
-
Braintree
-
Authorize.Net
-
BlueSnap
-
Alipay
-
WePay
-
Dwolla
-
Zalando Payments
-
Paya
-
NMI
-
Skrill
-
Rapyd
-
Klarna
-
TrueLayer
-
Plaid
Recent Development
-
On October 2, 2024, Consumer Reports highlighted a lack of transparency among popular P2P payment services like Zelle, Cash App, Apple Cash, and Venmo regarding reimbursement policies for scam victims. The advocacy group reviewed user agreements from 2022 and again this year, urging these companies to provide clearer information on their refund processes.
-
In the May 2024 report "Real-Time Payments Tracker® Series Report: P2P Payment Potential," it was noted that while P2P payments have surged in popularity for personal transactions and small purchases, there is an urgent need for financial institutions to enhance security measures to protect users from scams and fraud.
-
On June 17, 2024, Apple announced the launch of "Tap to Cash," a new P2P feature that enables iPhone users to transfer money by simply holding their phones together. This innovative feature aims to streamline the process of peer-to-peer payments among users.
-
In the May 28, 2024 report "US Mobile P2P Payments Forecast 2024," Tyler Van Dyke highlights that while P2P transaction value growth will significantly outpace user growth, Zelle remains the dominant player in the market.
| Report Attributes | Details |
|---|---|
| Market Size in 2023 | USD 256.5 Billion |
| Market Size by 2032 | USD 901.3 Billion |
| CAGR | CAGR of 15% From 2024 to 2032 |
| Base Year | 2023 |
| Forecast Period | 2024-2032 |
| Historical Data | 2020-2022 |
| Report Scope & Coverage | Market Size, Segments Analysis, Competitive Landscape, Regional Analysis, DROC & SWOT Analysis, Forecast Outlook |
| Key Segments | • By Transaction Mode (Mobile Web Payments, Near Field Communication, SMS/Direct Carrier Billing and Others) • By Payment Type (Remote and Proximity) • By End User (Personal and Business) • By Application (Media & Entertainment, Energy & Utilities, Healthcare, Retail and Hospitality & Transportation) |
| Regional Analysis/Coverage | North America (US, Canada, Mexico), Europe (Eastern Europe [Poland, Romania, Hungary, Turkey, Rest of Eastern Europe] Western Europe] Germany, France, UK, Italy, Spain, Netherlands, Switzerland, Austria, Rest of Western Europe]), Asia-Pacific (China, India, Japan, South Korea, Vietnam, Singapore, Australia, Rest of Asia-Pacific), Middle East & Africa (Middle East [UAE, Egypt, Saudi Arabia, Qatar, Rest of Middle East], Africa [Nigeria, South Africa, Rest of Africa], Latin America (Brazil, Argentina, Colombia, Rest of Latin America) |
| Company Profiles | PayPal, Square, Zelle, Google, Apple, Samsung, Ant Group, Tencent, Wise, Revolut, Facebook, Doku, Skrill, Remitly, Payoneer, CashSend, Dwolla, and WorldRemit. |
| Key Drivers | • The increasing adoption of digital wallets is transforming the financial landscape by enhancing convenience and security in transactions. |
| RESTRAINTS | • Concerns about security and privacy significantly undermine consumer trust in the P2P payment market. |
Frequently Asked Questions
Ans: Asia-Pacific region dominated the P2P Payment Market.
Ans: The key players of the P2P Payment Market are Alibaba.com, Apple Inc., Circle International Financial Limited, Google LLC, One97 Communications Limited (Paytm), PayPal Holdings Inc., Square, Inc., WePay Inc., Wise Payments Limited, and Zelle.
Ans: The Covid-19 pandemic impacted the P2P Payment Market significantly. The detailed analysis is included in the final report.
Ans: The market size of the P2P Payment Market is expected to reach USD 901.39 billion by 2032.
Ans: The growth rate of the P2P Payment Market is 15% over the forecast period 2024-2032.
Get in Touch
