Smart Space Market Size & Overview:
To Get More Information on Smart Space Market - Request Sample Report
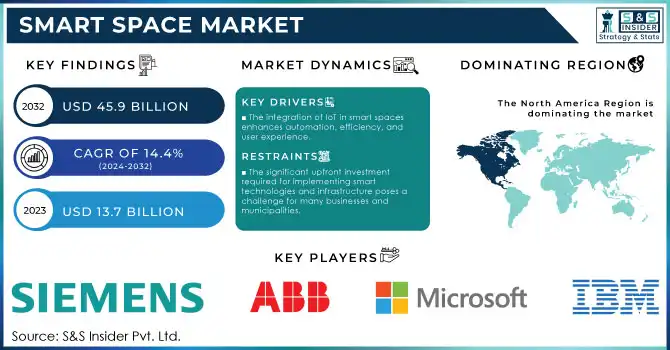
Smart Space Market size was valued at USD 13.7 billion in 2023 and is expected to grow to USD 45.9 billion by 2032 and grow at a CAGR of 14.4 % over the forecast period of 2024-2032.
The growth of the smart space market has been fuelled by the increased usage of smart technologies in urban development, infrastructure, and building management. Around the globe, governments are pushing to facilitate IoT use cases for public spaces connected with AI and data analytics for better energy efficiency, safety, and user experience. According to a 2023 report by the U.S. Department of Energy, smart buildings have the potential to reduce energy consumption by up to 30%, leading to significant cost savings and reducing carbon emissions. In 2023, the European Union contributed a total of USD 1.3 billion to smart city projects via its Horizon Europe program aimed at accelerating the deployment of smart solutions in cities. Similarly, in Asia-Pacific, China announced plans to invest USD 14 billion in smart city infrastructure by 2025, according to China's National Development and Reform Commission. These initiatives are backed by government support, in countries that have prioritized these focus areas or incorporated them into their environmental targets, and the global push for smart urbanization. This widespread investment, along with technological advancements, is expected to fuel the growth of the market over the forecast period.
The proliferation of smart devices, including smartphones and tablets, is building the necessary ecosystem for smart environments to provide greater control, monitoring, and automation over surroundings. The construction industry is adding smart technologies into new builds and retrofitting archaic buildings, optimizing systems such as lighting, heating, and security to create efficient automated solutions and save on costs. Investments worldwide in infrastructure to create smart cities and enhance urban living via end-to-end technologies. Advancements in data analytics offer insights into user behaviour and energy consumption, resulting in innovative smart space solutions. Consumer and business adoption is moving forward quickly thanks to greater awareness, education, and improved technology expansion tracking those trends directed by the health and safety concerns from the COVID-19 pandemic. When tech companies, construction firms, and governments collaborate, innovation happens along with standardization and interoperability. Moreover, smart spaces deliver economic benefits by lowering operational costs and enhancing resource management, appealing to those looking to optimize expenditures and maximize ROI.
Smart Space Market Dynamics
Drivers
-
The integration of Internet of Things (IoT) technologies in smart spaces facilitates automation and enhanced management of various systems, leading to improved operational efficiency and user experience.
-
With the rapid urbanization and increasing population in cities, there is a significant demand for smart spaces that optimize resource management and improve living conditions.
-
The rising concern for security in public and private spaces has led to the adoption of smart technologies that provide better surveillance and emergency management capabilities.
The rising number of connected devices and the adoption of IoT technologies are one of the most important driver for the smart space market. This Internet of Things (IoT) approach leverages the ability to communicate between connected devices, providing additional automation and management capabilities over numerous smart systems. IoT sensors in smart buildings, for instance, track energy usage as it happens and can reduce energy consumption by as much as 20%. It also reduces costs for operators of buildings and is aligned with sustainability efforts. The International Data Corporation (IDC) conducted a survey in which 76% of organizations stated their intention to increase investment in IoT solutions, showcasing the growing acknowledgment of the technology advantages.
Additionally, the integration of IoT with artificial intelligence (AI) has facilitated advanced analytics, helping organizations optimize operations and make data-driven decisions. For instance, smart lighting systems can automatically adjust based on occupancy and natural light levels, resulting in significant energy savings. An increasing number of cities around the world are adopting IoT for urban management. For instance, Barcelona has developed smart streetlights that dim when no one is nearby, enhancing energy efficiency and public safety. Such a trend outlines the importance of smart spaces affecting operational efficiency, sustainability, and user experience through IoT in turn fostering growth in the sector further over the projected timeline period.
Restraints
-
The significant upfront investment required for implementing smart technologies and infrastructure poses a challenge for many businesses and municipalities.
-
The integration of various technologies and systems in smart spaces can be complex and time-consuming, leading to potential delays and increased costs.
-
As smart spaces involve data collection and processing, concerns regarding data privacy and cybersecurity can hinder adoption.
The high infrastructure cost associated with smart space for implementing sophisticated technologies among them is one of the major restraints. These costs can deter potential adopters, particularly small to medium-sized enterprises (SMEs) and municipalities that may lack the necessary financial resources. Smart technology implementations such as sensors, IoT devices, and big data analytics platforms need real capital investment. Also, continuous maintenance and upgrades can create heavy pressure on budgets.
Moreover, the inconvenience of integrating such systems with existing infrastructure brings additional costs and resource upgradation. This hurdle of finance can restrict various stakeholders from embracing smart space solutions and eventually will hinder the rate of growth and innovation in this market.
Smart Space Market Segment analysis
By Component
In 2023, the solutions segment held a major share of the smart space market with over 72% of global revenue. This dominance is due to the rising need for integrated solutions that include hardware, software, and analytics to control and enhance building processes. Smart space solutions offer careful data relating to energy consumption, occupancy, lighting, and climate control while presenting real-time information that facility managers can use to make intelligent decisions based on quantitative values to increase efficiency and security. Government incentives, such as the LEED certification from the U.S. Green Building Council, motivated organizations to pursue smart solutions that help reduce energy consumption and support sustainable practices. In 2023, more than a third of all commercial buildings were LEED-certified in the U.S. and need smart solutions to help meet their energy efficiency goals. The strong emphasis on sustainability and cost-saving measures has made smart space solutions a priority for commercial and residential developers, further driving the market's growth.
By Application
In 2023, the security management segment emerged as the leader in the smart space market, driven by the rising requirement for advanced surveillance and security systems. The U.S. Department of Homeland Security, for instance, has reported a 25% increase in the use of smart surveillance systems to improve urban security and to act as a countermeasure against various public safety-related threats. Integrated with AI-powered facial recognition features, real-time threat detection, and remote monitoring systems, this sophisticated solution manifests itself through specialized security tools that help ensure better management of premises in residential as well as commercial spaces. Additionally, government regulations have enforced the use of smart security technologies in high-risk regions such as airports, government buildings, and critical infrastructure. As an example, the European Commission's directive for critical infrastructure protection in the year 2023 has mandated that industries in high-risk sectors such as transportation and energy install AI-embedded security solutions. The increasing threat of cyber and physical attacks has accelerated the move to smart security management under this regulatory framework.
Benefits of Smart Space Application on various industries
|
Application |
Industry |
Key Benefits of Smart Space Implementation |
|---|---|---|
|
Security Management |
Retail |
Real-time threat detection, improved loss prevention, and enhanced customer safety through AI-based surveillance systems. |
|
Energy Management |
Healthcare |
Optimized energy usage across hospital facilities, reducing operational costs while maintaining critical systems efficiency. |
|
Facility Management |
Finance |
Automated building operations, predictive maintenance, and space optimization for cost-effective and efficient workplace management. |
|
Emergency Management |
Manufacturing |
Enhanced safety protocols, rapid response systems for emergencies, and IoT-based hazard monitoring, reducing risks in factory environments. |
|
Workplace Management |
Education |
Integrated IoT tools for better space utilization, seamless classroom booking systems, and improved energy efficiency in campus facilities. |
By Premises Type
In 2023, the commercial segment generated the largest revenue share in the smart space market due to increasing commercialization & fast adoption of smart technology in office buildings, shopping malls, airports, and other commercial sector spaces. According to the General Services Administration, 60% of new commercial buildings in the U.S. incorporated smart space technologies for better energy efficiency, security, and building user experience. Furthermore, sustainable commercial real estate like the LEED and BREEAM standards have driven the trends of smart technologies. In 2023, smart commercial buildings accounted for 40% of the overall building stock in Europe, a key factor in the market's growth.
Regional Insights
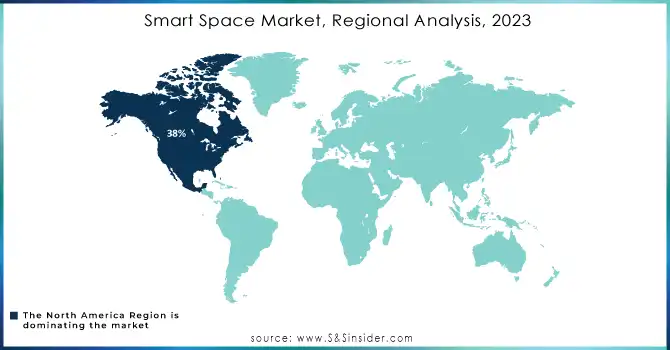
In 2023, the global smart space market was led by North America with a global share of about 38%. There has been a major growth driver in this region due to the U.S. government paying close attention to smart infrastructure and energy-efficient buildings. The U.S. Department of Energy estimated that in the U. S, smart buildings are responsible for a 20% reduction of total energy consumption in urban areas, exemplifying its sustainability approach to cities. North America has the largest share of smart solutions owing to its extensive application in commercial, government, and educational institutions. In North America, the smart building technology company, Cohesion, has raised $6.5 million in funding to expand its platform that uses IoT sensors to optimize building operations. In North America, the University of California, San Diego, has launched a smart campus project that uses IoT technology to improve campus safety, energy efficiency, and parking management.
In contrast, the Asia-Pacific region is likely to register the fastest CAGR over the forecast period. With the rapid urbanization that these countries are experiencing, China, India, and Japan are pouring money into smart city projects. In 2023, according to the Ministry of Housing and Urban Affairs, India saw the addition of 80 new projects in its Smart Cities Mission, with an emphasis on integrating smart technology into public spaces, infrastructure, and governance. Likewise in 2023, China built on a smart city push to grow smart infrastructure spending at projects valued at USD 14 dollars through 2025. It makes the region the fastest-growing market for smart spaces due to high population density, increasing urbanization rates, and government-supported initiatives.
Do You Need any Customization Research on Smart Space Market - Enquire Now
Key Players
Key Service Providers/Manufacturers
-
ABB Ltd (ABB Ability™ Smart Buildings, ABB Smart Sensors)
-
Siemens AG (Siemens Desigo CC, Siemens Building Technologies)
-
Cisco Systems Inc. (Cisco DNA Spaces, Cisco Meraki)
-
Honeywell International Inc. (Honeywell Vector Occupant App, Honeywell Building Management Solutions)
-
IBM Corporation (IBM Maximo, IBM TRIRIGA)
-
Microsoft Corporation (Azure Digital Twins, Microsoft Dynamics 365)
-
Adappt Intelligence Inc. (Adappt Workspace, Adappt Floorplan Management)
-
Schneider Electric (EcoStruxure™ Building Operation, EcoStruxure™ Energy Management)
-
Johnson Controls (Metasys® Building Management System, Johnson Controls Connected Services)
-
Spacewell Faseas (Spacewell IoT, Spacewell Workplace Management)
Users of Smart Space Services and Products
-
JLL (Jones Lang LaSalle)
-
CBRE Group, Inc.
-
Deloitte
-
Hewlett Packard Enterprise
-
Intel Corporation
-
Cisco
-
AT&T
-
Accenture
-
Cushman & Wakefield
-
SAP
Recent News and Developments
-
July 2024, LG Electronics purchased 80% of the smart home platform Athom Living and is expected to obtain the remaining amount in up to three years. Organizations like LG have made smart acquisitions to provide technology synergies that can boost LG's new open connectivity of smart homes powered by AI-based innovation integrating Athom Living.
-
Lenovo also launched two new solutions in March 2024, the ThinkSmart Tiny Kit and the ThinkPad Universal USB-C Smart Dock. At this occasion, these solutions enable enterprises to convert conference tracks into managed video experience and Microsoft Teams Rooms for end-users while providing IT administrators the benefits of simplified administration.
-
On July 12, 2023, Siemens Digital Industries Software and Microsoft partnered to accelerate digital transformation in manufacturing The two companies announced a partnership to help manufacturers accelerate their digital transformation journeys. The partnership will focus on areas such as cloud computing, artificial intelligence, and the Internet of Things.
-
On June 20, 2023, Honeywell and Johnson Controls merged smart building businesses The two companies announced plans to merge their smart building businesses to create a leading provider of connected buildings solutions. The combined company will have a portfolio of over 600,000 connected buildings and a customer base of over 200,000.
| Report Attributes | Details |
| Market Size in 2023 | USD 13.7 billion |
| Market Size by 2032 | USD 45.9 billion |
| CAGR | CAGR of 14.4% From 2024 to 2032 |
| Base Year | 2022 |
| Forecast Period | 2024-2032 |
| Historical Data | 2020-2022 |
| Report Scope & Coverage | Market Size, Segments Analysis, Competitive Landscape, Regional Analysis, DROC & SWOT Analysis, Forecast Outlook |
| Key Segments | • By Component (Solution, Services) • By Premises Type (Commercial, Residential, Others) • By Application (Energy Management and Optimization, Emergency Management, Security Management, Others) |
| Regional Analysis/Coverage | North America (US, Canada, Mexico), Europe (Eastern Europe [Poland, Romania, Hungary, Turkey, Rest of Eastern Europe] Western Europe] Germany, France, UK, Italy, Spain, Netherlands, Switzerland, Austria, Rest of Western Europe]), Asia Pacific (China, India, Japan, South Korea, Vietnam, Singapore, Australia, Rest of Asia Pacific), Middle East & Africa (Middle East [UAE, Egypt, Saudi Arabia, Qatar, Rest of Middle East], Africa [Nigeria, South Africa, Rest of Africa], Latin America (Brazil, Argentina, Colombia Rest of Latin America) |
| Company Profiles |
ABB Ltd, Siemens AG, Cisco Systems Inc., Honeywell International Inc., IBM Corporation, Microsoft Corporation, Adappt Intelligence Inc., Schneider Electric, Johnson Controls, Spacewell Faseas. |
| Key Drivers | •The integration of Internet of Things (IoT) technologies in smart spaces facilitates automation and enhanced management of various systems, leading to improved operational efficiency and user experience •With the rapid urbanization and increasing population in cities, there is a significant demand for smart spaces that optimize resource management and improve living conditions •The rising concern for security in public and private spaces has led to the adoption of smart technologies that provide better surveillance and emergency management capabilities |
| Market Restraints | •The significant upfront investment required for implementing smart technologies and infrastructure poses a challenge for many businesses and municipalities •The integration of various technologies and systems in smart spaces can be complex and time-consuming, leading to potential delays and increased costs •As smart spaces involve data collection and processing, concerns regarding data privacy and cybersecurity can hinder adoption |
Get in Touch
