Personal 3D Printers Market Size & Growth:
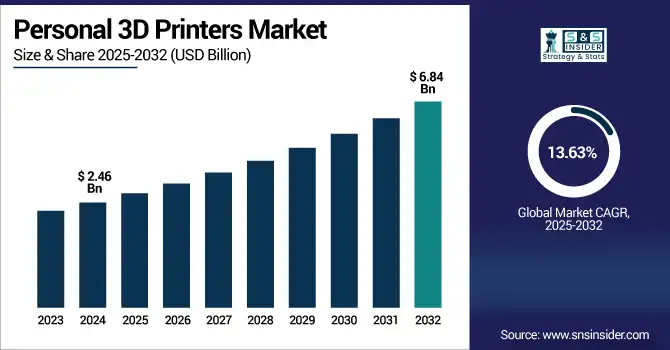
The Personal 3D Printers Market size was valued at USD 2.46 Billion in 2024 and is projected to reach USD 6.84 Billion by 2032, growing at a CAGR of 13.63% during 2025-2032. The personal 3D printers market is growing rapidly due to increasing demand for customized, multifunctional, small size, and easy to handle fabrication tools, adopted mainly in home and small business. Technological advancements including surface texture enhancements and AI-based design integration superimposed on layers, using features of UV printing that g together to create functions not imagined for personal 3D printers after a long-established history of layer fabrication. A new wave of users’ desire for devices that can handle a variety of materials and possess advanced features, such as full-color relief printing, smart software interfaces, and seamless creative workflows. This change is appealing to larger, first-time entrepreneurs and small-scale producers and is driving market growth. However, when the trifecta of low-cost, user-friendly, versatile creativity emerges, it leads to a steeper rise in the global of personal 3D printing within consumer.
To Get more information on Personal 3D Printers Market - Request Free Sample Report
EufyMake launched the E1 “Personal 3D-Texture UV Printer” on Kickstarter, targeting home and small business users with full-color and textured printing on over 300 materials. However, not a true 3D printer, the E1 uses UV-cured inkjet technology to enhance 3D prints and other objects, signaling innovation in the personal 3D printing ecosystem.
The U.S. personal 3D printers market size was valued at USD 0.74 Billion in 2024 and is projected to reach USD 1.69 Billion by 2032, growing at a CAGR of 10.89% during 2025-2032. This growth is driven by increasing demand for at-home manufacturing, personalized product design, and educational prototyping. Market expansion is further fueled by technological advancements, falling printer costs, and rising adoption among hobbyists, makers, and small-scale entrepreneurs.
The personal 3D printers market trends include the rise of user-friendly, plug-and-play devices tailored for home use, growing integration of AI-powered design tools, and expanding material compatibility including flexible and eco-friendly filaments. Furthermore, cloud printing platforms, smaller printer formats, and more affordable multi-color and resin printers are improving consumer access. There is also a boom in creative use cases such as bespoke art, home decor, teaching models, and personal items driving further innovation and adoption.
Personal 3D Printers Market Drivers:
-
Rising Customization Demands Propel Growth of Personal 3D Printers Market
The increasing need for cost-effective, high-precision solutions in low volume and customized manufacturing is a key factor driving the growth of the personal 3D printers market. Industries, such as consumer electronics, healthcare, and automotive are shifting from traditional production to agile, tool-free methods that allow for faster prototyping and flexible design changes. The demand for materials with properties including flame retardancy, heat resistance, and fine feature resolution is also growing, pushing the development of advanced resins and compact, high-speed printers. Furthermore, small businesses and hobbyists are adopting personal 3D printers to create functional parts, jigs, and fixtures at reduced cost and time, accelerating the trend toward decentralized, on-demand manufacturing and enhancing the value proposition of personal 3D printing technologies.
At RAPID+TCT 2025, 3D Systems unveiled the Figure 4 135 printer and Tough 75C FR Black material designed for the high-mix, low-volume manufacturing space, combining unmatched accuracy, heat resistance and savings. Additionally, the scanning module introduced new features for both EXT Titan Pellet printers and QuickCast Diamond build style on the PSLA 270, which enhanced process efficiency while expediting investment casting applications
Personal 3D Printers Market Restraints:
-
High Cost and Technical Barriers Restrict Widespread Adoption of Personal 3D Printers
The personal 3D printers market faces significant restraints due to high initial investment costs, material limitations, and technical complexities. Personal 3D printers often need constant calibration, more maintenance, and post-processing, which really scares off casual users and small businesses. Not only this, availability of low-cost and high-performance 3D printing materials is limited, which reduces applications. Further scaling is hindered by problems of IP and by regulatory modalities, which are not yet standardized. Additionally, the slower print speed and restricted build volumes of these machines make them obsolete for high-volume and time-sensitive production. Even single polymer printers cannot achieve full mainstream penetration, as inconsistent print quality among low-cost models, together with these constraints, limit the technology's adoption to regions or industries that require highly reliable and scalable manufacturing solutions but are less cost-sensitive.
Personal 3D Printers Market Opportunities:
-
Ceramic 3D Printing Innovation Accelerates Aerospace Development and Drives Market Demand
High-resolution ceramic 3D printing, which is becoming significantly integrated into aerospace applications, provides significant driver for the global personal 3D printers market. This capability allows manufacturers to accelerate the prototyping and production of complex parts, such as turbine blades, by reducing the entire cycle from years to weeks. This allows for increased flexibility, decreased cost, and the ability to make custom and low-volume parts in record time. These benefits lead to wider adoption amongst industries looking for similar efficiencies, as demonstrated through advanced use cases, thereby increasing demand for next-gen personal 3D printers that possess industrial-grade capabilities.
Honeywell tests ultra low cost turbofan blades in days instead of months, saving time and money, after adopting Prodways’ CERAM PRO 365 3D printing system.
Personal 3D Printers Market Challenges:
-
Limited Material Options and Technical Barriers Hinder Widespread Adoption of Personal 3D Printers
The Personal 3D Printers Market faces several challenges. A major issue is the limited range of compatible materials, restricting the complexity and functionality of printed objects. Moreover, the technical expertise for designing, operating, and debugging is a hurdle for casual or novice users. Another reason that discourages adoption are the high initial costs of having quality printers and the expenses for their upkeep and use. Other limitations when it comes to home or education use include print speed, variability in the output quality, and safety issues such as fumes and heat. Additionally, intellectual property issues related to designs that can be easily copied and the absence of standardized regulations can hinder the growth of the market. Solving these issues is necessary to reach the full potential of personal 3D print solutions.
Personal 3D Printers Market Segmentation Analysis:
By Type
In 2024, the Hardware segment accounted for approximately 61% of the personal 3D printers market share, as demand for desktop 3D printers that are small, relatively inexpensive, and easy to operate was growing among hobbyists, education, and small businesses. Increased DIY culture and operational advances in printer hardware including better resolution, multi-material printing, and faster speeds led to rapid hardware adoption. Couple that with continual product launches, lower unit costs and hardware has all but locked in the personal 3D printing ecosystem.
The Services segment is expected to experience the fastest growth in personal 3D printers market over 2025-2032 with a CAGR of 20.20%, fueled by rising demand for training, maintenance, software integration, and technical support. As consumer adoption increases, users seek expert services to maximize printer performance, optimize designs, and reduce downtime, driving rapid expansion of this value-added segment.
By Material
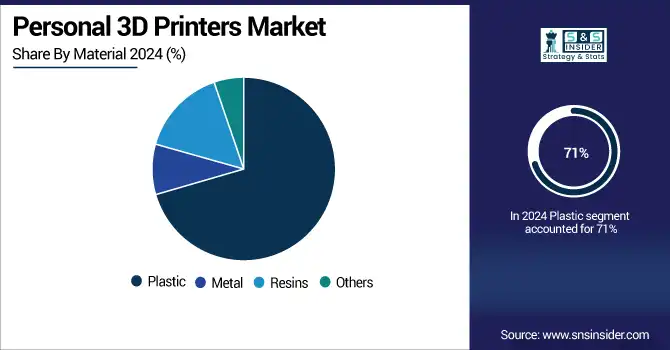
In 2024, the Plastic segment accounted for approximately 71% of the personal 3D printers market share, owing to their cost-effectiveness, user-friendliness, and easily obtainable materials including PLA and ABS. Plastic filaments also sustain their dominant role for hobbyists, educators, and prototyping due to their versatility, low weight, and compatibility with most desktop 3D printers.
The Metal segment is expected to experience the fastest growth in personal 3D printers market over 2025-2032 with a CAGR of 20.20%, due to increasing demand for stronger, functional parts in commercial, home-based implementation, and prosumer applications. The compact metal-printing technology and lower material costs have made metal 3D printing accessible to personal users.
By Technology
In 2024, the Fused Deposition Modeling (FDM) segment accounted for approximately 67% of the personal 3D printers market share, as this method is a cost-effective and user-friendly additive manufacturing process, capable of proliferating a wide variety of thermoplastic materials. This is only exacerbated by the continued use of the technology by hobbyists, educators, and prosumers for prototyping and functional parts.
The Selective Laser Sintering (SLS) segment is expected to experience the fastest growth in Personal 3D Printers market over 2025-2032 with a CAGR of 19.50%, owing to the wide range of processes, SLS can support and demand for high-resolution, high-performance parts with complicated geometries, as it requires no support structures and provides exceptional mechanical properties. Compact SLS systems are also becoming more affordable and accessible, bringing new users including advanced hobbyists and small-scale manufacturers into the fold.
By End-Use
In 2024, the Others segment accounted for approximately 67% of the personal 3D printers market share, due to the growing use of SLA, DLP, and binder jetting technologies. They provide high accuracy and excellent surface finish based on resin types and allow printings for different applications ranging from dental models to jewelry design and prototyping purposes, which makes them appealing for hobbyists, professionals, and educators searching for quality and affordability.
The Construction segment is expected to experience the fastest growth in the personal 3D printers market over 2025-2032 with a CAGR of 19.50%, owing to rising DIY home improvement trend, personalized architectural modeling, and compact 3D Printers for small building components. The kind of prototype print that users are utilizing now are quicker, cheaper, and custom-built for the construction purposes with a 3D printing.
Personal 3D Printers Market Regional Insights:
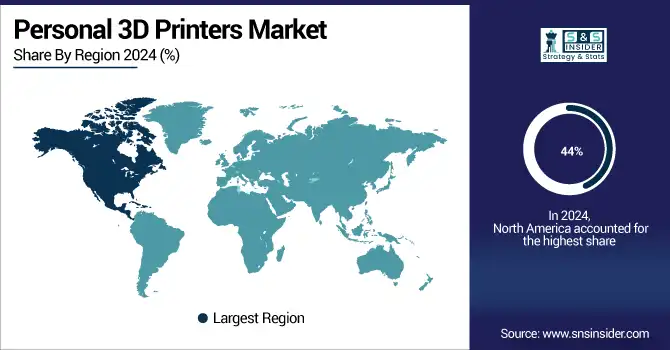
North America Personal 3D Printers Market Trends
In 2024 North America dominated the personal 3D printers market and accounted for 44% of revenue share. driven by strong consumer adaptation, tech infrastructure, and players in the space. High disposable income, strong distribution channels, and the escalating demand for Do-It-Yourself (DIY) and educational 3D printing applications, especially in the U.S. and Canada, are some of the factors driving the growth of the market in the region.
Asia Pacific Personal 3D Printers Market Trends
Asia Pacific is expected to witness the fastest growth in the personal 3D printers market over 2025-2032, with a projected CAGR of 15.40%. The growth is driven by rising education and hobbyist adoption, expanding middle-class population, increasing disposable income, and government initiatives to promote the digital manufacturing of the countries including China, Japan, South Korea, and India.
Europe Personal 3D Printers Market Trends
In 2024, Europe emerged as a promising region in the personal 3D printers market, owing to the growing investment in innovation, milestones achieved by the designers and hobbyists using 3D printers to create prototypes and parts and availability of key manufacturers. A combination of existing demand for sustainability and localized production in the region, supportive education initiatives and tech-enabled consumer interest strengthened the region and led to modest growth of the market.
LATAM and MEA Personal 3D Printers Market Trends
LATAM and MEA are experiencing steady growth in the Personal 3D Printers market, due to awareness, education, and slow adoption of technology. While still nascent, these areas are gaining from a combination of growing access to affordable 3D printers and bolstering state support. The development trajectory remains stable, but bright, as outreach is also extended by the market players.
Get Customized Report as per Your Business Requirement - Enquiry Now
Personal 3D Printers Companies are:
-
EnvisionTEC GmbH
-
EOS GmbH
-
GE Additive
-
Glowforge Inc.
-
Optomec Inc.
-
Prodways Group
-
SLM Solutions Group AG
-
The ExOne Company
-
Concept Laser GmbH
-
Arcam AB
-
ExOne GmbH
-
Solidscape
-
Voxeljet Technology GmbH
-
HP Inc., Formlabs Inc.
-
Ultimaker
-
Anycubic
-
Creality and Others.
Recent Developments:
-
In May 2025, Optomec unveiled its 558 machines with Siemens’ SINUMERIK ONE and AutoClad software, boosting automation in turbine blade repair. The digital-native CNC enables complex 5-axis operations, enhancing speed and precision in aerospace MRO.
| Report Attributes | Details |
|---|---|
| Market Size in 2024 | USD 2.46 Billion |
| Market Size by 2032 | USD 6.84 Billion |
| CAGR | CAGR of 13.63% From 2025 to 2032 |
| Base Year | 2024 |
| Forecast Period | 2025-2032 |
| Historical Data | 2021-2023 |
| Report Scope & Coverage | Market Size, Segments Analysis, Competitive Landscape, Regional Analysis, DROC & SWOT Analysis, Forecast Outlook |
| Key Segments | • By Type(Hardware, Software and Services) • By Material(Plastic, Metal, Resins and Others) • By Technology(Fused Deposition Modeling (FDM), Stereolithography (SLA), Digital Light Processing (DLP), Selective Laser Sintering (SLS), Selective Deposition Lamination and Others) • By End Use (Aerospace, Automotive and Defence, Healthcare, Construction and Others), |
| Regional Analysis/Coverage | North America (US, Canada), Europe (Germany, UK, France, Italy, Spain, Russia, Poland, Rest of Europe), Asia Pacific (China, India, Japan, South Korea, Australia, ASEAN Countries, Rest of Asia Pacific), Middle East & Africa (UAE, Saudi Arabia, Qatar, South Africa, Rest of Middle East & Africa), Latin America (Brazil, Argentina, Mexico, Colombia, Rest of Latin America). |
| Company Profiles | The Personal 3D Printers market Companies are 3D Systems Corporation, EnvisionTEC GmbH, EOS GmbH, Stratasys Ltd., GE Additive, Glowforge Inc., Optomec Inc., Prodways Group, SLM Solutions Group AG, The ExOne Company, Concept Laser GmbH, Arcam AB, ExOne GmbH, Solidscape, Voxeljet Technology GmbH, HP Inc., Formlabs Inc., Ultimaker, Anycubic, Creality. and Others. |
Frequently Asked Questions
North America dominated the Personal 3D Printers Market in 2024.
The “Hardware” segment dominated the Personal 3D Printers Market
Rising DIY culture, educational applications, falling printer costs, and advancements in user-friendly design are key drivers of the Personal 3D Printers Market.
The Personal 3D Printers Market size was valued at USD 2.46 Billion in 2024 and is projected to reach USD 6.84 Billion by 2032
The Personal 3D Printers Market is expected to grow at a CAGR of 13.63% during 2025-2032.
Get in Touch
