Pharmacy Benefit Management Market Report Scope and Overview:
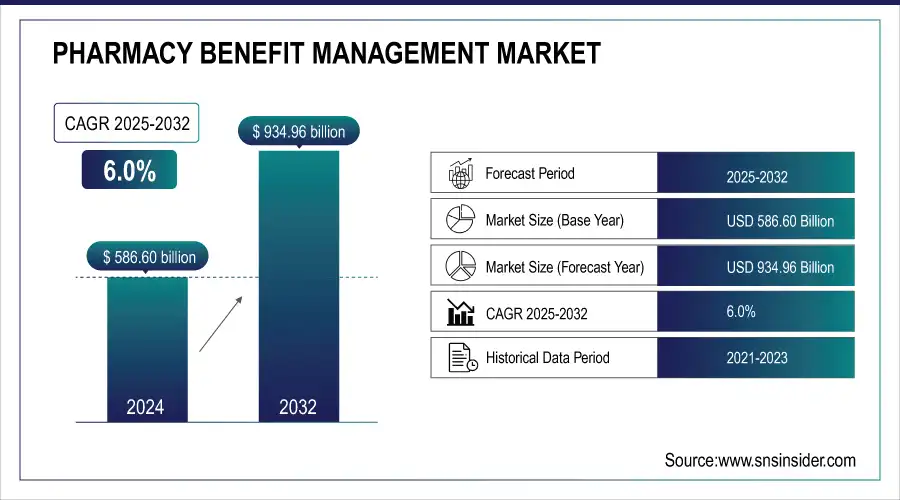
The Pharmacy Benefit Management Market size was estimated at USD 586.60 Billion in 2024 and is expected to reach USD 934.96 billion by 2032 at a CAGR of 6.0% during the forecast period of 2025-2032.

Get more information on Pharmacy Benefit Management Market - Request Free Sample Report
Pharmacy Benefit Management (PBM) Market: A Surge in Growth Driven by Innovation and Rising Healthcare Expenditures
Accelerating Market Expansion Fueled by Increased Demand for Cost-Effective Drug Management Solutions
The pharmacy benefit management (PBM) market is experiencing robust growth, driven by several critical factors such as the increasing adoption of PBM systems, rising healthcare expenditure, and a growing demand for prescription medications. As global health spending escalates, adopting advanced software solutions for managing drug inventories, enhancing accessibility, and reducing medication costs is expected to propel market expansion during the forecast period. For instance, Canada's healthcare expenditure surged to USD 344 billion in 2023 from USD 334 billion in 2022, as the Canadian Institute for Health Information reported. This increase in spending is anticipated to foster the integration of state-of-the-art PBM systems, making essential medications more affordable and accessible. The escalating reliance on pharmacy benefit management solutions further enhances operational accuracy, improves pharmacy safety, and boosts patient health outcomes. Noteworthy is Elixir, the PBM division of Rite Aid, which joined the Pharmaceutical Care Management Association (PCMA) in March 2022 to enhance patient access to cost-effective prescription drugs, contributing to market growth.

Pharmacy Benefit Management Market Size and Forecast:
-
Market Size in 2024: USD 586.60 Billion
-
Market Size by 2032: USD 934.96 Billion
-
CAGR: 6.0% from 2025 to 2032
-
Base Year: 2024
-
Forecast Period: 2025–2032
-
Historical Data: 2021–2023
Pharmacy Benefit Management Market Highlights:
-
Rising global healthcare expenditure and increasing pharmaceutical costs are driving demand for efficient PBM services to manage drug pricing and optimize costs.
-
Adoption of advanced PBM software, along with AI and machine learning integration, enhances operational efficiency, streamlines claim processing, and supports cost savings.
-
Growth in specialty pharmacy services and the prevalence of chronic diseases is increasing the need for effective medication management solutions.
-
Strategic partnerships, mergers, and innovative formulary management are expanding market reach and promoting competition among drug manufacturers.
-
Favorable government regulations and reimbursement policies create a supportive environment for PBM adoption and market growth.
| Factor/Innovation | Description | Positive Impact on PBM Market |
|---|---|---|
| Increasing Healthcare Expenditure | Rising global spending on healthcare drives demand for efficient drug management solutions. | Expands market opportunities for PBM systems to optimize drug pricing and manage costs effectively. |
| Advanced PBM Software Solutions | Adoption of cutting-edge PBM software for managing drug inventories and reducing costs. | Enhances operational efficiency, improves accessibility to medications, and supports cost reduction. |
| Integration of Machine Learning (ML) | ML algorithms used for predictive analytics, fraud detection, and claim processing. | Improves accuracy, reduces claim processing times, and enhances cost savings. |
| Integration of Artificial Intelligence (AI) | AI-driven insights for personalized medication management and improved patient outcomes. | Streamlines operations, enhances patient care, and fosters innovation in drug management. |
| Partnerships and Mergers | Strategic alliances and acquisitions in the PBM sector to streamline services. | Enhances service delivery, optimizes drug pricing, and expands market reach. |
| Increased Adoption of Specialty Pharmacy Services | Growth in demand for specialty medications and handling services. | Drives demand for PBM services to manage high-cost specialty drugs effectively. |
| Government Regulations and Reimbursements | New regulatory guidelines and favorable reimbursement policies for PBMs. | Creates a supportive environment for market growth and enhances consumer protection. |
| Innovative Formulary Management | Introduction of cost-effective formulary recommendations and alternatives. | Promotes competition among drug manufacturers and reduces medication costs. |
| Growing Chronic Disease Prevalence | Rise in chronic diseases necessitating effective drug management solutions. | Increases demand for PBM services to handle complex medication regimens and cost management. |
Additionally, significant players in the PBM industry are actively developing innovative software and solutions, further driving market progress. For example, in July 2023, Prime Therapeutics introduced formulary recommendations to provide more cost-effective alternatives to Humira, fostering competition among drug manufacturers and reducing costs for patients. However, the market faces challenges such as resistance to adopting pharmacy automation systems and stringent regulatory processes related to confidentiality, which may impede growth.
Despite these obstacles, the market is projected to continue its upward trajectory, supported by innovations like the integration of machine learning (ML) and artificial intelligence (AI) into pharmacy workflows. These technologies streamline operations, reduce claim processing times, and help identify fraudulent claims, significantly enhancing efficiency and cost savings for PBM providers. Overall, the rising adoption of PBM services among insurers, pharmacies, and drug manufacturers, coupled with technological advancements, positions the market for substantial growth in the coming years.
| Company | Key Strategies & Innovations | Recent Developments |
|---|---|---|
| CVS Health | Expanding PBM services, strategic acquisitions | Recent acquisition/partnership news |
| Optum, Inc. | Advanced analytics, AI integration | New software solutions launched |
| Prime Therapeutics | Cost-effective formulary alternatives | Recent formulary updates |
| Elixir Rx Solutions | Enhancing patient access, new partnerships | Membership in PCMA |
| Anthem, Inc. | Integration with healthcare services | New collaboration announcements |
Pharmacy Benefit Management Market Drivers:
-
Rising Healthcare Expenditure and Pharmaceutical Costs
The growing global healthcare expenditure is a primary driver of the pharmacy benefit management (PBM) market's expansion. A critical factor fueling this growth is the escalating pharmaceutical costs, particularly due to the rising prevalence of chronic diseases worldwide. As the demand for effective treatment solutions increases, pharmaceutical companies are focusing on developing high-priced branded medications for chronic conditions, resulting in a significant rise in pharmaceutical spending. Additionally, the rising costs of medications and the increasing volume of prescriptions globally have heightened the healthcare burden. In response, there is a growing need for PBM services to manage drug prices and pharmaceutical spending more effectively. PBM services enable healthcare providers, insurers, and pharmacies to control costs while ensuring access to necessary treatments. Consequently, the adoption of PBM systems is expanding as they play a crucial role in optimizing drug pricing and utilization, making medications more affordable and accessible. This increasing need for cost containment and efficient management of pharmaceutical resources is expected to drive the PBM market's growth over the forecast period.
Pharmacy Benefit Management Market Restraints:
-
Lack of Transparency in Profit Revenues
The adoption of pharmacy benefit management (PBM) systems is hindered by a significant lack of transparency in profit revenues. Many stakeholders, including healthcare providers, insurers, and patients, express concern about the opaque nature of how PBM companies generate profits, particularly regarding drug pricing and rebates. This perceived lack of clarity creates distrust and slows down the widespread acceptance of PBM services. Without a clear understanding of revenue flow, stakeholders may be hesitant to fully integrate PBM solutions, thereby restraining market growth. Addressing this transparency issue is crucial for fostering broader adoption and enhancing market acceptance.
Pharmacy Benefit Management Market Segment Analysis:
By Service
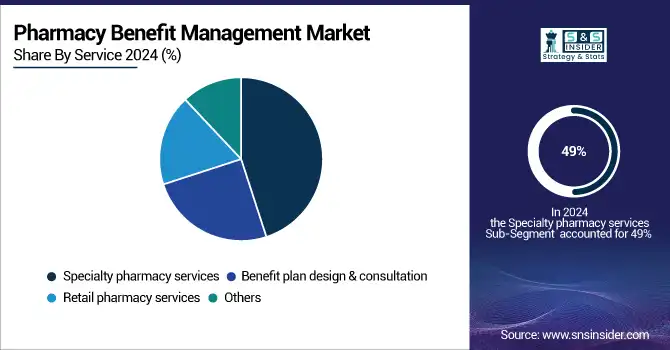
In 2024, the specialty pharmacy services segment held the highest market revenue at 49%. Specialty pharmacies are developed to efficiently supply medications with exceptional handling, stockpiling, and distribution requirements to address unusual or complicated medical conditions. The rising incidence of rare and chronic diseases is driving demand for specialty medications. High-priced pharmaceuticals need to be affordable for most patients, which boosts the demand for pharmacy benefit management services to make specialty medications more manageable in terms of cost. Consequently, specialty pharmacy services dominate the industry. Several market participants are engaged in strategic efforts to drive market growth, including the development of advanced solutions and partnerships to enhance service delivery.

By End User
In 2024, the healthcare providers segment led the pharmacy benefit management (PBM) market's growth, driven by a surge in mergers and acquisitions involving PBM services by insurance companies and healthcare providers. This trend highlights a strategic effort to streamline operations and enhance service offerings. For instance, the partnership between First Medical Health Plan Inc. and Abarca Health LLC established a three-year collaboration to deliver pharmacy benefit administration services. Such partnerships enable healthcare providers to integrate PBM services more efficiently, improving patient care and reducing prescription costs. Additionally, the increasing presence of health insurance companies in both developed and emerging markets is contributing to the expansion of PBM services. As healthcare systems evolve and the demand for affordable medications rises, insurance providers are investing in PBM systems to enhance their service portfolios. This collaboration between healthcare providers and insurance companies not only fosters market growth but also helps optimize drug pricing, improve access to necessary treatments, and enhance overall healthcare outcomes. These developments are expected to fuel the healthcare providers segment's dominance in the PBM market during the forecast period.
Pharmacy Benefit Management Market Regional Analysis:
North America Pharmacy Benefit Management Market Trends:
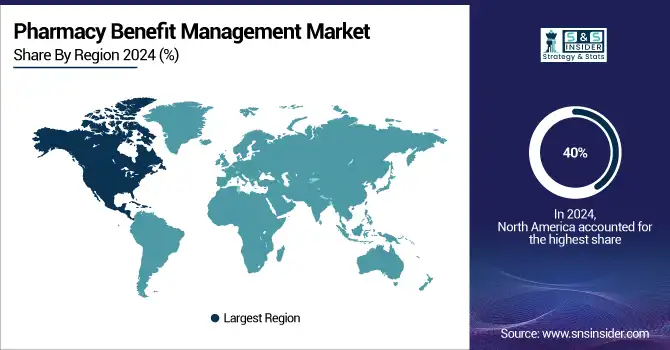
North America dominated the pharmacy benefit management (PBM) market in 2024, holding a 40% share valued at USD 206.3 million. This dominance is primarily due to the concentration of major pharmaceutical manufacturers, insurance companies, PBM service providers, and retail pharmacy chains, many of which are based in the United States. The widespread adoption of health insurance among the U.S. population has further fueled market growth. Additionally, over 50% of the U.S. population suffers from chronic diseases, increasing the demand for PBM services. The market's expansion in North America is also supported by rising insurance policy adoption rates, high healthcare expenditures, and a growing number of health insurance providers. Favorable government reimbursement policies play a crucial role in driving market growth, as many U.S. patients rely on reimbursements for treatment.

Need any customization research on Pharmacy Benefit Management Market - Enquiry Now
Europe Pharmacy Benefit Management Market Trends:
Europe is experiencing the fastest compound annual growth rate (CAGR) during the forecast period. The region's growth is driven by a high percentage of patients covered by medical insurance, a favorable regulatory environment for PBMs, and the expanding presence of pharmacy benefit administrators. The UK holds the largest market share in the region, while France is witnessing the fastest growth, contributing to Europe's strengthening position in the global PBM market.
Asia-Pacific Pharmacy Benefit Management Market Trends:
Asia-Pacific is witnessing significant growth in the PBM market, driven by the increasing prevalence of chronic diseases, rising healthcare expenditures, and growing adoption of health insurance across countries like China, Japan, and India. The expansion of retail pharmacy chains and the entry of global PBM service providers are further boosting market growth. Governments in the region are also implementing policies to improve access to affordable medications, supporting the adoption of PBM services.
Latin America Pharmacy Benefit Management Market Trends:
Latin America is gradually expanding its PBM market, supported by growing healthcare awareness, increasing insurance penetration, and the rise of chronic disease incidence. Brazil and Mexico are the key contributors to market growth in the region. Government initiatives to improve healthcare infrastructure and reimbursement policies are facilitating wider adoption of PBM solutions.
Middle East & Africa Pharmacy Benefit Management Market Trends:
The Middle East & Africa region is witnessing moderate growth in the PBM market, primarily due to improving healthcare infrastructure, rising awareness of chronic disease management, and increasing adoption of health insurance. The UAE and Saudi Arabia are emerging as key markets, driven by favorable regulatory frameworks and investments in modern healthcare systems.
Pharmacy Benefit Management Market Key Players:
-
CVS Health
-
SS&C Technologies, Inc.
-
Elixir Rx Solutions, LLC
-
Anthem, Inc.
-
Optum, Inc.
-
Centene Corporation
-
Abarca Health LLC
-
Medimpact
-
Cigna
-
Change Healthcare
-
CaptureRx Inc.
-
Benecard Services, LLC
-
Express Scripts Holding Company
-
McKesson Corporation
-
Sea Rainbow
-
Vidalink
-
Prime Therapeutics
-
Humana Pharmacy Solutions
-
Magellan Rx Management
-
MeridianRx
Pharmacy Benefit Management Market Competitive Landscape:
The New York State Department of Financial Services (DFS), established in 2011, is a regulatory agency overseeing banking, insurance, and financial services in New York. DFS ensures the safety, soundness, and fair treatment of consumers by enforcing laws, monitoring financial institutions, and promoting market stability. The agency plays a key role in protecting policyholders, depositors, and the broader financial ecosystem.
-
February 2024: The New York State Department of Financial Services (DFS) superintendent introduced new regulatory guidelines for Pharmacy Benefit Managers (PBMs) aimed at enhancing consumer protections and addressing anti-competitive practices within the state.
Better Therapeutics, Inc. is a biotechnology company, established in 2015, specializing in prescription digital therapeutics (PDTs). The company develops software-based cognitive behavioral therapy (CBT) solutions aimed at addressing cardiometabolic diseases such as type 2 diabetes, hypertension, and hyperlipidemia. Its lead product, AspyreRx, received FDA authorization in 2023 as the first prescription-only digital therapeutic device delivering CBT via smartphone.
-
February 2024: Better Therapeutics Inc. secured a rebate agreement with a leading Pharmacy Benefits Manager (PBM) in the U.S. This agreement focuses on the PBM’s commercial clients, allowing plan participants to incorporate AspyreRx into their formularies while qualifying for rebates.
| Report Attributes | Details |
| Market Size in 2024 | USD 33.03 Billion |
| Market Size by 2032 | USD 98.96 Billion |
| CAGR | CAGR of 14.70% From 2025 to 2032 |
| Base Year | 2024 |
| Forecast Period | 2025-2032 |
| Historical Data | 2021-2023 |
| Report Scope & Coverage | Market Size, Segments Analysis, Competitive Landscape, Regional Analysis, DROC & SWOT Analysis, Forecast Outlook |
| Key Segments | • By Service (Retail pharmacy services, Specialty pharmacy services, Benefit plan design & consultation, and Others) • By End User (Healthcare Providers and Employers) |
| Regional Analysis/Coverage | North America (US, Canada), Europe (Germany, UK, France, Italy, Spain, Russia, Poland, Rest of Europe), Asia Pacific (China, India, Japan, South Korea, Australia, ASEAN Countries, Rest of Asia Pacific), Middle East & Africa (UAE, Saudi Arabia, Qatar, South Africa, Rest of Middle East & Africa), Latin America (Brazil, Argentina, Mexico, Colombia, Rest of Latin America). |
| Company Profiles | CVS Health, SS&C Technologies, Inc., Elixir Rx Solutions, LLC, Anthem, Inc., Optum, Inc., Centene Corporation, Abarca Health LLC., Medimpact, Cigna, Change Healthcare, CaptureRx Inc., Benecard Services, LLC, Express Scripts Holding Company, McKesson Corporation, Sea Rainbow, Vidalink, Prime Therapeutics, Humana Pharmacy Solutions, Magellan Rx Management, MeridianRx and others. |

