Contact Lens Market Report Scope & Overview:
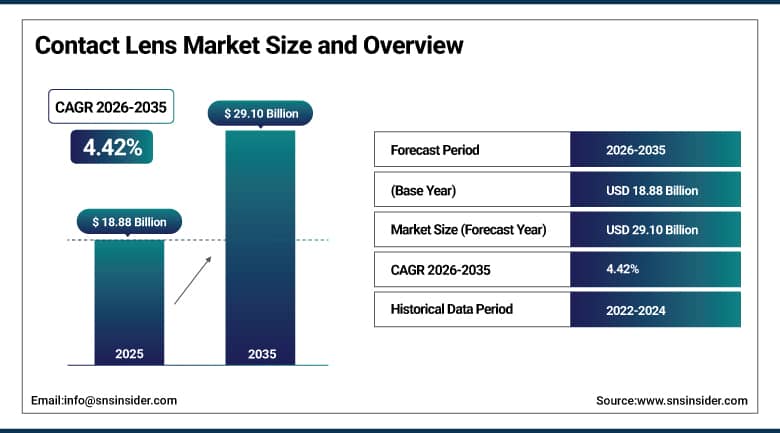
The Contact Lens Market was valued at USD 18.88 Billion in 2025 and is expected to reach USD 29.10 Billion by 2035, growing at a CAGR of 4.42% from 2026 to 2035.
The Contact Lens Market is experiencing steady growth due to the rising incidence of various vision problems like myopia, hyperopia, and astigmatism. The rise in screen exposure and use of electronic devices is causing a surge in eye strains and hence demand for correctional lenses. Preference towards cosmetic and tinted lenses is another major factor that is driving the usage of lenses. Innovation in lens material like silicone hydrogel has improved the comfort and oxygen flow of the lenses. Eye care awareness, increasing disposable income, and availability through online retailers are further contributing towards market growth. There are an estimated 140 million people using contact lenses in 2025 across the world, which will surpass 170 million by 2035.
According to the European Eye Epidemiology Consortium, about 50% of young adults in parts of Europe are myopic, with rising prevalence linked to increased screen exposure and reduced outdoor activity affecting long-term eye health trends. Multifocal and toric designs together comprised over 30% of contact lens demand in 2025, driven by presbyopia and astigmatism correction needs.
Market Size and Forecast
-
Market Size in 2026E: USD 19.72 Billion
-
Market Size by 2035: USD 29.10 Billion
-
CAGR: 4.42% from 2026 to 2035
-
Fastest Growing Region: Asia Pacific
-
Largest Region: North America
To Get More Information On Contact Lens Market - Request Free Sample Report
Contact Lens Market Trends
-
Rising prevalence of vision disorders such as myopia, hyperopia, and astigmatism is driving the contact lens market.
-
Growing preference for cosmetic and lifestyle-enhancing vision correction solutions is boosting market growth.
-
Expansion of optical retail chains, e-commerce platforms, and eye care clinics is fueling product accessibility.
-
Increasing focus on comfort, breathability, and long-wear usability is shaping adoption trends.
-
Advancements in silicone hydrogel materials, daily disposable lenses, and smart contact lens technologies are enhancing performance and user experience.
The U.S. Contact Lens Market Outlook
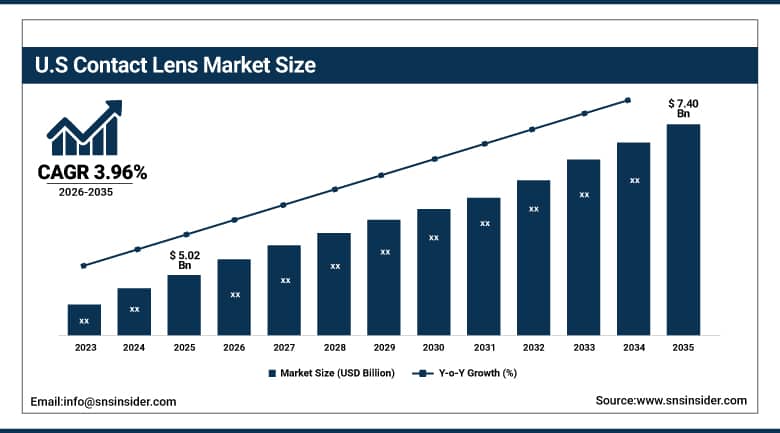
The U.S. Contact Lens Market was valued at approximately USD 5.02 Billion in 2025 and is expected to reach approximately USD 7.40 Billion by 2035, growing at a CAGR of approximately 3.96%.
The United States is the world's largest national contact lens market, with approximately 32 million active lens wearers in 2025 whose purchasing patterns are increasingly concentrated in daily disposable silicone hydrogel products and online subscription channels. The U.S. contact lens market operates within a practitioner-dominated prescribing framework where eye care professionals write the initial contact lens prescription and have historically influenced product selection at the point of dispensing.
According to the U.S. Centers for Disease Control and Prevention, approximately 93 million adults in the United States are at high risk for vision loss, while around 12 million Americans aged 40 and above experience vision impairment, highlighting a significant public health burden.
Contact Lens Market Segment Analysis
-
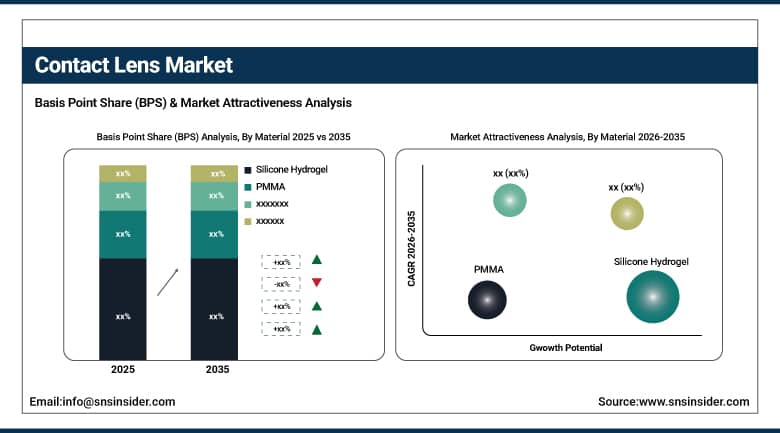
By Material, Silicone Hydrogel will have the largest share with 65.38% in 2025, and PMMA is expected to grow with the highest CAGR of 5.11%.
-
By Product Type, Soft Contact Lenses has dominated the market with a share of 72.45% in 2025 and Scleral Lenses is growing at a highest CAGR of 5.36%.
-
By Design, Spherical Lenses accounts for 58.27% in 2025, followed by Multifocal Lenses which is growing at CAGR of 5.14%.
-
By Usage, Daily Disposable Lenses is the second largest value share of 45.19% in 2025, and is also expected to register the fastest CAGR of 5.07%.
-
By Application, they be divided by application, Corrective Lenses will lead its segment over 68.11% share in 2025; and Cosmetic & Aesthetic Lenses at a CAGR of 5.39%.
-
By Distribution Channel, ptical Stores account for the largest market share with 41.82% in 2025, followed by the Online Retail growing at a CAGR of 5.43%.
By Material, silicone hydrogel segment dominates the market, PMMA segment is the fastest growing
Silicone Hydrogel dominates the market in 2025 because of its higher oxygen permeability capacity, high degree of comfort provided by it, and minimal chances of developing corneal hypoxia in case of prolonged use. Eye comfort and healthy eyes in prolonged use situations make it more popular among the masses. Increased availability, advancement in technology, and adoption in both daily and prolonged wear contacts add to its prominent position in the worldwide contact lenses market.
PMMA is the fastest growing segment due to higher demand for specialty rigid lenses required for complex cases of vision correction. The improvements in the design of the lenses along with fitting methods have helped enhance their usability, allowing for greater applications within a clinical environment. Rising occurrences of corneal conditions and preference for customized optical devices fuel the growth further.
By Product Type, soft contact lenses segment dominates the market, scleral lenses segment is the fastest growing
Soft Contact Lenses dominate the market in 2025 owing to their comfortable nature and easy adaptation by new customers. Their ease in wearing, wide availability, and suitability for both daily and extended wear make them the most favored lenses. Increased consumer favorability coupled with advances in their design and development will ensure that they remain at the top of the hierarchy across the globe.
Scleral Lenses are the fastest growing segment owing to the rising incidences of the use of such lenses for corneal irregularities and severe dryness and post-surgical conditions. They will offer advanced correction of vision and increased comfort. Technological advances in their design and production along with an increase in awareness of eye care professionals will drive the demand for them.
By Design, spherical lenses segment dominates the market, multifocal lenses segment is the fastest growing
Spherical Lenses dominate the market in 2025 because of the popularity of spherical lenses in correcting common refractive disorders such as myopia and hyperopia. Spherical lenses have become the most popular choice because of their low cost, wide availability, and simplicity in design. The high demand for spherical lenses coupled with continuous usage in both soft lenses and rigid lenses has led to their market dominance.
Multifocal Lenses are the fastest growing segment owing to the rising instances of presbyopia among older people. Multifocal lenses help in doing away with wearing glasses for various distances because one lens can provide clear vision at different distances. Growing consumer inclination towards comfort along with advanced designs of multifocal lenses is contributing significantly towards high adoption rates of these lenses.
By Usage, daily disposable lenses segment dominates the market, daily disposable lenses segment is also the fastest growing
In 2025, the Daily Disposable Lenses segment holds a strong position in the market owing to its high hygienic standard, ease of use, and the absence of cleaning procedures. The segment ensures less chances of developing an eye infection and is suitable for users looking for effortless vision correction devices. Consumer tendency towards adopting safe and single-use products, together with heightened concern regarding eye health and comfort, enhances the popularity and leadership of the segment in the contact lens market. Moreover, the Daily Disposable Lenses segment is the fastest-growing segment owing to the increasing demand for such convenient and hygienic vision correction devices.
By Application, corrective lenses segment dominates the market, cosmetic & aesthetic lenses segment is the fastest growing
Corrective Lenses dominate the market in 2025 ow owing to the widespread nature of refraction defects in vision like myopia, hyperopia, and astigmatism in the global population. Corrections lenses play a critical role in correcting vision daily, and thus they are commonly worn by individuals irrespective of age groups. High demand, increased health awareness, and constant prescription drives ensure their monopoly in the global contact lenses market.
Cosmetic & Aesthetic Lenses are the fastest growing segment owing to fashion trends, growing influence of social media, and higher demand for enhancing eye colors. People have been increasingly using colored lenses to look stylish and attractive. Increasing variety of products and safety measures along with popularity among young consumers contribute to the rapid market growth in this segment.
Regional Analysis
|
Region |
Major Country |
Share within Region, 2025 (%) |
|---|---|---|
|
North America |
United States |
84.73% |
|
Europe |
Germany |
26.84% |
|
Asia Pacific |
China |
38.47% |
|
Middle East & Africa |
UAE |
22.84% |
|
Latin America |
Brazil |
43.47% |
North America Contact Lens Market Insights
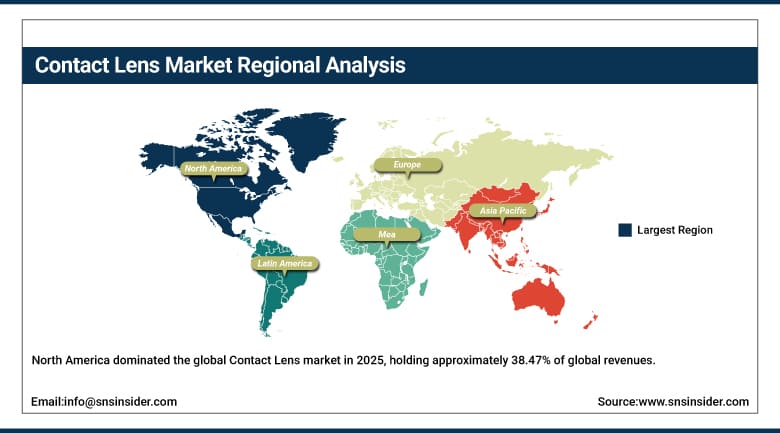
North America dominated the global Contact Lens market in 2025, holding approximately 38.47% of global revenues. The United States accounts for approximately 84.73% of regional revenue through its 32 million active wearer base, high per-capita lens spending driven by premium product mix concentration, and well-developed online retail infrastructure whose subscription models generate above-average purchase frequency. Canada contributes supplementary demand through its regulated contact lens prescribing framework, its growing online lens purchasing adoption, and the commercial presence of major international optical retail chains in its urban centres whose professional contact lens fitting services support high-quality product adoption.
The National Eye Institute reports that over 40% of Americans are myopic, with rapidly increasing prevalence among children and adolescents due to changing visual habits and environmental factors.
According to the Pew Research Center, about 90% of U.S. adults use smartphones, contributing to rising screen exposure, digital eye strain, and growing demand for corrective lenses and vision care solutions.
Get Customized Report as Per Your Business Requirement - Enquiry Now
Europe Contact Lens Market Insights
Europe held approximately 24.73% of global Contact Lens revenues in 2025. Germany, the United Kingdom, France, Italy, and the Netherlands are the leading national markets, each operating well-developed eye care infrastructure with high contact lens wearing rates among the working-age adult population. European regulatory requirements for contact lens prescription and supply through registered eye care practitioners sustain the practitioner dispensing channel's commercial relevance while online retail penetration grows within the boundaries that prescription release regulations permit.
The European Council of Optometry and Optics reports that over 60% of Europeans require vision correction such as glasses or contact lenses, reflecting widespread refractive error and growing dependence on optical correction solutions.
The European Agency for Safety and Health at Work notes that more than 70% of workers spend significant time on digital screens, increasing digital eye strain and driving higher demand for corrective eyewear and vision care products.
Asia Pacific Contact Lens Market Insights
Asia Pacific is the fastest-growing regional Contact Lens market, projected to expand at a CAGR of approximately 6.14% through 2035. China accounts for approximately 38.47% of Asia Pacific revenues through its enormous population base, one of the world's highest myopia prevalence rates, and a rapidly growing middle-class consumer segment whose disposable income is increasingly directed toward premium vision correction and cosmetic contact lens products. Japan, South Korea, Taiwan, and Australia contribute significant regional demand.
According to the World Health Organization, more than 50% of the global population is expected to be myopic by 2050, with Asia identified as the fastest-growing region due to rapid digitalization and changing lifestyle patterns.
China’s National Health Commission reports myopia prevalence exceeding 50% among primary school students, rising to 80–90% in urban high school populations, reflecting a severe and early-onset vision health burde . India’s Ministry of Health and Family Welfare estimates that over 55 million people experience vision impairment, driven largely by increasing refractive errors and growing screen exposure across the population
MEA & Latin America Contact Lens Market Insights
Middle East and Latin America are growing Contact Lens markets where expanding urban middle-class populations, rising vision care awareness, and growing organised optical retail infrastructure are progressively building addressable commercial demand. The UAE leads MEA revenues at approximately 22.84% of the regional total through its high-income expatriate population, advanced private healthcare infrastructure, and commercial presence of international optical retail chains whose optical departments provide professional contact lens fitting services aligned with international standards.
According to the World Health Organization, at least 2.2 billion people globally live with vision impairment, with a significant proportion in low- and middle-income regions including Africa and parts of the Middle East, highlighting a substantial global eye health burden.
In Latin America, urbanization, rising vision disorders, and expanding optical retail access are driving steady contact lens adoption across urban populations. The Pan American Health Organization reports over 300 million people in the Americas live with vision impairment, increasing demand for vision care services.
Market Dynamics
Growth Drivers: Global myopia growth and silicone hydrogel adoption driving strong contact lens market expansion worldwide.
The WHO has identified myopia as a global public health priority whose prevalence is projected to affect approximately 50% of the world's population by 2050, up from approximately 30% in 2020. This epidemiological trajectory creates a structurally self-expanding contact lens addressable market as new myopic patients are generated annually at rates that substantially exceed the natural demographic growth of the global wearer population. Daily disposable silicone hydrogel lenses are simultaneously driving value growth above volume growth as practitioners recommend and consumers accept premium product upgrades whose per-day wear cost, while higher than conventional schedules, is commercially justified by documented ocular health advantages and wearer comfort improvements that patient satisfaction data consistently validates.
Restraints: Lens misuse risks and rising refractive surgery competition limiting contact lens adoption across demographics.
Non-compliance with contact lens care protocols and wearing schedules is a documented clinical risk whose consequences including corneal infections, microbial keratitis, and hypoxia-related complications create negative wearer experiences that drive lens discontinuation. Industry surveys suggest that 15 to 25% of contact lens wearers discontinue lens wear within their first year, with discomfort and inconvenience cited as primary reasons. Laser refractive surgery procedures including LASIK and SMILE offer a permanent vision correction alternative whose improving safety profile, expanding clinical eligibility criteria, and declining cost is converting a proportion of active and potential contact lens wearers toward surgical correction, particularly in the 25 to 45 year adult demographic whose surgical candidacy is highest.
Opportunities: Smart lenses and pediatric myopia management creating high-value innovation opportunities in contact lens market.
Smart contact lens development is advancing toward commercialisation across multiple application categories. Biosensor lenses capable of continuously monitoring intraocular pressure for glaucoma management and blood glucose levels for diabetic patients have demonstrated proof-of-concept in academic and corporate research programmes. Drug-eluting contact lenses that provide sustained-release ocular drug delivery for conditions including glaucoma, dry eye, and allergic conjunctivitis represent a convergence of contact lens and pharmaceutical delivery technology whose regulatory approval would create a new premium product tier within the contact lens market.
Myopia management specialty lenses for children, including soft multifocal designs and orthokeratology lenses demonstrated to slow myopic progression by 40 to 60% in clinical trials, are generating rapid adoption growth among parents whose awareness of childhood myopia health consequences is increasing globally.
Recent Developments:
-
2025: Johnson and Johnson Vision launched ACUVUE OASYS MAX 1-Day MULTIFOCAL for ASTIGMATISM in June 2025, the first daily disposable lens simultaneously addressing both presbyopia and astigmatism, expanding the daily disposable segment into the dual-correction demographic that previously required more complex lens fitting solutions.
-
2024: Alcon launched PRECISION7, a one-week replacement silicone hydrogel contact lens designed to provide 16 hours of daily comfort, targeting the commercially underserved wearer segment seeking a replacement schedule between daily disposable convenience and monthly lens cost efficiency.
-
2024: CooperVision expanded commercial availability of its MiSight 1 day myopia management daily disposable lens into additional Asia Pacific and European markets, responding to growing parental and practitioner demand for clinically validated paediatric myopia control contact lens options in markets with high childhood myopia prevalence rates.
Contact Lens Market Key Players are:
-
Johnson & Johnson Vision
-
Alcon
-
CooperVision
-
Bausch + Lomb
-
Hoya Corporation
-
Carl Zeiss Meditec AG
-
Seed Co., Ltd.
-
Contamac Ltd.
-
Essilor International S.A.
-
Novartis AG
-
STAAR Surgical Company
-
SynergEyes, Inc.
-
X-Cel Specialty Contacts
-
Valeant Pharmaceuticals (Vision division)
-
Medennium
-
UltraVision CLPL
-
Menicon Co., Ltd.
-
The Cooper Companies
-
Contamac
-
ZEISS International
Contact Lens Market Report Scope:
| Report Attributes | Details |
|---|---|
| Market Size in 2025 | USD 18.88 Billion |
| Market Size by 2035 | USD 29.10 Billion |
| CAGR | CAGR of 4.42% From 2026 to 2035 |
| Base Year | 2025 |
| Forecast Period | 2026-2035 |
| Historical Data | 2022-2024 |
| Report Scope & Coverage | Market Size, Segments Analysis, Competitive Landscape, Regional Analysis, DROC & SWOT Analysis, Forecast Outlook |
| Key Segments | • By Product Type (Soft Contact Lenses, Gas Permeable Lenses, Scleral Lenses, Hybrid Lenses, Others) • By Design (Spherical, Toric, Multifocal, Others) • By Material (Hydrogel, Silicone Hydrogel, PMMA, Others) • By Usage (Daily Disposable, Weekly Replacement, Monthly Replacement, Conventional) • By Application (Corrective, Cosmetic & Aesthetic, Prosthetic, Therapeutic) • By Distribution Channel (Optical Stores, Hospitals & Clinics, Online Retail, Others) |
| Regional Analysis/Coverage | North America (US, Canada), Europe (Germany, UK, France, Italy, Spain, Russia, Poland, Rest of Europe), Asia Pacific (China, India, Japan, South Korea, Australia, ASEAN Countries, Rest of Asia Pacific), Middle East & Africa (UAE, Saudi Arabia, Qatar, South Africa, Rest of Middle East & Africa), Latin America (Brazil, Argentina, Mexico, Colombia, Rest of Latin America). |
| Company Profiles | Johnson & Johnson Vision, Alcon, CooperVision, Bausch + Lomb, Hoya Corporation, Carl Zeiss Meditec AG, Seed Co., Ltd., Contamac Ltd., Essilor International S.A., Novartis AG, STAAR Surgical Company, SynergEyes, Inc., X-Cel Specialty Contacts, Valeant Pharmaceuticals (Vision division), Medennium, UltraVision CLPL, Menicon Co., Ltd., The Cooper Companies, Contamac, ZEISS International |
Frequently Asked Questions
North America dominated the Contact Lens Market in 2025, holding approximately 38.47% of global revenues.
The corrective segment dominated the Contact Lens Market with 68.11% share in 2025.
Global myopia growth, silicone hydrogel adoption, online retail expansion, and cosmetic lens demand driving contact lens market growth.
The Contact Lens Market was valued at USD 18.88 Billion in 2025.
The Contact Lens Market is expected to grow at a CAGR of 4.42% from 2026 to 2035.
Get in Touch
