Pneumatic Components Market Report Scope & Overview:
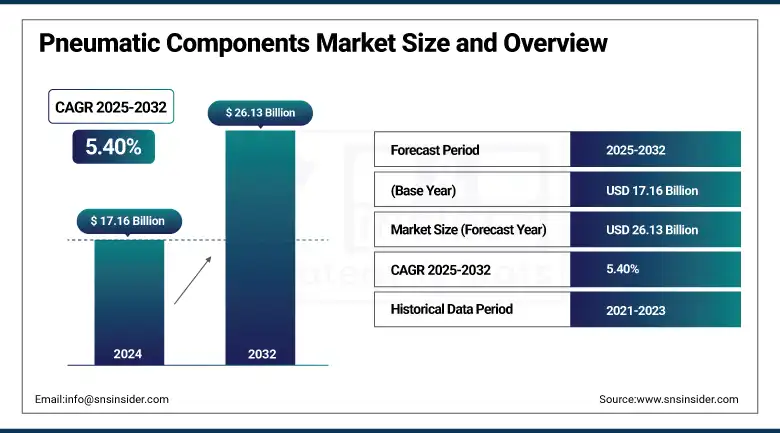
The Pneumatic Components Market size was valued at USD 17.16 billion in 2024 and is expected to reach USD 26.13 billion by 2032, growing at a CAGR of 5.40% over the forecast period of 2025-2032.
The Pneumatic Components Market is witnessing consistent growth, fueled by rising industrial automotive, food & beverage, packaging, electronics, and within the industrial automation domain, continues to drive steady growth through the Pneumatic Components market. Pneumatic systems are applauded for their simplicity, speed, and low cost, which is why pneumatic systems are widely used in motion control and material handling applications. Basic elements confirmed expanded call solution as valves, actuators, air filters, stress regulators, and lubricators that are utilized in put together traces and robotics. Smart technologies and IoT-enabled sensors for real-time monitoring, predictive maintenance, and enhanced system efficiency are noticeably becoming an Pneumatic Components Market trend for these essential operations. However, in spite of these benefits, pneumatic systems get a bad reputation for consuming high energy. Compressed air is one of the most energy-intensive utilities in manufacturing, using 6 to 10 times more energy than electric power transmission because generating compressed air involves all these processes for an equivalent output of mechanical power. In addition, according to the U.S. Department of Energy, the average compressed air system has an air leakage rate of 25% as a result of poor maintenance practices in the system, leading to a large amount of energy and cost loss. In order to mitigate this, manufacturers are now incorporating energy-efficient components with optimized system design, which is also likely to bolster the growth of the Pneumatic Components Market Growth fueled by the fact that industries are focusing on high performance along with sustainable elements.
To Get more information On Pneumatic Components Market - Request Free Sample Report
In June 2025, ATG Industry reported that the Pneumatic Components Market is being reshaped by three key trends: intelligence, miniaturization, and greening. Smart sensors and MEMS are enhancing real-time monitoring, while ultra-compact actuators and micro-valves are enabling precision in electronics and medical devices. The push for sustainability includes hydrogen-compatible systems and low-VOC components. Integration of new energy equipment has reached 35% in China’s Yangtze River Delta.
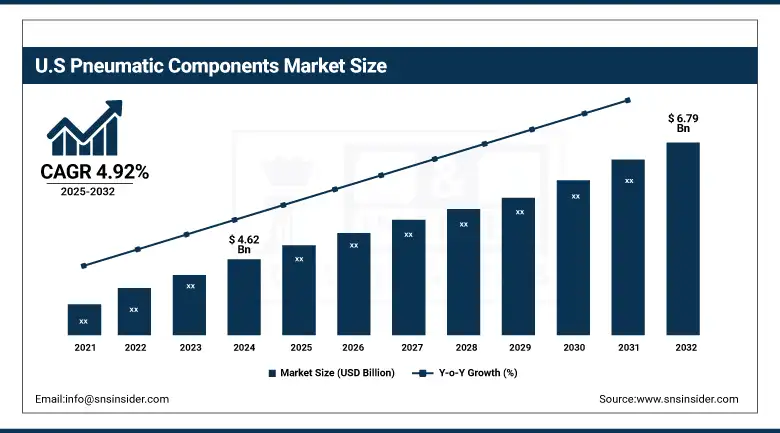
The U.S. dominates the North American pneumatic components market, valued at USD 4.62 billion in 2024 and projected to reach USD 6.79 billion by 2032, growing at a CAGR of 4.92%. Growth is driven by strong adoption in industrial automation, especially across the automotive and manufacturing sectors. Advancements in pneumatic technology and smart factory integration further support market expansion.
Pneumatic Components Market Dynamics
Drivers
-
Industrial Automation and Industry 4.0 Propel Growth of Pneumatic Components In Smart Manufacturing Ecosystem
Industrial automation has gained traction lately and is driven by the widespread adoption of Industry 4.0, emerging as a prominent growth factor for the Pneumatic Equipment Industry, making a significant impact on the Global Pneumatic Components Market. Pneumatic motion control is a crucial element in most automated processes in many fields, including automotive, packaging, electronics, and pharmaceuticals, because pneumatic systems provide a low-cost, high-speed, and reliable solution for motion control. This makes them an excellent fit for smart manufacturing environments where they can be easily integrated into programmable (POT) and modular production lines. And in fact, industry reports indicate that more than 70 percent of new automated assembly lines in Asia and Europe today utilize pneumatic actuators and valves because of their simplicity and scalability. Moreover, government-assisted smart factory projects, especially in Germany, China, and South Korea, are driving an upgrade of pneumatic systems with embedded sensors and predictive functions. This increase in automation retrofits and expansions serves to further establish pneumatic components as fundamental components in the developing smart manufacturing ecosystem.
In March 2025, Bridgestone began trials of its airless tyres in Japan for low-speed autonomous shuttles, aiming to reduce puncture-related downtime. Michelin is testing its Uptis airless tyres on delivery vans in France but warns that mass adoption is still far due to high costs and performance challenges. Both companies are focusing on reliability for autonomous and commercial fleets.
Restraint
-
High Energy Demands and Air Leakages Drive Efficiency Concerns in the Pneumatic Components Industry
The Pneumatic Components Industry is the high energy intensity of compressed air systems, which leads to significant operational inefficiencies. Providing compressed air requires 6–10 times more energy than electric power transmission for equal mechanical work, rendering compressed air one of the most energy-intensive utilities in manufacturing. Furthermore, inadequate maintenance of the system leads to high levels of air leakage. The U.S. Department of Energy (DOE) estimates that average leakage rates top 25%, with some plants losing 40% or more to leaks. It not only increases the electricity bills but also raises Scope 2 emission levels, contradicting the sustainability targets. Rising energy prices, combined with increased environmental regulations, are causing a reassessment within the Compressed Air Systems Industry as companies weigh the benefits of traditional pneumatic systems over higher efficiency electromechanical solutions.
Pneumatic Components Market Segmentation Outlook
By Product Type
The Valves segment dominated the market and accounted for 44% of the Pneumatic Components market share. They are necessary due to their importance for providing pressure and vacuum settings within cooling chambers. Demands are coming from the widespread use in food, pharmaceutical, and industrial processes. In addition to this, the continuous working and requirement of precise control also accentuates the need for highly reliable & reliable valve systems, particularly in large plants. As their reliability and seamless incorporation into existing integrations helped their dominance. However, these advanced valves are expected to maintain their leadership position as industries focus on automation and energy efficiency, and thus require advanced intelligent valves along with monitoring outside of the industrial areas.
Actuators are the fastest-growing product type in the vacuum cooling equipment market, propelled by automation trends and increasing demand for precise movement control. Due to the increased need for smart actuators to be integrated into various industries such as food processing, electronics, and manufacturing, they enhance productivity and optimize safety by upgrading their systems. This allows real-time response and integrates instantly with control systems, which enhances the whole system's performance. This is further contributed to by the Compact miniature actuator designs with high energy efficiency. Additionally, continuous evolution in vacuum systems, high demand for intelligent and programmable actuators are anticipated to surge revenues, making this segment the fastest growing in terms of innovation and revenue expansion.
By Function
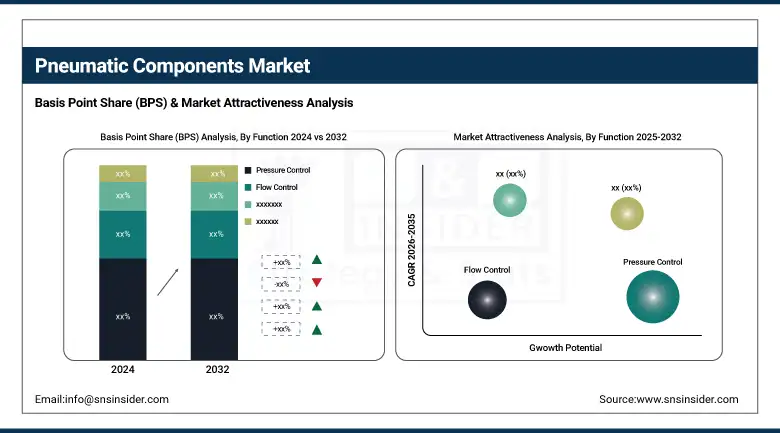
The pressure control segment dominated with a market share of over 42% in 2024. The processing of perishable products is a major concern because it requires the maintenance of vacuum levels to ensure optimal, rapid, and uniform cooling. In summary, for maintaining system safety, efficiency, and performance, pressure control components are critical. This also regulates the vacuum and is adjusted to suit the cooling load, which maintains product quality while saving on energy. Continuous vacuum environments needed in food & beverage and pharmaceuticals, among others, are driving demand for high-precision pressure control devices, making this function an operational criticality and the largest contributor to functional segmentation.
Actuation is emerging as the fastest-growing function in the vacuum cooling equipment market. This is especially because more automated and intelligent systems are being designed, requiring rapid response and mechanical movement. It allows for quick changes in the vacuum environment and the use of several coupled components, such as valves and dampers. Industries are endeavouring to improve system speeds and employing more IoT-enabled controls, causing an increasing need for pneumatic drives and smart actuators. Actuation functions encompass the growth of industrial automation and are expected to witness high growth driven by high-speed, programmable, and cost-effective operations for applicable systems, and are therefore projected to grow rapidly, while vacuum systems will also see a growth in their number of actuation functions during this period.
By Distribution Channel
Direct sales dominate the vacuum cooling equipment market distribution landscape, driven by the complexity and customization needs of vacuum systems. Direct final-user engagement allows manufacturers to propose the best solution, provide a technical consultancy, and offer post-sales support. This channel provides control over price, delivery timelines, and service quality. In particular, for large-scale industrial and food processing applications, customers require complete system design and integration, which is better handled through direct sales. With reliability and customization of the system always on top priority, OEMs have been taking this direct approach of getting to ensure their customers are retained while establishing a stronghold in the market.
Online retail is the fastest-growing distribution channel in the vacuum cooling equipment market, as digital platforms increasingly penetrate B2B sales. More recently, however, the ability to access detailed product specifications, compare models, and obtain competitive pricing has caused a shift in purchasing toward online purchasing, especially for standardized parts such as valves, fittings, and components. The online platforms enable transparency and convenience for small businesses. Moreover, an increasing number of manufacturers and third-party platforms are enhancing their digital presence and virtual consultation and technical support, which improves authenticity and extension of this channel, and subsequently, over the last few decades, it has become the fastest-growing channel of distribution.
By End Use
The food & beverage segment dominates the end-use category of the vacuum cooling equipment market due to its critical need for fast and hygienic cooling of perishable items like vegetables, bakery products, and meats. Vacuum cooling is a crucial part of modern food supply chains, as it helps maximize the shelf life under safety standards. It is one of the most widely used methods because it can process a large number of food samples and meet food safety standards. The ability of important vacuum cooling equipment to fully meet the growing needs of citizen demand for fresh, less processed, and export-standard foods, especially in Asia-Pacific and Europe, is expected to make it an unavoidable part of food processing and retain the largest end-use sector shortly.
The electronics & semiconductors sector is the fastest-growing end-use segment in the vacuum cooling equipment market, driven by the industry's demand for high-precision thermal management during manufacturing. Vacuum cooling is also employed for maintaining the integrity of components, for example, during wafer cooling, or during rapid cooling of components or materials that cannot be cooled too quickly. As electronic components are getting miniaturized, and chip intricacy is rising, regulated and contaminant-free cooling environments are becoming increasingly critical. The worldwide semiconductor industry is predicted to grow in view of the continued expansion of regions such as East Asia and North America, establishing the necessity of advanced vacuum systems and catalyzing the adoption and growth of this particular sector.
Pneumatic Components Market Regional Analysis
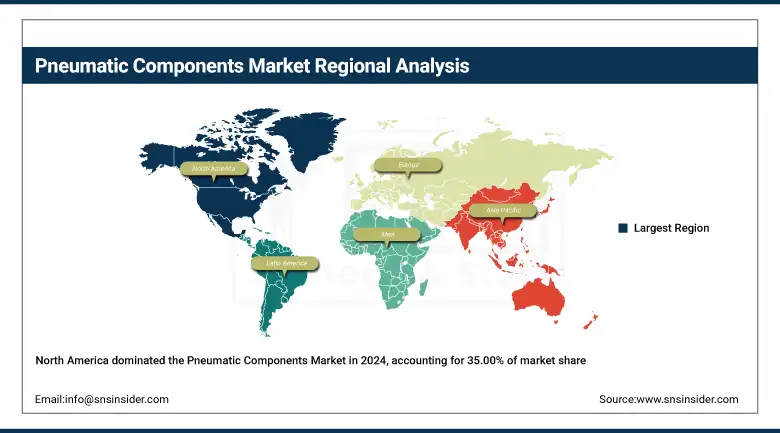
North America led the global pneumatic components market in 2024, holding a dominant 35.00% market share. This leadership is driven by the region's rich industrial base, with strength in automotive, aerospace, and food processing sectors. The demand for pneumatic valves, actuators, and control systems has surged due to the increasing adoption of automation and high market penetration of key market players, including Parker Hannifin and Emerson Electric Co. The U.S. government's efforts in promoting domestic manufacturing, as well as the efforts towards Industry 4.0, have led to the speedy implementation of pneumatic solutions across factories, warehouses, and assembly lines, ultimately helping North America maintain its leading position in the market.
Get Customized Report as per Your Business Requirement - Enquiry Now
Europe commands a substantial share of the pneumatic components market due to its well-established industrial infrastructure and strict environmental regulations. Countries Germany, Italy, and France are focusing on providing sustainable and energy-efficient pneumatic solutions. The demand for advanced pneumatic control systems has been reinforced by an increasing focus on factory automation, clean energy production, and smart production lines. In addition, the European Union has a focus on carbon footprint reduction and low-emission machinery, riding on this from the many industries that are adopting pneumatic technologies that will keep the market share in Europe quite prominent.
Asia-Pacific is the fastest-growing region in the pneumatic components market, driven by rapid industrialization, expanding manufacturing hubs, and increasing investment in automation. Pneumatic actuators, valves, and air treatment units are experiencing an increasing demand in China, India, Japan, and South Korea's automotive, electronics, packaging, and pharmaceutical industries. With government initiatives like "Make in India" and "Made in China 2025," focusing on smart and automation manufacturing, more and more growth is supported. Additionally, competitive labor costs, robust supply chain ecosystems, and infrastructure expansion are enticing regional presence from global manufacturers, further expediting market growth across this region.
China dominates the pneumatic components market in the Asia-Pacific region. Its leadership stems from a massive manufacturing base, strong government support for industrial automation under the “Made in China 2025” initiative, and the presence of numerous local and international manufacturers. China's rapid infrastructure development and rising demand in the automotive, electronics, and machinery sectors continue to drive significant growth in pneumatic solutions.
Pneumatic Components Companies are:
SMC Corporation, Festo SE & Co. KG, Parker Hannifin Corporation, Emerson Electric Co., Norgren Inc. (IMI Precision), Bosch Rexroth AG, Airtac International Group, JELPC (Ningbo Jiaerling), Zhaoqing Fangda Pneumatic Co. Ltd, Camozzi Group, CKD Corporation, Bimba Manufacturing, SMAC Moving Coil Actuators, Rotex Automation Ltd., Janatics India Pvt Ltd., Fabco-Air Inc., Metal Work Pneumatic, Univer Group, T&A Precision, Ross Controls.
Recent Development
In February 2025, Bosch Rexroth AG showcased its latest innovations at Bauma 2025, focusing on automation, electrification, and safety for Off-Highway vehicles. Key launches included the expanded eLION electrification platform, Collision Avoidance System, and MPR Performance radial piston motor. The company also unveiled advanced telematics (BODAS Connect) and compact hydraulics in collaboration with HydraForce. These solutions aim to boost efficiency, flexibility, and machine safety.
In March 2025, AirTAC hosted U.S. delegates from the Northeast and Southeast regions at its Ningbo factory to showcase its advanced manufacturing capabilities and automation. Visitors toured precision workshops and R&D labs, gaining insights into AirTAC’s 30-year growth. The visit strengthened AirTAC’s global brand image and supported its international market expansion efforts.
| Report Attributes | Details |
|---|---|
| Market Size in 2024 | USD 17.16 Billion |
| Market Size by 2032 | USD 26.13 Billion |
| CAGR | CAGR of 5.40% From 2025 to 2032 |
| Base Year | 2024 |
| Forecast Period | 2025-2032 |
| Historical Data | 2021-2023 |
| Report Scope & Coverage | Market Size, Segments Analysis, Competitive Landscape, Regional Analysis, DROC & SWOT Analysis, Forecast Outlook |
| Key Segments | • By Product Type (Valves, Actuators, Air Treatment Components, Others [Fittings & Connectors, Sensors, etc]) • By Function (Pressure Control, Flow Control, Directional Control, Actuation, Filtration & Lubrication) • By Distribution Channel (Direct Sales, Distributors/Wholesalers, Online Retail, OEMs [Original Equipment Manufacturers], System Integrators) • By End Use (Automotive, Food & Beverage, Industrial Manufacturing, Electronics & Semiconductors, Others [Construction & Mining Equipment, etc]). |
| Regional Analysis/Coverage | North America (US, Canada, Mexico), Europe (Germany, France, UK, Italy, Spain, Poland, Turkey, Rest of Europe), Asia Pacific (China, India, Japan, South Korea, Singapore, Australia, Rest of Asia Pacific), Middle East & Africa (UAE, Saudi Arabia, Qatar, South Africa, Rest of Middle East & Africa), Latin America (Brazil, Argentina, Rest of Latin America) |
| Company Profiles | SMC Corporation, Festo SE & Co. KG, Parker Hannifin Corporation, Emerson Electric Co., Norgren Inc. (IMI Precision), Bosch Rexroth AG, Airtac International Group, JELPC (Ningbo Jiaerling), Zhaoqing Fangda Pneumatic Co. Ltd, Camozzi Group, CKD Corporation, Bimba Manufacturing, SMAC Moving Coil Actuators, Rotex Automation Ltd., Janatics India Pvt Ltd., Fabco-Air Inc., Metal Work Pneumatic, Univer Group, T&A Precision, Ross Controls. |
Frequently Asked Questions
The North America region dominated the Pneumatic Components market in 2024.
The “Valves” segment dominated the Pneumatic Components market.
Industrial Automation and Industry 4.0 Propel Growth of Pneumatic Components In Smart Manufacturing Ecosystem
The Pneumatic Components market was USD 17.16 billion in 2024 and is expected to reach USD 26.13 billion by 2032.
The Pneumatic Components market is expected to grow at a CAGR of 5.40% from 2025 to 2032.
Get in Touch
