Get more information on Friction Stir Welding Equipment Market - Request Free Sample Report
The Friction Stir Welding Equipment Market Size was valued at USD 232.50 Million in 2023 and is now anticipated to grow USD 420.30 Million by 2032, displaying a compound annual growth rate (CAGR) of 6.8% during the forecast Period 2024-2032.
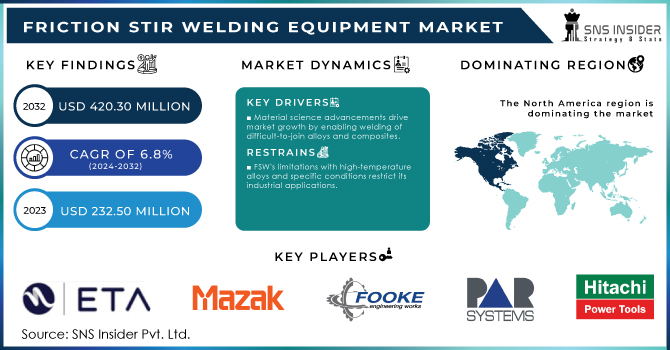
Technological advancements in FSW equipment, such as robotic and mobile systems development, are further propelling market growth. These innovations enhance the versatility and efficiency of FSW processes, making them suitable for a wide range of applications. Aluminum and its alloys experience notable volume fluctuations up to 4% while going through the melting and solidifying stages. This may lead to severe distortion of the welded parts and result in cracking during solidification due to stress. Friction stirs welding, being a mechanical process that is solid-state, does not face these issues as much and is capable of creating strong welds with minimal distortion in all types of aluminum alloys, whether they are wrought or cast.
The United States plays a crucial role in the market for friction stir welding equipment, due to its dominant position in the aerospace and automotive sectors. The use of FSW technology is being driven by the need for strong, lightweight materials in these industries. The focus of the U.S. government on promoting manufacturing and sustainable industrial practices is also contributing to market growth. Investments made in research and development, along with collaborations between industry and academia, are driving progress in FSW technology. Robotic automation systems are perfect for material handling processes because they remove human error. These systems ensure the safety of your employees by handling the responsibility of moving heavy or hazardous items within a warehouse. Employing precise precision is necessary and hazardous when bonding metal pieces using heat and pressure. Automated welding systems are increasingly chosen due to their ability to eliminate errors and improve the safety of welders. Robotic systems work together with humans for hazardous welding tasks or jobs with high levels of dangerous materials.
MARKET DYNAMICS
DRIVER
The aerospace and automotive industries are increasingly adopting Friction Stir Welding (FSW) for its ability to join dissimilar metals with high-strength, defect-free welds, driven by the need for lightweight, fuel-efficient vehicles and aircraft.
The aerospace and automotive industries are adopting Friction Stir Welding (FSW) more and more as time goes on. This is because FSW is capable of welding dissimilar metals, and the final weld produces is a high-strength weld without any defects. This is mainly because the demand of lightweight, fuel-efficient automotive and aircraft parts is increasing. Of course, not only the mentioning industries, but also the respective demands of both industries force the latter to use FSW: in aerospace the welding of aluminum and magnesium is critical to lightening up aircraft and increasing fuel efficiency, and for the automotive sector the mixed metal combinations allow better weight and performance. Both industries require welding techniques able to produce minimum distortion and no need for any filler materials. The absence of the need for fillers in the welded parts allows the parts to decrease the weight and as a significant factor of the efforts for making a greener transport, as pursuing more efficient vehicles and aircrafs.
Advancements in material science, which lead to new alloys and composites needing advanced techniques like FSW, are driving market growth by enabling the welding of materials difficult to join with conventional methods.
Advancements in welding technique offer an example of the impacts of materials science advancements on the sector. New alloys and composite materials have been developed and introduced to various industries and applications, some of which require advanced welding techniques to join. Consequently, these materials have specific properties that make them hard to weld using the conventional techniques; they are often too strong, too light, or either resistant to corrosion or temperature, or both. Friction stir welding is an example of the techniques developed for joining such materials. These industries that make use of such advanced welding techniques include those focusing on high performance such as the automotive, aerospace, and defense industries. New, high-performance materials being developed by these industries play a significant role in expanding the materials that require such advanced welding processes, increasing the demand, and the market size for the products. The materials science advancements, through the techniques developed beyond the conventional means, shape the future of the welding industry by supporting market expansions through innovation to meet the new properties offered by modern materials.
RESTRAIN
Although FSW is effective for a wide range of materials, its limitations with certain high-temperature alloys and specific welding conditions restrict its application in some industries.
There are several types of welding procedures that have demonstrated their efficiency when welding materials of most types. As a result, it is possible to argue that friction stir welding is one of the least versatile welding procedures due to the fact that it is not as effective when used for welding some alloys and at specific welding conditions. There are two distinctive groups of alloys which may require the use of the alternative welding technique. The first set includes the high-temperature alloys, such as titanium and nickel-based superalloys, which are primarily characterised by their high melting temperatures and their strength. Their strength, however, leads to increased tool wear and deformation, and reduces weld quality. The second set of factors anti-beneficial to friction stir welding process includes the factors, which require precise control of the welding processes and welding machinery. Usually, these geometrical features refer to models that are characterised by their complexity and gauge thickness. Therefore, although the use of such welding processes as FSU is beneficial in terms of the strength of the welds and their quality when welding most types of alloys, there is still a group of alloys and welding conditions, the materials and welding effects of which are subject to alternative welding procedures.
By Type
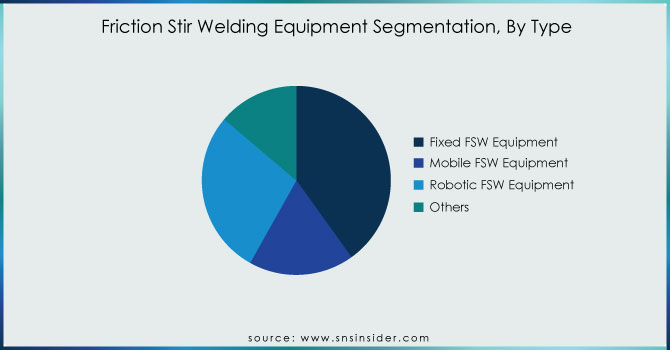
The fixed FSW equipment segment dominated the market, with a revenue share of 40.1% in 2023. This segment is primarily driven by the application of these systems in manufacturing plants. The equipment is used in the plants for the manufacturing of large and consistent welds. Majority of the plants using this equipment are high production volume oriented. The demand for this equipment is expected to grow further due to the advantages it offers in terms of producing high-quality welds.
Get Customized Report as per your Business Requirement - Request For Customized Report
By End Use
The aerospace end-use segment is projected to retain the highest share of the market. In 2023, it generated 29.9% of the overall revenue of the market. On account of its capacity to create high-strength, defect-free welds, the equipment for FSW is widely implemented in the production of different parts of airplanes, namely, fuselages, wings, and fuel tanks. Overall, the rising manufacture of commercial and military planes will be stimulating the demand for these tools in this area.
The automotive industry is another major end user of FSW equipment, utilizing the technology for welding lightweight materials such as aluminum and magnesium alloys. The growing demand for fuel-efficient and lightweight vehicles is driving the adoption of FSW in automotive manufacturing. The trend towards electric vehicles and the need for strong, lightweight battery enclosures are also expected to boost market growth
KEY REGIONAL ANALYSIS
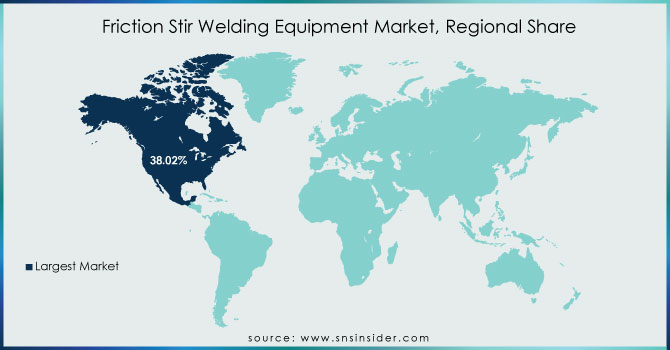
North America dominated market share over 38.02% in 2023, experiencing strong demand from the aerospace and automotive sectors. The area's cutting-edge manufacturing resources and focus on top-notch, long-lasting products play a crucial role in the acceptance of FSW technology. The U.S. and Canada are making significant investments in upgrading their manufacturing capabilities, with an emphasis on decreasing energy usage and enhancing environmental sustainability. Leading aerospace firms and demand for lightweight, fuel-efficient vehicles are projected to support the growth of the FSW equipment market in North America.
The major key players are ETA Technology, YAMAZAKI MAZAK CORPORATION, FOOKE GmbH, PAR Systems, Hitachi Power Solutions Co., Ltd., NITTO SEIKI CO., LTD., Grenzebach Group, Bond Technologies, PTG, Groupe TRA-C industrie and others.
RECENT DEVELOPMENT
In August 2023: Bond Technologies, Inc. launched PM2 Friction Stir Welding machine. The PM Series is designed for high-volume production of items such as vehicle inverters, electronic enclosures, and small parts, with manufacturing capacities ranging from thousands to millions per year. This innovative machine combines advanced process controls and data management features with a robust, user-friendly mechanical design, providing customers with a fast and reliable solution for demanding production applications.
In August 2023: Hitachi revealed their next generation of friction stir welding machines, which are more productive and precise for use in the automotive and aerospace industries. To guarantee consistent weld quality and shorten cycle times, the new equipment has sophisticated monitoring and control systems. Hitachi's commitment to offering dependable and effective solutions to the worldwide friction stir welding industry is demonstrated by its investment in technological innovation.
Report Attributes | Details |
---|---|
Market Size in 2024 | US$ 232.50 Million |
Market Size by 2032 | US$ 420.30 Million |
CAGR | CAGR of 6.8% From 2024 to 2032 |
Base Year | 2023 |
Forecast Period | 2024-2032 |
Historical Data | 2020-2022 |
Report Scope & Coverage | Market Size, Segments Analysis, Competitive Landscape, Regional Analysis, DROC & SWOT Analysis, Forecast Outlook |
Key Segments |
• By Type (Fixed FSW Equipment, Mobile FSW Equipment, Robotic FSW Equipment, Others) |
Regional Analysis/Coverage | North America (US, Canada, Mexico), Europe (Eastern Europe [Poland, Romania, Hungary, Turkey, Rest of Eastern Europe] Western Europe] Germany, France, UK, Italy, Spain, Netherlands, Switzerland, Austria, Rest of Western Europe]), Asia Pacific (China, India, Japan, South Korea, Vietnam, Singapore, Australia, Rest of Asia Pacific), Middle East & Africa (Middle East [UAE, Egypt, Saudi Arabia, Qatar, Rest of Middle East], Africa [Nigeria, South Africa, Rest of Africa], Latin America (Brazil, Argentina, Colombia, Rest of Latin America) |
Company Profiles | ETA Technology, YAMAZAKI MAZAK CORPORATION, FOOKE GmbH, PAR Systems, Hitachi Power Solutions Co., Ltd., NITTO SEIKI CO., LTD., Grenzebach Group, Bond Technologies, PTG, Groupe TRA-C industrie |
Key Drivers | • The aerospace and automotive industries are increasingly adopting Friction Stir Welding (FSW) for its ability to join dissimilar metals with high-strength, defect-free welds, driven by the need for lightweight, fuel-efficient vehicles and aircraft.
• Advancements in material science, which lead to new alloys and composites needing advanced techniques like FSW, are driving market growth by enabling the welding of materials difficult to join with conventional methods. |
RESTRAINTS | • Although FSW is effective for a wide range of materials, its limitations with certain high-temperature alloys and specific welding conditions restrict its application in some industries. |
Ans: The Friction Stir Welding Equipment Market is expected to grow at a CAGR of 6.8%.
Ans: Friction Stir Welding Equipment Market size was USD 232.50 Million in 2023 and is expected to Reach USD 420.30 Million by 2032.
Ans: The Friction Stir Welding Equipment Market is the dominating segment by type in the Friction Stir Welding Equipment Market.
Ans: The aerospace and automotive industries are increasingly adopting Friction Stir Welding (FSW) for its ability to join dissimilar metals with high-strength, defect-free welds, driven by the need for lightweight, fuel-efficient vehicles and aircraft.
Ans: North America is the dominating region in the Friction Stir Welding Equipment Market.
Table of Content
1. Introduction
1.1 Market Definition
1.2 Scope (Inclusion and Exclusions)
1.3 Research Assumptions
2. Executive Summary
2.1 Market Overview
2.2 Regional Synopsis
2.3 Competitive Summary
3. Research Methodology
3.1 Top-Down Approach
3.2 Bottom-up Approach
3.3. Data Validation
3.4 Primary Interviews
4. Market Dynamics Impact Analysis
3.1 Market Driving Factors Analysis
3.1.2 Drivers
3.1.2 Restraints
3.1.3 Opportunities
3.1.4 Challenges
3.2 PESTLE Analysis
3.3 Porter’s Five Forces Model
5. Statistical Insights and Trends Reporting
5.1 Manufacturing Output, by Region, (2020-2023)
5.2 Utilization Rates, by Region, (2020-2023)
5.3 Maintenance and Downtime Metrix
5.4 Technological Adoption Rates, by Region
5.5 Export/Import Data, by Region (2023)
6. Competitive Landscape
6.1 List of Major Companies, By Region
6.2 Market Share Analysis, By Region
6.3 Product Benchmarking
6.3.1 Product specifications and features
6.3.2 Pricing
6.4 Strategic Initiatives
6.4.1 Marketing and promotional activities
6.4.2 Distribution and Supply Chain Strategies
6.4.3 Expansion plans and new product launches
6.4.4 Strategic partnerships and collaborations
6.5 Technological Advancements
6.6 Market Positioning and Branding
7. Friction Stir Welding Equipment Market Segmentation, by Type
7.1 Chapter Overview
7.2 Fixed FSW Equipment
7.2.1 Fixed FSW Equipment Market Trends Analysis (2020-2032)
7.2.2 Fixed FSW Equipment Market Size Estimates and Forecasts to 2032 (USD Million)
7.3 Mobile FSW Equipment
7.3.1 Mobile FSW Equipment Market Trends Analysis (2020-2032)
7.3.2 Mobile FSW Equipment Market Size Estimates and Forecasts to 2032 (USD Million)
7.4 Robotic FSW Equipment
7.4.1 Robotic FSW Equipment Market Trends Analysis (2020-2032)
7.4.2 Robotic FSW Equipment Market Size Estimates and Forecasts to 2032 (USD Million)
7.5 Others
7.5.1 Others Market Trends Analysis (2020-2032)
7.5.2 Others Market Size Estimates and Forecasts to 2032 (USD Million)
8. Friction Stir Welding Equipment Market Segmentation, by End Use
8.1 Chapter Overview
8.2 Aerospace
8.2.1 Aerospace Market Trends Analysis (2020-2032)
8.2.2 Aerospace Market Size Estimates and Forecasts to 2032 (USD Million)
8.3 Automotive
8.3.1 Automotive Market Trends Analysis (2020-2032)
8.3.2 Automotive Market Size Estimates and Forecasts to 2032 (USD Million)
8.4 Shipbuilding
8.4.1 Shipbuilding Market Trends Analysis (2020-2032)
8.4.2 Shipbuilding Market Size Estimates and Forecasts to 2032 (USD Million)
8.5 Railways
8.5.1 Railways Market Trends Analysis (2020-2032)
8.5.2 Railways Market Size Estimates and Forecasts to 2032 (USD Million)
8.6 Others
8.6.1 Others Market Trends Analysis (2020-2032)
8.6.2 Others Market Size Estimates and Forecasts to 2032 (USD Million)
9. Regional Analysis
9.1 Chapter Overview
9.2 North America
9.2.1 Trends Analysis
9.2.2 North America Friction Stir Welding Equipment Market Estimates and Forecasts, by Country (2020-2032) (USD Million)
9.2.3 North America Friction Stir Welding Equipment Market Estimates and Forecasts, by Type (2020-2032) (USD Million)
9.2.4 North America Friction Stir Welding Equipment Market Estimates and Forecasts, by End-User (2020-2032) (USD Million)
9.2.5 USA
9.2.5.1 USA Friction Stir Welding Equipment Market Estimates and Forecasts, by Type (2020-2032) (USD Million)
9.2.5.2 USA Friction Stir Welding Equipment Market Estimates and Forecasts, by End-User (2020-2032) (USD Million)
9.2.6 Canada
9.2.6.1 Canada Friction Stir Welding Equipment Market Estimates and Forecasts, by Type (2020-2032) (USD Million)
9.2.6.2 Canada Friction Stir Welding Equipment Market Estimates and Forecasts, by End-User (2020-2032) (USD Million)
9.2.7 Mexico
9.2.7.1 Mexico Friction Stir Welding Equipment Market Estimates and Forecasts, by Type (2020-2032) (USD Million)
9.2.7.2 Mexico Friction Stir Welding Equipment Market Estimates and Forecasts, by End-User (2020-2032) (USD Million)
9.3 Europe
9.3.1 Eastern Europe
9.3.1.1 Trends Analysis
9.3.1.2 Eastern Europe Friction Stir Welding Equipment Market Estimates and Forecasts, by Country (2020-2032) (USD Million)
9.3.1.3 Eastern Europe Friction Stir Welding Equipment Market Estimates and Forecasts, by Type (2020-2032) (USD Million)
9.3.1.4 Eastern Europe Friction Stir Welding Equipment Market Estimates and Forecasts, by End-User (2020-2032) (USD Million)
9.3.1.5 Poland
9.3.1.5.1 Poland Friction Stir Welding Equipment Market Estimates and Forecasts, by Type (2020-2032) (USD Million)
9.3.1.5.2 Poland Friction Stir Welding Equipment Market Estimates and Forecasts, by End-User (2020-2032) (USD Million)
9.3.1.6 Romania
9.3.1.6.1 Romania Friction Stir Welding Equipment Market Estimates and Forecasts, by Type (2020-2032) (USD Million)
9.3.1.6.2 Romania Friction Stir Welding Equipment Market Estimates and Forecasts, by End-User (2020-2032) (USD Million)
9.3.1.7 Hungary
9.3.1.7.1 Hungary Friction Stir Welding Equipment Market Estimates and Forecasts, by Type (2020-2032) (USD Million)
9.3.1.7.2 Hungary Friction Stir Welding Equipment Market Estimates and Forecasts, by End-User (2020-2032) (USD Million)
9.3.1.8 Turkey
9.3.1.8.1 Turkey Friction Stir Welding Equipment Market Estimates and Forecasts, by Type (2020-2032) (USD Million)
9.3.1.8.2 Turkey Friction Stir Welding Equipment Market Estimates and Forecasts, by End-User (2020-2032) (USD Million)
9.3.1.9 Rest of Eastern Europe
9.3.1.9.1 Rest of Eastern Europe Friction Stir Welding Equipment Market Estimates and Forecasts, by Type (2020-2032) (USD Million)
9.3.1.9.2 Rest of Eastern Europe Friction Stir Welding Equipment Market Estimates and Forecasts, by End-User (2020-2032) (USD Million)
9.3.2 Western Europe
9.3.2.1 Trends Analysis
9.3.2.2 Western Europe Friction Stir Welding Equipment Market Estimates and Forecasts, by Country (2020-2032) (USD Million)
9.3.2.3 Western Europe Friction Stir Welding Equipment Market Estimates and Forecasts, by Type (2020-2032) (USD Million)
9.3.2.4 Western Europe Friction Stir Welding Equipment Market Estimates and Forecasts, by End-User (2020-2032) (USD Million)
9.3.2.5 Germany
9.3.2.5.1 Germany Friction Stir Welding Equipment Market Estimates and Forecasts, by Type (2020-2032) (USD Million)
9.3.2.5.2 Germany Friction Stir Welding Equipment Market Estimates and Forecasts, by End-User (2020-2032) (USD Million)
9.3.2.6 France
9.3.2.6.1 France Friction Stir Welding Equipment Market Estimates and Forecasts, by Type (2020-2032) (USD Million)
9.3.2.6.2 France Friction Stir Welding Equipment Market Estimates and Forecasts, by End-User (2020-2032) (USD Million)
9.3.2.7 UK
9.3.2.7.1 UK Friction Stir Welding Equipment Market Estimates and Forecasts, by Type (2020-2032) (USD Million)
9.3.2.7.2 UK Friction Stir Welding Equipment Market Estimates and Forecasts, by End-User (2020-2032) (USD Million)
9.3.2.8 Italy
9.3.2.8.1 Italy Friction Stir Welding Equipment Market Estimates and Forecasts, by Type (2020-2032) (USD Million)
9.3.2.8.2 Italy Friction Stir Welding Equipment Market Estimates and Forecasts, by End-User (2020-2032) (USD Million)
9.3.2.9 Spain
9.3.2.9.1 Spain Friction Stir Welding Equipment Market Estimates and Forecasts, by Type (2020-2032) (USD Million)
9.3.2.9.2 Spain Friction Stir Welding Equipment Market Estimates and Forecasts, by End-User (2020-2032) (USD Million)
9.3.2.10 Netherlands
9.3.2.10.1 Netherlands Friction Stir Welding Equipment Market Estimates and Forecasts, by Type (2020-2032) (USD Million)
9.3.2.10.2 Netherlands Friction Stir Welding Equipment Market Estimates and Forecasts, by End-User (2020-2032) (USD Million)
9.3.2.11 Switzerland
9.3.2.11.1 Switzerland Friction Stir Welding Equipment Market Estimates and Forecasts, by Type (2020-2032) (USD Million)
9.3.2.11.2 Switzerland Friction Stir Welding Equipment Market Estimates and Forecasts, by End-User (2020-2032) (USD Million)
9.3.2.12 Austria
9.3.2.12.1 Austria Friction Stir Welding Equipment Market Estimates and Forecasts, by Type (2020-2032) (USD Million)
9.3.2.12.2 Austria Friction Stir Welding Equipment Market Estimates and Forecasts, by End-User (2020-2032) (USD Million)
9.3.2.13 Rest of Western Europe
9.3.2.13.1 Rest of Western Europe Friction Stir Welding Equipment Market Estimates and Forecasts, by Type (2020-2032) (USD Million)
9.3.2.13.2 Rest of Western Europe Friction Stir Welding Equipment Market Estimates and Forecasts, by End-User (2020-2032) (USD Million)
9.4 Asia Pacific
9.4.1 Trends Analysis
9.4.2 Asia Pacific Friction Stir Welding Equipment Market Estimates and Forecasts, by Country (2020-2032) (USD Million)
9.4.3 Asia Pacific Friction Stir Welding Equipment Market Estimates and Forecasts, by Type (2020-2032) (USD Million)
9.4.4 Asia Pacific Friction Stir Welding Equipment Market Estimates and Forecasts, by End-User (2020-2032) (USD Million)
9.4.5 China
9.4.5.1 China Friction Stir Welding Equipment Market Estimates and Forecasts, by Type (2020-2032) (USD Million)
9.4.5.2 China Friction Stir Welding Equipment Market Estimates and Forecasts, by End-User (2020-2032) (USD Million)
9.4.6 India
9.4.5.1 India Friction Stir Welding Equipment Market Estimates and Forecasts, by Type (2020-2032) (USD Million)
9.4.5.2 India Friction Stir Welding Equipment Market Estimates and Forecasts, by End-User (2020-2032) (USD Million)
9.4.5 Japan
9.4.5.1 Japan Friction Stir Welding Equipment Market Estimates and Forecasts, by Type (2020-2032) (USD Million)
9.4.5.2 Japan Friction Stir Welding Equipment Market Estimates and Forecasts, by End-User (2020-2032) (USD Million)
9.4.6 South Korea
9.4.6.1 South Korea Friction Stir Welding Equipment Market Estimates and Forecasts, by Type (2020-2032) (USD Million)
9.4.6.2 South Korea Friction Stir Welding Equipment Market Estimates and Forecasts, by End-User (2020-2032) (USD Million)
9.4.7 Vietnam
9.4.7.1 Vietnam Friction Stir Welding Equipment Market Estimates and Forecasts, by Type (2020-2032) (USD Million)
9.2.7.2 Vietnam Friction Stir Welding Equipment Market Estimates and Forecasts, by End-User (2020-2032) (USD Million)
9.4.8 Singapore
9.4.8.1 Singapore Friction Stir Welding Equipment Market Estimates and Forecasts, by Type (2020-2032) (USD Million)
9.4.8.2 Singapore Friction Stir Welding Equipment Market Estimates and Forecasts, by End-User (2020-2032) (USD Million)
9.4.9 Australia
9.4.9.1 Australia Friction Stir Welding Equipment Market Estimates and Forecasts, by Type (2020-2032) (USD Million)
9.4.9.2 Australia Friction Stir Welding Equipment Market Estimates and Forecasts, by End-User (2020-2032) (USD Million)
9.4.10 Rest of Asia Pacific
9.4.10.1 Rest of Asia Pacific Friction Stir Welding Equipment Market Estimates and Forecasts, by Type (2020-2032) (USD Million)
9.4.10.2 Rest of Asia Pacific Friction Stir Welding Equipment Market Estimates and Forecasts, by End-User (2020-2032) (USD Million)
9.5 Middle East and Africa
9.5.1 Middle East
9.5.1.1 Trends Analysis
9.5.1.2 Middle East Friction Stir Welding Equipment Market Estimates and Forecasts, by Country (2020-2032) (USD Million)
9.5.1.3 Middle East Friction Stir Welding Equipment Market Estimates and Forecasts, by Type (2020-2032) (USD Million)
9.5.1.4 Middle East Friction Stir Welding Equipment Market Estimates and Forecasts, by End-User (2020-2032) (USD Million)
9.5.1.5 UAE
9.5.1.5.1 UAE Friction Stir Welding Equipment Market Estimates and Forecasts, by Type (2020-2032) (USD Million)
9.5.1.5.2 UAE Friction Stir Welding Equipment Market Estimates and Forecasts, by End-User (2020-2032) (USD Million)
9.5.1.6 Egypt
9.5.1.6.1 Egypt Friction Stir Welding Equipment Market Estimates and Forecasts, by Type (2020-2032) (USD Million)
9.5.1.6.2 Egypt Friction Stir Welding Equipment Market Estimates and Forecasts, by End-User (2020-2032) (USD Million)
9.5.1.7 Saudi Arabia
9.5.1.7.1 Saudi Arabia Friction Stir Welding Equipment Market Estimates and Forecasts, by Type (2020-2032) (USD Million)
9.5.1.7.2 Saudi Arabia Friction Stir Welding Equipment Market Estimates and Forecasts, by End-User (2020-2032) (USD Million)
9.5.1.8 Qatar
9.5.1.8.1 Qatar Friction Stir Welding Equipment Market Estimates and Forecasts, by Type (2020-2032) (USD Million)
9.5.1.8.2 Qatar Friction Stir Welding Equipment Market Estimates and Forecasts, by End-User (2020-2032) (USD Million)
9.5.1.9 Rest of Middle East
9.5.1.9.1 Rest of Middle East Friction Stir Welding Equipment Market Estimates and Forecasts, by Type (2020-2032) (USD Million)
9.5.1.9.2 Rest of Middle East Friction Stir Welding Equipment Market Estimates and Forecasts, by End-User (2020-2032) (USD Million)
9.5.2 Africa
9.5.2.1 Trends Analysis
9.5.2.2 Africa Friction Stir Welding Equipment Market Estimates and Forecasts, by Country (2020-2032) (USD Million)
9.5.2.3 Africa Friction Stir Welding Equipment Market Estimates and Forecasts, by Type (2020-2032) (USD Million)
9.5.2.4 Africa Friction Stir Welding Equipment Market Estimates and Forecasts, by End-User (2020-2032) (USD Million)
9.5.2.5 South Africa
9.5.2.5.1 South Africa Friction Stir Welding Equipment Market Estimates and Forecasts, by Type (2020-2032) (USD Million)
9.5.2.5.2 South Africa Friction Stir Welding Equipment Market Estimates and Forecasts, by End-User (2020-2032) (USD Million)
9.5.2.6 Nigeria
9.5.2.6.1 Nigeria Friction Stir Welding Equipment Market Estimates and Forecasts, by Type (2020-2032) (USD Million)
9.5.2.6.2 Nigeria Friction Stir Welding Equipment Market Estimates and Forecasts, by End-User (2020-2032) (USD Million)
9.6 Latin America
9.6.1 Trends Analysis
9.6.2 Latin America Friction Stir Welding Equipment Market Estimates and Forecasts, by Country (2020-2032) (USD Million)
9.6.3 Latin America Friction Stir Welding Equipment Market Estimates and Forecasts, by Type (2020-2032) (USD Million)
9.6.4 Latin America Friction Stir Welding Equipment Market Estimates and Forecasts, by End-User (2020-2032) (USD Million)
9.6.5 Brazil
9.6.5.1 Brazil Friction Stir Welding Equipment Market Estimates and Forecasts, by Type (2020-2032) (USD Million)
9.6.5.2 Brazil Friction Stir Welding Equipment Market Estimates and Forecasts, by End-User (2020-2032) (USD Million)
9.6.6 Argentina
9.6.6.1 Argentina Friction Stir Welding Equipment Market Estimates and Forecasts, by Type (2020-2032) (USD Million)
9.6.6.2 Argentina Friction Stir Welding Equipment Market Estimates and Forecasts, by End-User (2020-2032) (USD Million)
9.6.7 Colombia
9.6.7.1 Colombia Friction Stir Welding Equipment Market Estimates and Forecasts, by Type (2020-2032) (USD Million)
9.6.7.2 Colombia Friction Stir Welding Equipment Market Estimates and Forecasts, by End-User (2020-2032) (USD Million)
9.6.8 Rest of Latin America
9.6.8.1 Rest of Latin America Friction Stir Welding Equipment Market Estimates and Forecasts, by Type (2020-2032) (USD Million)
9.6.8.2 Rest of Latin America Friction Stir Welding Equipment Market Estimates and Forecasts, by End-User (2020-2032) (USD Million)
11. Company Profiles
11.1 ETA Technology
11.1.1 Company Overview
11.1.2 Financial
11.1.3 Products/ Services Offered
11.1.4 SWOT Analysis
11.2 YAMAZAKI MAZAK CORPORATION
11.2.1 Company Overview
11.2.2 Financial
11.2.3 Products/ Services Offered
11.2.4 SWOT Analysis
11.3 FOOKE GmbH
11.3.1 Company Overview
11.3.2 Financial
11.3.3 Products/ Services Offered
11.3.4 SWOT Analysis
11.4 PAR Systems
11.4.1 Company Overview
11.4.2 Financial
11.4.3 Products/ Services Offered
11.4.4 SWOT Analysis
11.5 Hitachi Power Solutions Co., Ltd.
11.5.1 Company Overview
11.5.2 Financial
11.5.3 Products/ Services Offered
11.5.4 SWOT Analysis
11.6 NITTO SEIKI CO., LTD.
11.6.1 Company Overview
11.6.2 Financial
11.6.3 Products/ Services Offered
11.6.4 SWOT Analysis
11.7 Grenzebach Group
11.7.1 Company Overview
11.7.2 Financial
11.7.3 Products/ Services Offered
11.7.4 SWOT Analysis
11.8 Bond Technologies
11.8.1 Company Overview
11.8.2 Financial
11.8.3 Products/ Services Offered
11.8.4 SWOT Analysis
11.9 PTG
11.9.1 Company Overview
11.9.2 Financial
11.9.3 Products/ Services Offered
11.9.4 SWOT Analysis
11.10 Groupe TRA-C industrie
11.10.1 Company Overview
11.10.2 Financial
11.10.3 Products/ Services Offered
11.10.4 SWOT Analysis
An accurate research report requires proper strategizing as well as implementation. There are multiple factors involved in the completion of good and accurate research report and selecting the best methodology to compete the research is the toughest part. Since the research reports we provide play a crucial role in any company’s decision-making process, therefore we at SNS Insider always believe that we should choose the best method which gives us results closer to reality. This allows us to reach at a stage wherein we can provide our clients best and accurate investment to output ratio.
Each report that we prepare takes a timeframe of 350-400 business hours for production. Starting from the selection of titles through a couple of in-depth brain storming session to the final QC process before uploading our titles on our website we dedicate around 350 working hours. The titles are selected based on their current market cap and the foreseen CAGR and growth.
The 5 steps process:
Step 1: Secondary Research:
Secondary Research or Desk Research is as the name suggests is a research process wherein, we collect data through the readily available information. In this process we use various paid and unpaid databases which our team has access to and gather data through the same. This includes examining of listed companies’ annual reports, Journals, SEC filling etc. Apart from this our team has access to various associations across the globe across different industries. Lastly, we have exchange relationships with various university as well as individual libraries.
Step 2: Primary Research
When we talk about primary research, it is a type of study in which the researchers collect relevant data samples directly, rather than relying on previously collected data. This type of research is focused on gaining content specific facts that can be sued to solve specific problems. Since the collected data is fresh and first hand therefore it makes the study more accurate and genuine.
We at SNS Insider have divided Primary Research into 2 parts.
Part 1 wherein we interview the KOLs of major players as well as the upcoming ones across various geographic regions. This allows us to have their view over the market scenario and acts as an important tool to come closer to the accurate market numbers. As many as 45 paid and unpaid primary interviews are taken from both the demand and supply side of the industry to make sure we land at an accurate judgement and analysis of the market.
This step involves the triangulation of data wherein our team analyses the interview transcripts, online survey responses and observation of on filed participants. The below mentioned chart should give a better understanding of the part 1 of the primary interview.
Part 2: In this part of primary research the data collected via secondary research and the part 1 of the primary research is validated with the interviews from individual consultants and subject matter experts.
Consultants are those set of people who have at least 12 years of experience and expertise within the industry whereas Subject Matter Experts are those with at least 15 years of experience behind their back within the same space. The data with the help of two main processes i.e., FGDs (Focused Group Discussions) and IDs (Individual Discussions). This gives us a 3rd party nonbiased primary view of the market scenario making it a more dependable one while collation of the data pointers.
Step 3: Data Bank Validation
Once all the information is collected via primary and secondary sources, we run that information for data validation. At our intelligence centre our research heads track a lot of information related to the market which includes the quarterly reports, the daily stock prices, and other relevant information. Our data bank server gets updated every fortnight and that is how the information which we collected using our primary and secondary information is revalidated in real time.
Step 4: QA/QC Process
After all the data collection and validation our team does a final level of quality check and quality assurance to get rid of any unwanted or undesired mistakes. This might include but not limited to getting rid of the any typos, duplication of numbers or missing of any important information. The people involved in this process include technical content writers, research heads and graphics people. Once this process is completed the title gets uploader on our platform for our clients to read it.
Step 5: Final QC/QA Process:
This is the last process and comes when the client has ordered the study. In this process a final QA/QC is done before the study is emailed to the client. Since we believe in giving our clients a good experience of our research studies, therefore, to make sure that we do not lack at our end in any way humanly possible we do a final round of quality check and then dispatch the study to the client.
Key Segments
By Type
Fixed FSW Equipment
Mobile FSW Equipment
Robotic FSW Equipment
Others
By End Use
Aerospace
Automotive
Shipbuilding
Railways
Others
Request for Segment Customization as per your Business Requirement: Segment Customization Request
Regional Coverage
North America
US
Canada
Mexico
Europe
Eastern Europe
Poland
Romania
Hungary
Turkey
Rest of Eastern Europe
Western Europe
Germany
France
UK
Italy
Spain
Netherlands
Switzerland
Austria
Rest of Western Europe
Asia Pacific
China
India
Japan
South Korea
Vietnam
Singapore
Australia
Rest of Asia Pacific
Middle East & Africa
Middle East
UAE
Egypt
Saudi Arabia
Qatar
Rest of the Middle East
Africa
Nigeria
South Africa
Rest of Africa
Latin America
Brazil
Argentina
Colombia
Rest of Latin America
Request for Country Level Research Report: Country Level Customization Request
Available Customization
With the given market data, SNS Insider offers customization as per the company’s specific needs. The following customization options are available for the report:
Product Analysis
Criss-Cross segment analysis (e.g. Product X Application)
Product Matrix which gives a detailed comparison of product portfolio of each company
Geographic Analysis
Additional countries in any of the regions
Company Information
Detailed analysis and profiling of additional market players (Up to five)
CNC Tool & Cutter Grinding Machine Market size was valued at USD 4.26 Bn in 2023 and is expected to reach USD 6.13 Bn by 2031 With a growing CAGR of 4.63 % over the forecast period 2024-2031.
The Mining Drill Bits Market Size was valued at USD 1.76 Bn in 2023 and is expected to reach USD 2.86 Bn by 2032 with a growing CAGR of 5.56 % over the forecast period 2024-2032.
The CNC Machine Tools Market size was valued at USD 95.29 Billion in 2023. It is expected to grow to USD 141.61 Billion by 2032 and grow at a CAGR of 4.5% over the forecast period of 2024-2032.
The Telehandler Market size was valued at USD 6.75 Billion in 2023 and will reach to USD 10.67 Billion by 2031, displaying a CAGR of 5.9% by 2024-2031
Actuators Market size was valued at USD 62.89 Bn in 2023 and is expected to reach at USD 108.7 Bn by 2031 and grow at a CAGR of 7.08 % over the forecast period 2024-2031.
The Ozone Generator Market size was valued at USD 1.26 Billion in 2023 and is expected to grow at USD 2.27 Billion By 2032 with a growing CAGR of 6.8% over the forecast period of 2024-2032.
Hi! Click one of our member below to chat on Phone