Get More Information on Safety Switches Market - Request Sample Report
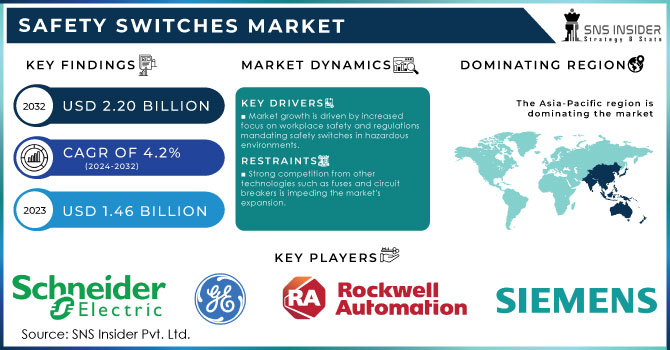
The Safety Switches Market size was valued at USD 1.46 Billion in 2023 and is now anticipated to grow to USD 2.20 Billion by 2032, displaying a compound annual growth rate CAGR of 4.2% during the forecast Period 2024-2032.
The safety switches market is driven by need of safe working environment and these switches are essential for ensuring worker safety and productivity in hazardous environments. The safety switches market is expected to experience growth because increased usage of automation solutions in hazardous industrial environments. The driving factor for the demand of safety switches is because of increase in fire accidents at a global scale. Operator safety is of paramount priority & these switches are providing the necessary level of protection. Safety switches are important in the automated production sector. The market for safety switches will grow in the coming years because of rising energy efficiency practices. In spite of that, demand for safety switches is still growing due to the increasing popularity of electric vehicles, which has led to the installation of EV charging stations worldwide along with safety switches intact. All these factors are helping in the growth of the safety switches market.
Emergency stop switches, also referred to as E-stop switches, are growing in significance in all equipment and manufacturing machinery due to the rising importance of machine safety and operator protection. A variety of electrical devices have designated switch controls to carry out emergency shutdowns in accordance with established regulatory standards for workplace safety. Businesses have been incorporating emergency stop safety switches within their premises to safeguard their expensive equipment and avoid disruptions in production and machinery. The demand for emergency stops switches to ensure equipment safety is expected to grow, driving the growth of the worldwide market for emergency stop safety switches in the forecast period.
Furthermore, the implementation of safety switches is motivated by incidents involving workers in commercial buildings or factories. The ILO projects that over 2.4 million individuals succumb annually due to work-related illnesses or accidents, equivalent to approximately 6000 deaths daily.
MARKET DYNAMICS
DRIVERS
The market is being driven towards growth due to the increased emphasis on workplace safety and regulations requiring the mandatory use of safety switches in different infrastructures and hazardous environments.
Heightened awareness and regulatory requirements for workplace safety are driving strong growth in the safety switches market. Governments and regulatory agencies globally are implementing strict guidelines to guarantee safer work environments, especially in settings with elevated risk factors like factories, chemical plants, and building sites. These rules frequently require safety switches to be installed in order to avoid accidents and safeguard workers from electrical dangers. Industries are required to follow regulations like the Occupational Safety and Health Administration (OSHA) standards in the U.S. or the European Union’s Machinery Directive. This mandates the installation of safety switches in important machinery to enable fast shutdown during emergencies. Businesses are forced by regulatory pressure to invest in dependable safety switch solutions, which in turn drives market expansion. The increase in demand for advanced safety switches, which provide enhanced protection and comply with changing safety regulations, is due to the focus on minimizing workplace accidents and safeguarding employees from potential harm. As a result, manufacturers are placing more emphasis on creating advanced safety switch technologies that meet both regulatory standards and improve overall workplace safety. The anticipated growth of the safety switch market is expected to persist due to regulatory-driven demand.
The increasing intricacy of industrial operations that involve developing sturdy safety switches is fueling the market's expansion.
The increasing intricacy of industrial activities is playing a major role in the expansion of the safety switch industry. Sophisticated safety measures are needed to effectively handle and reduce risks in modern industrial settings with complex machinery and processes. As industries progress, they are incorporating advanced equipment and automation technologies, creating new safety challenges. For instance, the combination of robots, fast production lines, and advanced control systems requires the creation of strong safety switches that can handle various challenging operational situations. The need for cutting-edge solutions is fueled by the requirement for safety switches that are strong, dependable, and able to function in harsh environments. Companies are putting money into R&D to develop safety switches with better features like fail-safe designs, longer operational life, and improved responsiveness. The emphasis on creating cutting-edge safety switches is in line with the requirement to tackle the intricacies of contemporary industrial activities and uphold a secure work environment. As industrial processes get increasingly complex, the demand for advanced safety solutions will drive the growth of the market, guaranteeing that safety switches adapt to face modern industrial challenges.
RESTRAIN
Strong competition from other technologies such as fuses and circuit breakers is impeding the market's expansion.
Intense competition from alternative technologies like fuses and circuit breakers poses significant challenges for the safety switches market. Fuses and circuit breakers are effective safety measures in electrical systems, ensuring dependable protection from overloads and short circuits. Due to their established effectiveness and cost-efficiency, they are extensively used in residential, commercial, and industrial settings. Fuses offer a straightforward method of safeguarding circuits by interrupting the circuit if current surpasses a set level, while circuit breakers can be easily reset, eliminating the need for replacement following a fault. Safety switches struggle to gain popularity due to the long-standing use and widespread acceptance of existing technologies. Furthermore, improvements in fuse and circuit breaker technologies, such as intelligent fuses and customizable circuit breakers, have increased their attractiveness. These advancements enhance the competitiveness of fuses and circuit breakers by providing capabilities like remote monitoring and advanced fault detection, features that safety switches may find challenging to replicate. Therefore, the dominating market presence and ongoing advancements in fuses and circuit breakers create substantial obstacles for the growth of safety switches in the market.
The significant upfront expense and intricate setup process are hindering the widespread use of safety switches.
The high initial expenses and the complicated installation process are major obstacles to the widespread use of safety switches. Safety switches, which offer better protection against electrical faults, typically require a higher initial cost in comparison with conventional safety devices such as fuses and circuit breakers. The steep price may discourage residential and commercial users from choosing this costly option, especially when more affordable alternatives exist. Moreover, the process of installing safety switches is usually more complex, necessitating specific expertise and abilities. This intricacy not only raises installation expenses but also may result in extended installation durations and greater labor costs. The problem is worsened by the necessity of having trained technicians for correct installation and setup, which makes safety switches less appealing for individuals and companies seeking simple, affordable options. Due to the high initial costs and complex installation procedures, safety switches face limitations in broader acceptance and integration in the market, hindering their growth and widespread adoption.
By Product Type
The Non-contact Safety Switch is dominating this segment in 2023, with the market share more than 62%. Because it completes or breaks the circuit without any need of conductive contacts. It can be utilized to protect personnel in dangerous regions during various activities. Non-contact safety switches are preferred because they last longer and requires less maintenance. They are also shock-proof and can sustain high vibration as well as they are tamper-proof.
By Vertical
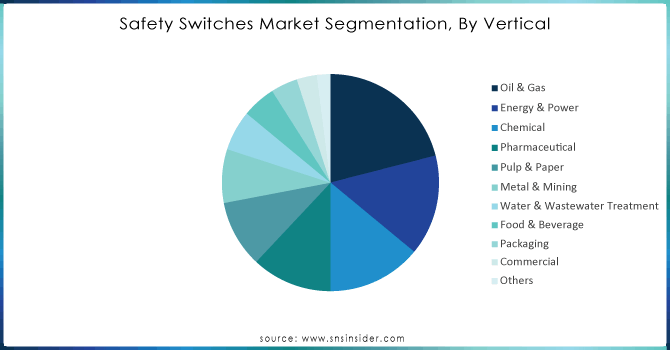
The Oil & Gas sector is dominating this segment in 2023, with the market share more than 20% because they have the ability to avoid overspill or run dry scenarios. The explosions and faults in the oil and gas sector can resulted in disastrous outcomes. The oil and gas sectors need safety switches that can detect even the tiniest amounts of liquid, preventing any costly damage, loss of services, and downtime is the reason for the dominance in this sector.
Ask for Customized Report as per Your Business Requirement - Enquiry Now
KEY REGIONAL ANALYSIS
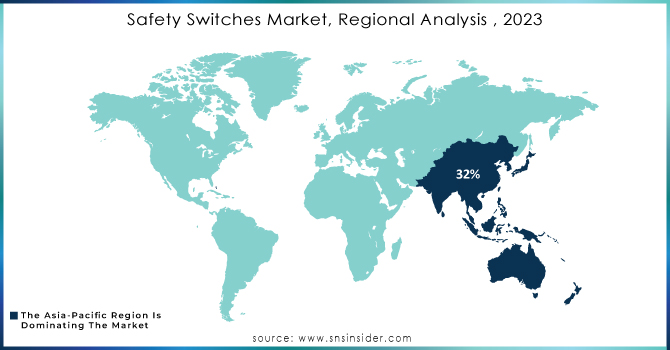
Asia-Pacific will dominate the safety switches markets in 2023, with a market share of more than 32%, because of rapid industrialization causing increasing demand for machinery and equipment which in turn is a growing demand for safety solutions such as safety switches. Also, the rising adoption of automation is making machines more complex which is ultimately demanding more safety switches in its application. Also, in order to prevent loss and damage of property or life under any circumstances government is imposing strict standards related to safety in industries and commercial places. Is thus making Asia-Pacific dominate.
North America is the fastest-growing region next to Asia-Pacific because of emerging technologies & innovation. The area is doing well because of strict safety rules, high automation, and big investments in infrastructure. The emphasis on improving workplace safety and following strict safety regulations in the U.S. and Canada is increasing the need for advanced safety switches.
The major key players are General Electric, Schneider Electric, Rockwell, Siemens, ABB, Eaton, Honeywell, Omron, Pilz, SICK and others.
Recent Developments
In June 2023: Schneider Electric released a new version of its flagship Square D safety switch offer by bringing new features and refreshed design to the trusted offering. The new VisiPacT heavy duty safety switch (30-200A) includes new standard features such as a viewing window, hook stick handle, QR code for quick access to information, and touch safe barriers.
In September 2023: Rockwell Automation, Inc. partnered with Everactive where Rockwell would combine its Dynamix product line with Everactive’s solutions. The combined solution would be used to deliver insightful data to Rockwell’s FactoryTalk Maintenance Suite which would facilitate reduced asset-related downtime and lower labor costs.
Report Attributes | Details |
---|---|
Market Size in 2023 | USD 1.46 billion |
Market Size by 2032 | USD 2.20 billion |
CAGR | CAGR of 4.2% From 2024 to 2032 |
Base Year | 2023 |
Forecast Period | 2024-2032 |
Historical Data | 2020-2022 |
Report Scope & Coverage | Market Size, Segments Analysis, Competitive Landscape, Regional Analysis, DROC & SWOT Analysis, Forecast Outlook |
Key Segments | • By Product Type (Contact Switch, Non-contact Switch) • By Safety System (Emergency Shutdown Systems, High Integrity Pressure Protection Systems, Burner Management Systems, Fire & Gas Monitoring Systems, Turbomachinery Control Systems) • By Vertical (Oil & Gas, Energy & Power, Chemical, Pharmaceutical, Pulp & Paper, Metal & Mining, Water & Wastewater Treatment, Food & Beverage, Packaging, Commercial, Others) |
Regional Analysis/Coverage | North America (US, Canada, Mexico), Europe (Eastern Europe [Poland, Romania, Hungary, Turkey, Rest of Eastern Europe] Western Europe] Germany, France, UK, Italy, Spain, Netherlands, Switzerland, Austria, Rest of Western Europe]), Asia Pacific (China, India, Japan, South Korea, Vietnam, Singapore, Australia, Rest of Asia Pacific), Middle East & Africa (Middle East [UAE, Egypt, Saudi Arabia, Qatar, Rest of Middle East], Africa [Nigeria, South Africa, Rest of Africa], Latin America (Brazil, Argentina, Colombia, Rest of Latin America) |
Company Profiles | General Electric, Schneider Electric, Rockwell, Siemens, ABB, Eaton, Honeywell, Omron, Pilz, SICK |
Key Drivers | • The market is being driven towards growth due to the increased emphasis on workplace safety and regulations requiring the mandatory use of safety switches in different infrastructures and hazardous environments. • The increasing intricacy of industrial operations that involve developing sturdy safety switches is fueling the market's expansion. |
RESTRAINTS | • Strong competition from other technologies such as fuses and circuit breakers is impeding the market's expansion. • The significant upfront expense and intricate setup process are hindering the widespread use of safety switches. |
Ans: The Safety Switches Market is expected to grow at a CAGR of 4.2%.
Ans: Safety Switches Market size was USD 1.46 Billion in 2023 and is expected to Reach USD 2.20 Billion by 2032.
Ans: The non-contact switch is the dominant segment by product type in the safety switches market.
Ans: The increasing intricacy of industrial operations that involve developing sturdy safety switches is fueling the market's expansion.
Ans: Asia-Pacific is the dominating region in the Safety Switches Market.
Table of Content
1. Introduction
1.1 Market Definition
1.2 Scope (Inclusion and Exclusions)
1.3 Research Assumptions
2. Executive Summary
2.1 Market Overview
2.2 Regional Synopsis
2.3 Competitive Summary
3. Research Methodology
3.1 Top-Down Approach
3.2 Bottom-up Approach
3.3. Data Validation
3.4 Primary Interviews
4. Market Dynamics Impact Analysis
4.1 Market Driving Factors Analysis
4.1.1 Drivers
4.1.2 Restraints
4.1.3 Opportunities
4.1.4 Challenges
4.2 PESTLE Analysis
4.3 Porter’s Five Forces Model
5. Statistical Insights and Trends Reporting
5.1 Manufacturing Output, by Region, (2020-2023)
5.2 Utilization Rates, by Region, (2020-2023)
5.3 Maintenance and Downtime Metrix
5.4 Technological Adoption Rates, by Region
5.5 Export/Import Data, by Region (2023)
6. Competitive Landscape
6.1 List of Major Companies, By Region
6.2 Market Share Analysis, By Region
6.3 Product Benchmarking
6.3.1 Product specifications and features
6.3.2 Pricing
6.4 Strategic Initiatives
6.4.1 Marketing and promotional activities
6.4.2 Distribution and Supply Chain Strategies
6.4.3 Expansion plans and new product launches
6.4.4 Strategic partnerships and collaborations
6.5 Technological Advancements
6.6 Market Positioning and Branding
7. Safety Switches Market Segmentation, By Product Type
7.1 Chapter Overview
7.2 Contact Switch
7.2.1 Contact Switch Market Trends Analysis (2020-2032)
7.2.2 Contact Switch Market Size Estimates and Forecasts to 2032 (USD Million)
7.3 Non-contact Switch
7.3.1 Non-contact Switch Market Trends Analysis (2020-2032)
7.3.2 Non-contact Switch Market Size Estimates and Forecasts to 2032 (USD Million)
8. Safety Switches Market Segmentation, By Safety System
8.1 Chapter Overview
8.2 Emergency Shutdown Systems
8.2.1 Emergency Shutdown Systems Market Trends Analysis (2020-2032)
8.2.2 Emergency Shutdown Systems Market Size Estimates and Forecasts to 2032 (USD Million)
8.3 High Integrity Pressure Protection Systems
8.3.1 High Integrity Pressure Protection Systems Market Trends Analysis (2020-2032)
8.3.2 High Integrity Pressure Protection Systems Market Size Estimates and Forecasts to 2032 (USD Million)
8.4 Burner Management Systems
8.4.1 Burner Management Systems Market Trends Analysis (2020-2032)
8.4.2 Burner Management Systems Market Size Estimates and Forecasts to 2032 (USD Million)
8.5 Fire & Gas Monitoring Systems
8.5.1 Fire & Gas Monitoring Systems Market Trends Analysis (2020-2032)
8.5.2 Fire & Gas Monitoring Systems Market Size Estimates and Forecasts to 2032 (USD Million)
8.6 Turbomachinery Control Systems
8.6.1 Turbomachinery Control Systems Market Trends Analysis (2020-2032)
8.6.2 Turbomachinery Control Systems Market Size Estimates and Forecasts to 2032 (USD Million)
9. Safety Switches Market Segmentation, By Vertical
9.1 Chapter Overview
9.2 Oil & Gas
9.2.1 Oil & Gas Market Trends Analysis (2020-2032)
9.2.2 Oil & Gas Market Size Estimates and Forecasts to 2032 (USD Million)
9.3 Energy & Power
9.3.1 Energy & Power Market Trends Analysis (2020-2032)
9.3.2 Energy & Power Market Size Estimates and Forecasts to 2032 (USD Million)
9.4 Chemical
9.4.1 Chemicals Market Trends Analysis (2020-2032)
9.4.2 Chemicals Market Size Estimates and Forecasts to 2032 (USD Million)
9.5 Pharmaceutical
9.5.1 Pharmaceutical Market Trends Analysis (2020-2032)
9.5.2 Pharmaceutical Market Size Estimates and Forecasts to 2032 (USD Million)
9.6 Pulp & Paper
9.6.1 Pulp & Paper Market Trends Analysis (2020-2032)
9.6.2 Pulp & Paper Market Size Estimates and Forecasts to 2032 (USD Million)
9.7 Metal & Mining
9.7.1 Metal & Mining Market Trends Analysis (2020-2032)
9.7.2 Metal & Mining Market Size Estimates and Forecasts to 2032 (USD Million)
9.8 Water & Wastewater Treatment
9.8.1 Water & Wastewater Treatment Market Trends Analysis (2020-2032)
9.8.2 Water & Wastewater Treatment Market Size Estimates and Forecasts to 2032 (USD Million)
9.9 Food & Beverage
9.9.1 Food & Beverage Market Trends Analysis (2020-2032)
9.9.2 Food & Beverage Market Size Estimates and Forecasts to 2032 (USD Million)
9.10 Packaging
9.10.1 Packaging Market Trends Analysis (2020-2032)
9.10.2 Packaging Market Size Estimates and Forecasts to 2032 (USD Million)
9.11 Commercial
9.11.1 Commercial Market Trends Analysis (2020-2032)
9.11.2 Commercial Market Size Estimates and Forecasts to 2032 (USD Million)
9.12 Others
9.12.1 Others Market Trends Analysis (2020-2032)
9.12.2 Others Market Size Estimates and Forecasts to 2032 (USD Million)
10. Regional Analysis
10.1 Chapter Overview
10.2 North America
10.2.1 Trends Analysis
10.2.2 North America Safety Switches Market Estimates and Forecasts, by Country (2020-2032) (USD Million)
10.2.3 North America Safety Switches Market Estimates and Forecasts, by Product Type (2020-2032) (USD Million)
10.2.4 North America Safety Switches Market Estimates and Forecasts, by Safety System (2020-2032) (USD Million)
10.2.5 North America Safety Switches Market Estimates and Forecasts, by Vertical (2020-2032) (USD Million)
10.2.6 USA
10.2.6.1 USA Safety Switches Market Estimates and Forecasts, by Product Type (2020-2032) (USD Million)
10.2.6.2 USA Safety Switches Market Estimates and Forecasts, by Safety System (2020-2032) (USD Million)
10.2.6.3 USA Safety Switches Market Estimates and Forecasts, by Vertical (2020-2032) (USD Million)
10.2.7 Canada
10.2.7.1 Canada Safety Switches Market Estimates and Forecasts, by Product Type (2020-2032) (USD Million)
10.2.7.2 Canada Safety Switches Market Estimates and Forecasts, by Safety System (2020-2032) (USD Million)
10.2.7.3 Canada Safety Switches Market Estimates and Forecasts, by Vertical (2020-2032) (USD Million)
10.2.8 Mexico
10.2.8.1 Mexico Safety Switches Market Estimates and Forecasts, by Product Type (2020-2032) (USD Million)
10.2.8.2 Mexico Safety Switches Market Estimates and Forecasts, by Safety System (2020-2032) (USD Million)
10.2.8.3 Mexico Safety Switches Market Estimates and Forecasts, by Vertical (2020-2032) (USD Million)
10.3 Europe
10.3.1 Eastern Europe
10.3.1.1 Trends Analysis
10.3.1.2 Eastern Europe Safety Switches Market Estimates and Forecasts, by Country (2020-2032) (USD Million)
10.3.1.3 Eastern Europe Safety Switches Market Estimates and Forecasts, by Product Type (2020-2032) (USD Million)
10.3.1.4 Eastern Europe Safety Switches Market Estimates and Forecasts, by Safety System (2020-2032) (USD Million)
10.3.1.5 Eastern Europe Safety Switches Market Estimates and Forecasts, by Vertical (2020-2032) (USD Million)
10.3.1.6 Poland
10.3.1.6.1 Poland Safety Switches Market Estimates and Forecasts, by Product Type (2020-2032) (USD Million)
10.3.1.6.2 Poland Safety Switches Market Estimates and Forecasts, by Safety System (2020-2032) (USD Million)
10.3.1.6.3 Poland Safety Switches Market Estimates and Forecasts, by Vertical (2020-2032) (USD Million)
10.3.1.7 Romania
10.3.1.7.1 Romania Safety Switches Market Estimates and Forecasts, by Product Type (2020-2032) (USD Million)
10.3.1.7.2 Romania Safety Switches Market Estimates and Forecasts, by Safety System (2020-2032) (USD Million)
10.3.1.7.3 Romania Safety Switches Market Estimates and Forecasts, by Vertical (2020-2032) (USD Million)
10.3.1.8 Hungary
10.3.1.8.1 Hungary Safety Switches Market Estimates and Forecasts, by Product Type (2020-2032) (USD Million)
10.3.1.8.2 Hungary Safety Switches Market Estimates and Forecasts, by Safety System (2020-2032) (USD Million)
10.3.1.8.3 Hungary Safety Switches Market Estimates and Forecasts, by Vertical (2020-2032) (USD Million)
10.3.1.9 Turkey
10.3.1.9.1 Turkey Safety Switches Market Estimates and Forecasts, by Product Type (2020-2032) (USD Million)
10.3.1.9.2 Turkey Safety Switches Market Estimates and Forecasts, by Safety System (2020-2032) (USD Million)
10.3.1.9.3 Turkey Safety Switches Market Estimates and Forecasts, by Vertical (2020-2032) (USD Million)
10.3.1.10 Rest of Eastern Europe
10.3.1.10.1 Rest of Eastern Europe Safety Switches Market Estimates and Forecasts, by Product Type (2020-2032) (USD Million)
10.3.1.10.2 Rest of Eastern Europe Safety Switches Market Estimates and Forecasts, by Safety System (2020-2032) (USD Million)
10.3.1.10.3 Rest of Eastern Europe Safety Switches Market Estimates and Forecasts, by Vertical (2020-2032) (USD Million)
10.3.2 Western Europe
10.3.2.1 Trends Analysis
10.3.2.2 Western Europe Safety Switches Market Estimates and Forecasts, by Country (2020-2032) (USD Million)
10.3.2.3 Western Europe Safety Switches Market Estimates and Forecasts, by Product Type (2020-2032) (USD Million)
10.3.2.4 Western Europe Safety Switches Market Estimates and Forecasts, by Safety System (2020-2032) (USD Million)
10.3.2.5 Western Europe Safety Switches Market Estimates and Forecasts, by Vertical (2020-2032) (USD Million)
10.3.2.6 Germany
10.3.2.6.1 Germany Safety Switches Market Estimates and Forecasts, by Product Type (2020-2032) (USD Million)
10.3.2.6.2 Germany Safety Switches Market Estimates and Forecasts, by Safety System (2020-2032) (USD Million)
10.3.2.6.3 Germany Safety Switches Market Estimates and Forecasts, by Vertical (2020-2032) (USD Million)
10.3.2.7 France
10.3.2.7.1 France Safety Switches Market Estimates and Forecasts, by Product Type (2020-2032) (USD Million)
10.3.2.7.2 France Safety Switches Market Estimates and Forecasts, by Safety System (2020-2032) (USD Million)
10.3.2.7.3 France Safety Switches Market Estimates and Forecasts, by Vertical (2020-2032) (USD Million)
10.3.2.8 UK
10.3.2.8.1 UK Safety Switches Market Estimates and Forecasts, by Product Type (2020-2032) (USD Million)
10.3.2.8.2 UK Safety Switches Market Estimates and Forecasts, by Safety System (2020-2032) (USD Million)
10.3.2.8.3 UK Safety Switches Market Estimates and Forecasts, by Vertical (2020-2032) (USD Million)
10.3.2.9 Italy
10.3.2.9.1 Italy Safety Switches Market Estimates and Forecasts, by Product Type (2020-2032) (USD Million)
10.3.2.9.2 Italy Safety Switches Market Estimates and Forecasts, by Safety System (2020-2032) (USD Million)
10.3.2.9.3 Italy Safety Switches Market Estimates and Forecasts, by Vertical (2020-2032) (USD Million)
10.3.2.10 Spain
10.3.2.10.1 Spain Safety Switches Market Estimates and Forecasts, by Product Type (2020-2032) (USD Million)
10.3.2.10.2 Spain Safety Switches Market Estimates and Forecasts, by Safety System (2020-2032) (USD Million)
10.3.2.10.3 Spain Safety Switches Market Estimates and Forecasts, by Vertical (2020-2032) (USD Million)
10.3.2.11 Netherlands
10.3.2.11.1 Netherlands Safety Switches Market Estimates and Forecasts, by Product Type (2020-2032) (USD Million)
10.3.2.11.2 Netherlands Safety Switches Market Estimates and Forecasts, by Safety System (2020-2032) (USD Million)
10.3.2.11.3 Netherlands Safety Switches Market Estimates and Forecasts, by Vertical (2020-2032) (USD Million)
10.3.2.12 Switzerland
10.3.2.12.1 Switzerland Safety Switches Market Estimates and Forecasts, by Product Type (2020-2032) (USD Million)
10.3.2.12.2 Switzerland Safety Switches Market Estimates and Forecasts, by Safety System (2020-2032) (USD Million)
10.3.2.12.3 Switzerland Safety Switches Market Estimates and Forecasts, by Vertical (2020-2032) (USD Million)
10.3.2.13 Austria
10.3.2.13.1 Austria Safety Switches Market Estimates and Forecasts, by Product Type (2020-2032) (USD Million)
10.3.2.13.2 Austria Safety Switches Market Estimates and Forecasts, by Safety System (2020-2032) (USD Million)
10.3.2.13.3 Austria Safety Switches Market Estimates and Forecasts, by Vertical (2020-2032) (USD Million)
10.3.2.14 Rest of Western Europe
10.3.2.14.1 Rest of Western Europe Safety Switches Market Estimates and Forecasts, by Product Type (2020-2032) (USD Million)
10.3.2.14.2 Rest of Western Europe Safety Switches Market Estimates and Forecasts, by Safety System (2020-2032) (USD Million)
10.3.2.14.3 Rest of Western Europe Safety Switches Market Estimates and Forecasts, by Vertical (2020-2032) (USD Million)
10.4 Asia Pacific
10.4.1 Trends Analysis
10.4.2 Asia Pacific Safety Switches Market Estimates and Forecasts, by Country (2020-2032) (USD Million)
10.4.3 Asia Pacific Safety Switches Market Estimates and Forecasts, by Product Type (2020-2032) (USD Million)
10.4.4 Asia Pacific Safety Switches Market Estimates and Forecasts, by Safety System (2020-2032) (USD Million)
10.4.5 Asia Pacific Safety Switches Market Estimates and Forecasts, by Vertical (2020-2032) (USD Million)
10.4.6 China
10.4.6.1 China Safety Switches Market Estimates and Forecasts, by Product Type (2020-2032) (USD Million)
10.4.6.2 China Safety Switches Market Estimates and Forecasts, by Safety System (2020-2032) (USD Million)
10.4.6.3 China Safety Switches Market Estimates and Forecasts, by Vertical (2020-2032) (USD Million)
10.4.7 India
10.4.7.1 India Safety Switches Market Estimates and Forecasts, by Product Type (2020-2032) (USD Million)
10.4.7.2 India Safety Switches Market Estimates and Forecasts, by Safety System (2020-2032) (USD Million)
10.4.7.3 India Safety Switches Market Estimates and Forecasts, by Vertical (2020-2032) (USD Million)
10.4.8 Japan
10.4.8.1 Japan Safety Switches Market Estimates and Forecasts, by Product Type (2020-2032) (USD Million)
10.4.8.2 Japan Safety Switches Market Estimates and Forecasts, by Safety System (2020-2032) (USD Million)
10.4.8.3 Japan Safety Switches Market Estimates and Forecasts, by Vertical (2020-2032) (USD Million)
10.4.9 South Korea
10.4.9.1 South Korea Safety Switches Market Estimates and Forecasts, by Product Type (2020-2032) (USD Million)
10.4.9.2 South Korea Safety Switches Market Estimates and Forecasts, by Safety System (2020-2032) (USD Million)
10.4.9.3 South Korea Safety Switches Market Estimates and Forecasts, by Vertical (2020-2032) (USD Million)
10.4.10 Vietnam
10.4.10.1 Vietnam Safety Switches Market Estimates and Forecasts, by Product Type (2020-2032) (USD Million)
10.4.10.2 Vietnam Safety Switches Market Estimates and Forecasts, by Safety System (2020-2032) (USD Million)
10.4.10.3 Vietnam Safety Switches Market Estimates and Forecasts, by Vertical (2020-2032) (USD Million)
10.4.11 Singapore
10.4.11.1 Singapore Safety Switches Market Estimates and Forecasts, by Product Type (2020-2032) (USD Million)
10.4.11.2 Singapore Safety Switches Market Estimates and Forecasts, by Safety System (2020-2032) (USD Million)
10.4.11.3 Singapore Safety Switches Market Estimates and Forecasts, by Vertical (2020-2032) (USD Million)
10.4.12 Australia
10.4.12.1 Australia Safety Switches Market Estimates and Forecasts, by Product Type (2020-2032) (USD Million)
10.4.12.2 Australia Safety Switches Market Estimates and Forecasts, by Safety System (2020-2032) (USD Million)
10.4.12.3 Australia Safety Switches Market Estimates and Forecasts, by Vertical (2020-2032) (USD Million)
10.4.13 Rest of Asia Pacific
10.4.13.1 Rest of Asia Pacific Safety Switches Market Estimates and Forecasts, by Product Type (2020-2032) (USD Million)
10.4.13.2 Rest of Asia Pacific Safety Switches Market Estimates and Forecasts, by Safety System (2020-2032) (USD Million)
10.4.13.3 Rest of Asia Pacific Safety Switches Market Estimates and Forecasts, by Vertical (2020-2032) (USD Million)
10.5 Middle East and Africa
10.5.1 Middle East
10.5.1.1 Trends Analysis
10.5.1.2 Middle East Safety Switches Market Estimates and Forecasts, by Country (2020-2032) (USD Million)
10.5.1.3 Middle East Safety Switches Market Estimates and Forecasts, by Product Type (2020-2032) (USD Million)
10.5.1.4 Middle East Safety Switches Market Estimates and Forecasts, by Safety System (2020-2032) (USD Million)
10.5.1.5 Middle East Safety Switches Market Estimates and Forecasts, by Vertical (2020-2032) (USD Million)
10.5.1.6 UAE
10.5.1.6.1 UAE Safety Switches Market Estimates and Forecasts, by Product Type (2020-2032) (USD Million)
10.5.1.6.2 UAE Safety Switches Market Estimates and Forecasts, by Safety System (2020-2032) (USD Million)
10.5.1.6.3 UAE Safety Switches Market Estimates and Forecasts, by Vertical (2020-2032) (USD Million)
10.5.1.7 Egypt
10.5.1.7.1 Egypt Safety Switches Market Estimates and Forecasts, by Product Type (2020-2032) (USD Million)
10.5.1.7.2 Egypt Safety Switches Market Estimates and Forecasts, by Safety System (2020-2032) (USD Million)
10.5.1.7.3 Egypt Safety Switches Market Estimates and Forecasts, by Vertical (2020-2032) (USD Million)
10.5.1.8 Saudi Arabia
10.5.1.8.1 Saudi Arabia Safety Switches Market Estimates and Forecasts, by Product Type (2020-2032) (USD Million)
10.5.1.8.2 Saudi Arabia Safety Switches Market Estimates and Forecasts, by Safety System (2020-2032) (USD Million)
10.5.1.8.3 Saudi Arabia Safety Switches Market Estimates and Forecasts, by Vertical (2020-2032) (USD Million)
10.5.1.9 Qatar
10.5.1.9.1 Qatar Safety Switches Market Estimates and Forecasts, by Product Type (2020-2032) (USD Million)
10.5.1.9.2 Qatar Safety Switches Market Estimates and Forecasts, by Safety System (2020-2032) (USD Million)
10.5.1.9.3 Qatar Safety Switches Market Estimates and Forecasts, by Vertical (2020-2032) (USD Million)
10.5.1.10 Rest of Middle East
10.5.1.10.1 Rest of Middle East Safety Switches Market Estimates and Forecasts, by Product Type (2020-2032) (USD Million)
10.5.1.10.2 Rest of Middle East Safety Switches Market Estimates and Forecasts, by Safety System (2020-2032) (USD Million)
10.5.1.10.3 Rest of Middle East Safety Switches Market Estimates and Forecasts, by Vertical (2020-2032) (USD Million)
10.5.2 Africa
10.5.2.1 Trends Analysis
10.5.2.2 Africa Safety Switches Market Estimates and Forecasts, by Country (2020-2032) (USD Million)
10.5.2.3 Africa Safety Switches Market Estimates and Forecasts, by Product Type (2020-2032) (USD Million)
10.5.2.4 Africa Safety Switches Market Estimates and Forecasts, by Safety System (2020-2032) (USD Million)
10.5.2.5 Africa Safety Switches Market Estimates and Forecasts, by Vertical (2020-2032) (USD Million)
10.5.2.6 South Africa
10.5.2.6.1 South Africa Safety Switches Market Estimates and Forecasts, by Product Type (2020-2032) (USD Million)
10.5.2.6.2 South Africa Safety Switches Market Estimates and Forecasts, by Safety System (2020-2032) (USD Million)
10.5.2.6.3 South Africa Safety Switches Market Estimates and Forecasts, by Vertical (2020-2032) (USD Million)
10.5.2.7 Nigeria
10.5.2.7.1 Nigeria Safety Switches Market Estimates and Forecasts, by Product Type (2020-2032) (USD Million)
10.5.2.7.2 Nigeria Safety Switches Market Estimates and Forecasts, by Safety System (2020-2032) (USD Million)
10.5.2.7.3 Nigeria Safety Switches Market Estimates and Forecasts, by Vertical (2020-2032) (USD Million)
10.5.2.8 Rest of Africa
10.5.2.8.1 Rest of Africa Safety Switches Market Estimates and Forecasts, by Product Type (2020-2032) (USD Million)
10.5.2.8.2 Rest of Africa Safety Switches Market Estimates and Forecasts, by Safety System (2020-2032) (USD Million)
10.5.2.8.3 Rest of Africa Safety Switches Market Estimates and Forecasts, by Vertical (2020-2032) (USD Million)
10.6 Latin America
10.6.1 Trends Analysis
10.6.2 Latin America Safety Switches Market Estimates and Forecasts, by Country (2020-2032) (USD Million)
10.6.3 Latin America Safety Switches Market Estimates and Forecasts, by Product Type (2020-2032) (USD Million)
10.6.4 Latin America Safety Switches Market Estimates and Forecasts, by Safety System (2020-2032) (USD Million)
10.6.5 Latin America Safety Switches Market Estimates and Forecasts, by Vertical (2020-2032) (USD Million)
10.6.6 Brazil
10.6.6.1 Brazil Safety Switches Market Estimates and Forecasts, by Product Type (2020-2032) (USD Million)
10.6.6.2 Brazil Safety Switches Market Estimates and Forecasts, by Safety System (2020-2032) (USD Million)
10.6.6.3 Brazil Safety Switches Market Estimates and Forecasts, by Vertical (2020-2032) (USD Million)
10.6.7 Argentina
10.6.7.1 Argentina Safety Switches Market Estimates and Forecasts, by Product Type (2020-2032) (USD Million)
10.6.7.2 Argentina Safety Switches Market Estimates and Forecasts, by Safety System (2020-2032) (USD Million)
10.6.7.3 Argentina Safety Switches Market Estimates and Forecasts, by Vertical (2020-2032) (USD Million)
10.6.8 Colombia
10.6.8.1 Colombia Safety Switches Market Estimates and Forecasts, by Product Type (2020-2032) (USD Million)
10.6.8.2 Colombia Safety Switches Market Estimates and Forecasts, by Safety System (2020-2032) (USD Million)
10.6.8.3 Colombia Safety Switches Market Estimates and Forecasts, by Vertical (2020-2032) (USD Million)
10.6.9 Rest of Latin America
10.6.9.1 Rest of Latin America Safety Switches Market Estimates and Forecasts, by Product Type (2020-2032) (USD Million)
10.6.9.2 Rest of Latin America Safety Switches Market Estimates and Forecasts, by Safety System (2020-2032) (USD Million)
10.6.9.3 Rest of Latin America Safety Switches Market Estimates and Forecasts, by Vertical (2020-2032) (USD Million)
11. Company Profiles
11.1 General Electric
11.1.1 Company Overview
11.1.2 Financial
11.1.3 Products/ Services Offered
11.1.4 SWOT Analysis
11.2 Schneider Electric
11.2.1 Company Overview
11.2.2 Financial
11.2.3 Products/ Services Offered
11.2.4 SWOT Analysis
11.3 Rockwell
11.3.1 Company Overview
11.3.2 Financial
11.3.3 Products/ Services Offered
11.3.4 SWOT Analysis
11.4 Siemens
11.4.1 Company Overview
11.4.2 Financial
11.4.3 Products/ Services Offered
11.4.4 SWOT Analysis
11.5 ABB
11.5.1 Company Overview
11.5.2 Financial
11.5.3 Products/ Services Offered
11.5.4 SWOT Analysis
11.6 Eaton
11.6.1 Company Overview
11.6.2 Financial
11.6.3 Products/ Services Offered
11.6.4 SWOT Analysis
11.7 Honeywell
11.7.1 Company Overview
11.7.2 Financial
11.7.3 Products/ Services Offered
11.7.4 SWOT Analysis
11.8 Omron
11.8.1 Company Overview
11.8.2 Financial
11.8.3 Products/ Services Offered
11.8.4 SWOT Analysis
11.9 Pilz
11.9.1 Company Overview
11.9.2 Financial
11.9.3 Products/ Services Offered
11.9.4 SWOT Analysis
11.10 SICK
11.10.1 Company Overview
11.10.2 Financial
11.10.3 Products/ Services Offered
11.10.4 SWOT Analysis
12. Use Cases and Best Practices
13. Conclusion
An accurate research report requires proper strategizing as well as implementation. There are multiple factors involved in the completion of good and accurate research report and selecting the best methodology to compete the research is the toughest part. Since the research reports we provide play a crucial role in any company’s decision-making process, therefore we at SNS Insider always believe that we should choose the best method which gives us results closer to reality. This allows us to reach at a stage wherein we can provide our clients best and accurate investment to output ratio.
Each report that we prepare takes a timeframe of 350-400 business hours for production. Starting from the selection of titles through a couple of in-depth brain storming session to the final QC process before uploading our titles on our website we dedicate around 350 working hours. The titles are selected based on their current market cap and the foreseen CAGR and growth.
The 5 steps process:
Step 1: Secondary Research:
Secondary Research or Desk Research is as the name suggests is a research process wherein, we collect data through the readily available information. In this process we use various paid and unpaid databases which our team has access to and gather data through the same. This includes examining of listed companies’ annual reports, Journals, SEC filling etc. Apart from this our team has access to various associations across the globe across different industries. Lastly, we have exchange relationships with various university as well as individual libraries.
Step 2: Primary Research
When we talk about primary research, it is a type of study in which the researchers collect relevant data samples directly, rather than relying on previously collected data. This type of research is focused on gaining content specific facts that can be sued to solve specific problems. Since the collected data is fresh and first hand therefore it makes the study more accurate and genuine.
We at SNS Insider have divided Primary Research into 2 parts.
Part 1 wherein we interview the KOLs of major players as well as the upcoming ones across various geographic regions. This allows us to have their view over the market scenario and acts as an important tool to come closer to the accurate market numbers. As many as 45 paid and unpaid primary interviews are taken from both the demand and supply side of the industry to make sure we land at an accurate judgement and analysis of the market.
This step involves the triangulation of data wherein our team analyses the interview transcripts, online survey responses and observation of on filed participants. The below mentioned chart should give a better understanding of the part 1 of the primary interview.
Part 2: In this part of primary research the data collected via secondary research and the part 1 of the primary research is validated with the interviews from individual consultants and subject matter experts.
Consultants are those set of people who have at least 12 years of experience and expertise within the industry whereas Subject Matter Experts are those with at least 15 years of experience behind their back within the same space. The data with the help of two main processes i.e., FGDs (Focused Group Discussions) and IDs (Individual Discussions). This gives us a 3rd party nonbiased primary view of the market scenario making it a more dependable one while collation of the data pointers.
Step 3: Data Bank Validation
Once all the information is collected via primary and secondary sources, we run that information for data validation. At our intelligence centre our research heads track a lot of information related to the market which includes the quarterly reports, the daily stock prices, and other relevant information. Our data bank server gets updated every fortnight and that is how the information which we collected using our primary and secondary information is revalidated in real time.
Step 4: QA/QC Process
After all the data collection and validation our team does a final level of quality check and quality assurance to get rid of any unwanted or undesired mistakes. This might include but not limited to getting rid of the any typos, duplication of numbers or missing of any important information. The people involved in this process include technical content writers, research heads and graphics people. Once this process is completed the title gets uploader on our platform for our clients to read it.
Step 5: Final QC/QA Process:
This is the last process and comes when the client has ordered the study. In this process a final QA/QC is done before the study is emailed to the client. Since we believe in giving our clients a good experience of our research studies, therefore, to make sure that we do not lack at our end in any way humanly possible we do a final round of quality check and then dispatch the study to the client.
Key Segments
By Product Type
Contact Switch
Non-contact Switch
By Safety System
Emergency Shutdown Systems
High Integrity Pressure Protection Systems
Burner Management Systems
Fire & Gas Monitoring Systems
Turbomachinery Control Systems
By Vertical
Oil & Gas
Energy & Power
Chemical
Pharmaceutical
Pulp & Paper
Metal & Mining
Water & Wastewater Treatment
Food & Beverage
Packaging
Commercial
Others
Request for Segment Customization as per your Business Requirement: Segment Customization Request
Regional Coverage
North America
US
Canada
Mexico
Europe
Eastern Europe
Poland
Romania
Hungary
Turkey
Rest of Eastern Europe
Western Europe
Germany
France
UK
Italy
Spain
Netherlands
Switzerland
Austria
Rest of Western Europe
Asia Pacific
China
India
Japan
South Korea
Vietnam
Singapore
Australia
Rest of Asia Pacific
Middle East & Africa
Middle East
UAE
Egypt
Saudi Arabia
Qatar
Rest of the Middle East
Africa
Nigeria
South Africa
Rest of Africa
Latin America
Brazil
Argentina
Colombia
Rest of Latin America
Request for Country Level Research Report: Country Level Customization Request
Available Customization
With the given market data, SNS Insider offers customization as per the company’s specific needs. The following customization options are available for the report:
Product Analysis
Criss-Cross segment analysis (e.g. Product X Application)
Product Matrix which gives a detailed comparison of product portfolio of each company
Geographic Analysis
Additional countries in any of the regions
Company Information
Detailed analysis and profiling of additional market players (Up to five)
The Air Compressor Market Size was valued at USD 24.64 Billion in 2023 and is expected to reach USD 38.62 Billion by 2032 and grow at a CAGR of 4.97% over the forecast period 2024-2032.
The Garage and Overhead Doors Market size was estimated at USD 6.98 billion in 2022 and is expected to reach USD 10.55 billion by 2030 at a CAGR of 5.3% during the forecast period of 2023-2030.
The Construction And Demolition Waste Management Market size was estimated at USD 111.20 Billion in 2022 and is expected to reach USD 163.04 Billion by 2030 at a CAGR of 4.9% during the forecast period of 2023-2030.
The Ductless Heating and cooling Systems Market Size was esteemed at USD 116.11 billion in 2023 and is supposed to arrive at USD 230.81 billion by 2031 with a growing CAGR of 8.97% over the forecast period 2024-2031.
The Tool Holder Market Size was esteemed at USD 1.23 billion in 2023 and is supposed to arrive at USD 1.87 billion by 2031 and develop at a CAGR of 5.34% over the forecast period 2024-2031.
The Palletizer Market size was USD 4.73 billion in 2023 and is expected to Reach USD 7.22 billion by 2032 and grow at a CAGR of 4.8 % over the forecast period of 2024-2032.
Hi! Click one of our member below to chat on Phone