Pool Tables Market Report Scope & Overview:
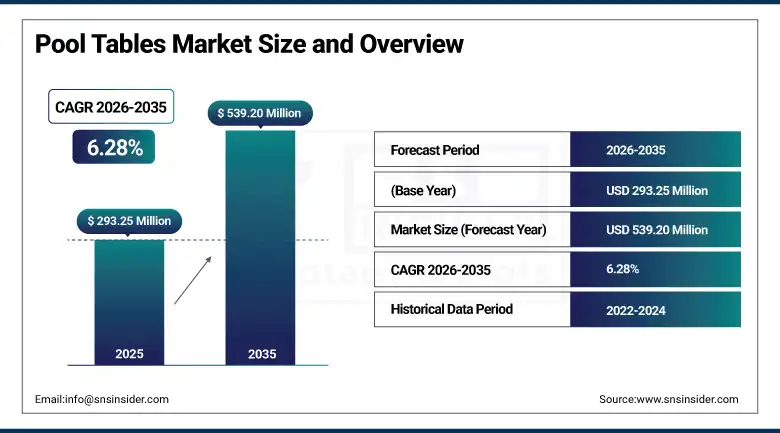
The Pool Tables Market Size is valued at USD 293.25 Million in 2025 and is projected to reach USD 539.20 Million by 2035, growing at a CAGR of 6.28% during the forecast period 2026–2035.
The Pool Tables Market analysis report presents a detailed assessment of market performance, highlighting product design innovations, material enhancements and rising recreational participation. Increasing home entertainment spending and expanding commercial gaming facilities will drive consistent demand and revenue growth throughout the forecast period.
Pool Table shipments reached 1.2 million units in 2025, driven by rising home entertainment spending and expanding commercial gaming venues.
Pool Tables Market Size and Forecast:
-
Market Size in 2025: USD 293.25 Million
-
Market Size by 2035: USD 539.20 Million
-
CAGR: 6.28% from 2026 to 2035
-
Base Year: 2025
-
Forecast Period: 2026–2035
-
Historical Data: 2022–2024
To Get more information On Pool Tables Market - Request Free Sample Report
Pool Tables Market Trends:
-
Customization and premiumization are rising, with demand for personalized table designs, unique finishes, smart features, and luxury gaming aesthetics.
-
Advanced materials such as composite slates, engineered wood, and durability-enhanced fabrics are improving performance and longevity.
-
Home entertainment boom is driving higher adoption of pool tables in residential settings, especially multifunctional and space-saving models.
-
Commercial gaming venues, sports bars, and recreational centers are increasingly upgrading to professional-grade and coin-operated pool tables.
-
Digital scorekeeping, LED lighting, and connected gaming features are gaining traction as tech integration becomes a key differentiator.
-
Interest in indoor leisure sports is growing globally, supported by rising youth participation and expanding recreational club infrastructure.
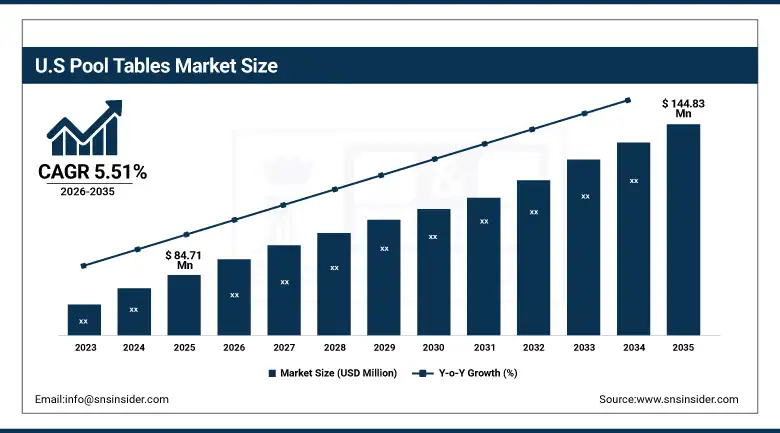
U.S. Pool Tables Market Insights:
The U.S. Pool Tables Market is projected to grow from USD 84.71 Million in 2025 to USD 144.83 Million by 2035, at a CAGR of 5.51%. Growth is driven by rising home entertainment investments, expanding recreational venues and increasing consumer preference for premium and customizable indoor leisure products.
Pool Tables Market Growth Drivers:
-
Rising investment in home entertainment and indoor leisure is accelerating demand for premium, customizable pool tables.
Expanding consumer investment in home entertainment and indoor leisure is significantly boosting demand for premium and customizable pool tables growth. With households increasingly prioritizing recreational spaces, entertainment rooms and multifunctional furniture, pool tables are becoming a preferred leisure asset. This shift is strengthened by lifestyle upgrades, higher disposable incomes and the trend toward stay-at-home entertainment. As consumers seek personalized designs, advanced materials and enhanced playability, manufacturers are experiencing growing opportunities across both residential and premium product segments.
Pool table sales increased by 6.8% in 2025, supported by strong growth in home entertainment spending and rising consumer preference for premium, customizable indoor leisure products.
Pool Tables Market Restraints:
-
High product costs, space constraints and limited suitability for small urban homes are restricting wider pool table adoption.
High product costs, space limitations and the need for dedicated installation areas significantly restrict wider adoption of pool tables. Many urban households lack adequate room for full-sized tables, reducing their feasibility despite growing interest in home entertainment. Additionally, premium materials and craftsmanship increase overall pricing, making pool tables less accessible to budget-conscious consumers. These combined challenges constrain market expansion, particularly in densely populated cities where living spaces are shrinking and multifunctional furniture is preferred over large recreational fixtures.
Pool Tables Market Opportunities:
-
Increasing demand for smart, tech-integrated gaming tables offers strong opportunities for innovative, connected pool table product development.
Increasing demand for smart, tech-integrated gaming experiences presents a significant opportunity for the Pool Tables Market. Advancements in digital scorekeeping, sensor-based shot tracking, integrated LED systems and connected gaming platforms are reshaping user expectations. Manufacturers can capitalize on this shift by developing interactive, app-enabled pool tables that enhance accuracy, engagement and social play. These innovations not only improve the playing experience but also attract younger consumers, strengthen brand differentiation and open new revenue streams across residential and commercial segments.
Smart and tech-integrated pool tables represented 19% of new product launches in 2025, fueled by rising demand for connected gaming features and digitally enhanced play experiences.
Pool Tables Market Segmentation Analysis:
-
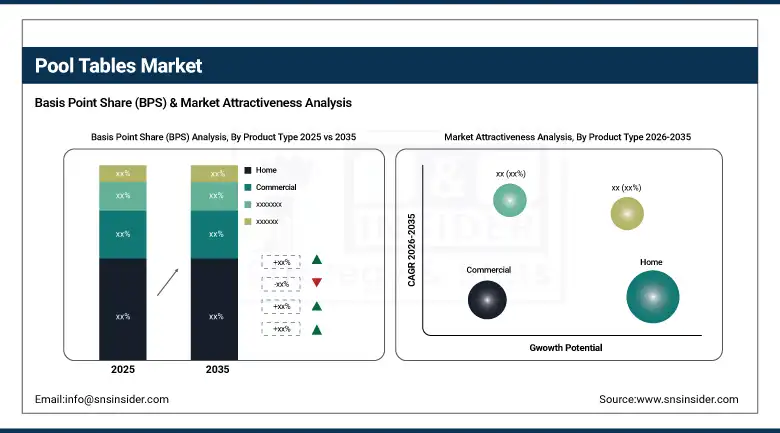
By Product Type, Home held the largest market share of 42.38% in 2025, while Commercial is expected to grow at the fastest CAGR of 7.46% during 2026–2035.
-
By Material Type, Wood accounted for the highest market share of 48.72% in 2025, while Composite is projected to expand at the fastest CAGR of 8.19% during the forecast period.
-
By Size, 8 ft dominated with a 44.56% share in 2025, while 7 ft is anticipated to record the fastest CAGR of 7.84% through 2026–2035.
-
By End User, Residential held the largest share of 51.93% in 2025, while Recreational Centers are forecasted to register the fastest CAGR of 8.37% during 2026–2035.
-
By Distribution Channel, Offline Retail accounted for the largest share of 57.61% in 2025, while Online Retail is expected to grow at the fastest CAGR of 9.12% during 2026–2035.
By Product Type, Home Dominates While Commercial Expands Rapidly:
Home segment dominated the market in 2025 due to increasing residential leisure and game room investments. Households favor high-quality, customizable tables for family entertainment and social gatherings. In 2025, over 498,000 home tables were sold, reflecting rising disposable income and lifestyle upgrades.
Commercial are the fastest growing segment, driven by bars, clubs, and entertainment centers seeking professional-grade installations. In 2025, 182,000 commercial tables were installed, highlighting strong demand from recreational venues and expansion of indoor leisure facilities.
By Material Type, Wood Dominates While Composite Expands Rapidly:
Wood segment dominated the market in 2025 due to premium finishes, classic aesthetics and long-lasting durability. Both residential and commercial buyers prefer wooden tables for their elegance and traditional craftsmanship. In 2025, more than 612,000 wooden tables were sold, making it the largest material segment.
Composite are the fastest growing segment, offering lightweight construction, easy installation and lower maintenance costs. In 2025, 158,000 composite units were shipped, showing growing popularity among consumers seeking modern, practical and durable alternatives without compromising play quality.
By Size, 8 ft Dominates While 7 ft Expands Rapidly:
8 ft segment dominated the market in 2025, balancing professional play standards with home usability. The segment is widely adopted in both homes and commercial setups. 424,000 units were shipped in 2025, making it the most preferred table size.
7 ft are the fastest growing segment, particularly in smaller homes and recreational spaces where space efficiency is critical. In 2025, 198,000 units were sold, reflecting increased interest in compact, versatile tables suitable for multi-purpose rooms and apartments.
By End User, Residential Dominates While Recreational Centers Expand Rapidly:
Residential segment dominated the market in 2025, with families and hobbyists investing in high-quality tables for personal use. Over 532,000 residential units were sold, supported by increasing home entertainment spending and leisure-focused lifestyles.
Recreational Centers are the fastest growing segment, driven by gaming lounges, sports bars and clubs upgrading to professional-quality tables. In 2025, 176,000 tables were installed in such venues, reflecting rising investment in public leisure spaces and entertainment-driven consumer engagement.
By Distribution Channel, Offline Retail Dominates While Online Retail Expands Rapidly:
Offline Retail segment dominated the market in 2025, as customers prefer showrooms for assessing table quality, craftsmanship and design. Over 624,000 tables were sold through offline channels, making it the largest distribution method.
Online Retail is the fastest growing segment, fueled by e-commerce convenience, virtual customization tools, and doorstep delivery options. In 2025, 174,000 tables were sold online, demonstrating rapid digital adoption and increasing consumer trust in purchasing high-value leisure products through online platforms.
Pool Tables Market Regional Analysis:
North America Pool Tables Market Insights:
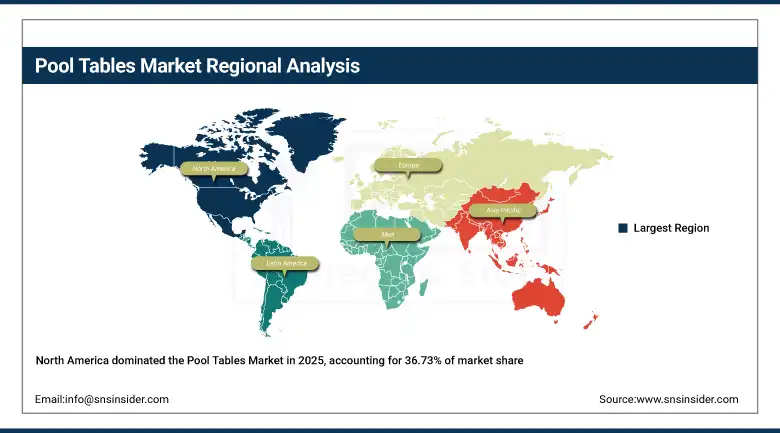
North America dominated the Pool Tables Market, accounting for a 36.73% market share in 2025. The region’s leadership is driven by high disposable incomes, growing home entertainment adoption, a strong presence of recreational clubs and commercial gaming venues. Consumers increasingly invest in premium and customizable tables, while bars and entertainment centers upgrade to professional-grade setups. Rising lifestyle-focused spending and established distribution networks further reinforce North America’s position as a key market for pool table innovation and commercialization.
Get Customized Report as per Your Business Requirement - Enquiry Now
U.S. Pool Tables Market Insights:
The U.S. Pool Tables Market is primarily driven by rising disposable income, growing interest in home entertainment and expansion of commercial gaming venues. Innovations in customizable designs, premium materials and tech-integrated tables enhance user experience, while strong recreational spending and lifestyle-focused investments reinforce the country’s position as a leading market for pool tables.
Asia-Pacific Pool Tables Market Insights:
The Asia-Pacific Pool Tables Market is the fastest-growing region, projected to expand at a CAGR of 7.76% during 2026–2035. Growth is driven by rising urban leisure spending, expanding commercial gaming centers and increasing adoption of home entertainment setups in China, India, Japan and South Korea. Strong investments in premium, customizable and tech-integrated tables, coupled with growing awareness of indoor recreational activities, reinforce Asia-Pacific’s position as the most dynamic region in the pool tables market.
China Pool Tables Market Insights:
China’s Pool Tables Market is driven by rising urban leisure spending, growing home entertainment adoption and expansion of commercial gaming centers. Increasing demand for premium, customizable and tech-integrated tables, along with investments in recreational facilities, positions China as a key growth contributor in the Asia-Pacific pool tables market.
Europe Pool Tables Market Insights:
The Europe Pool Tables Market is flourishing due to rising interest in home entertainment, expanding recreational clubs and growing commercial gaming venues. Increasing demand for premium, customizable and professional-grade tables drive market growth. Major contributions are coming from Germany, the UK, France, and Italy, supported by high disposable incomes, well-established retail networks, and strong recreational culture, making Europe a key region in the pool tables market.
Germany Pool Tables Market Insights:
Germany is a major Pool Tables market due to its strong recreational culture, high disposable income, well-established retail and leisure infrastructure. Growing interest in premium, customizable and professional-grade tables, along with expanding commercial gaming venues and home entertainment adoption, reinforces Germany’s leading position in the European pool tables market.
Latin America Pool Tables Market Insights:
The Latin America Pool Tables Market is projected to grow due to rising recreational spending, expanding commercial gaming venues and increasing home entertainment adoption in Brazil, Mexico and Argentina. Growing demand for premium, customizable and space-efficient tables, along with enhanced leisure infrastructure, is driving market growth across the region.
Middle East and Africa Pool Tables Market Insights:
The Middle East & Africa Pool Tables Market is growing due to expanding recreational and hospitality infrastructure, rising disposable incomes and increasing interest in home entertainment. Investments in premium leisure venues, tech-integrated tables and commercial gaming centers in countries such as Saudi Arabia, UAE and South Africa are driving regional market growth.
Pool Tables Market Competitive Landscape:
Brunswick Billiards, headquartered in the U.S., is a dominant player in the pool tables market, renowned for its premium quality craftsmanship and extensive product portfolio. The company offers a wide range of residential and commercial tables, combining traditional wooden designs with modern features. Brunswick leverages decades of expertise, strong distribution networks and innovative product designs to maintain market leadership. Its commitment to durability, customization and brand reputation ensures high consumer trust, supporting continued dominance across leisure and gaming markets.
- In March 2025, Brunswick launched the “Legacy Collection,” featuring customizable wooden frames, advanced slate technology, and integrated LED lighting. This premium line reinforces Brunswick’s leadership in high-end residential and commercial pool tables.
Diamond Billiard Products, based in the U.S., has established itself as a leading manufacturer of professional-grade pool tables, particularly for commercial venues and tournaments. The company is recognized for precision engineering, high-quality materials and adherence to professional play standards. By focusing on performance, durability and premium finishes, Diamond has captured both recreational and competitive markets. Strategic partnerships, innovation in table design and strong distribution allow Diamond Billiard Products to dominate the high-end segment and grow its presence.
- In June 2025, Diamond introduced the “Professional Series III,” a tournament-grade table with precision-engineered cushions, premium cloth and enhanced durability, strengthening its dominance in professional and commercial pool table markets.
Olhausen Billiards, headquartered in the U.S., is a market leader known for handcrafted, high-quality pool tables combining traditional craftsmanship with modern design innovations. The company dominates the residential and commercial segments by offering customizable tables, durable materials and aesthetic finishes. Olhausen’s strong emphasis on R&D, precision manufacturing and professional-grade standards ensures product reliability. Its focus on customer satisfaction, extensive dealer network and consistent brand reputation enables Olhausen Billiards to maintain market leadership and influence pool table trends.
- In August 2025, Olhausen unveiled the “Custom Heritage Edition,” offering fully customizable tables with premium woods, advanced finishes and precision craftsmanship, highlighting its leadership in quality, design innovation and residential-commercial customization.
Pool Tables Market Key Players:
-
Brunswick Billiards
-
Diamond Billiard Products
-
Olhausen Billiards
-
Riley England
-
Imperial International
-
American Heritage Billiards
-
Legacy Billiards
-
Gabriels Billiards
-
Blatt Billiards
-
Valley-Dynamo
-
Chevillotte Billiards
-
Rene Pierre
-
S. Billiard & Pool Table
-
EastPoint Sports
-
Presidential Billiards
-
Gold Standard Games
-
Predator Group
-
Xingpai Billiards
-
Alcocks
-
Garlando
| Report Attributes | Details |
|---|---|
| Market Size in 2025 | USD 293.25 Million |
| Market Size by 2035 | USD 539.20 Million |
| CAGR | CAGR of 6.28% From 2026 to 2035 |
| Base Year | 2025 |
| Forecast Period | 2026-2035 |
| Historical Data | 2022-2024 |
| Report Scope & Coverage | Market Size, Segments Analysis, Competitive Landscape, Regional Analysis, DROC & SWOT Analysis, Forecast Outlook |
| Key Segments | • By Product Type (Home, Commercial, Coin-Operated, Others) • By Material Type (Wood, MDF, Composite, Others) • By Size (7 ft, 8 ft, 9 ft, Others) • By End User (Residential, Commercial, Recreational Centers, Others) • By Distribution Channel (Offline Retail, Online Retail, Specialty Stores, Department Stores, Others) |
| Regional Analysis/Coverage | North America (US, Canada), Europe (Germany, UK, France, Italy, Spain, Russia, Poland, Rest of Europe), Asia Pacific (China, India, Japan, South Korea, Australia, ASEAN Countries, Rest of Asia Pacific), Middle East & Africa (UAE, Saudi Arabia, Qatar, South Africa, Rest of Middle East & Africa), Latin America (Brazil, Argentina, Mexico, Colombia, Rest of Latin America). |
| Company Profiles | Brunswick Billiards, Diamond Billiard Products, Olhausen Billiards, Riley England, Imperial International, American Heritage Billiards, Legacy Billiards, Gabriels Billiards, Blatt Billiards, Valley-Dynamo, Chevillotte Billiards, Rene Pierre, S. Billiard & Pool Table, EastPoint Sports, Presidential Billiards, Gold Standard Games, Predator Group, Xingpai Billiards, Alcocks, Garlando |
Frequently Asked Questions
The Pool Tables Market is valued at USD 293.25 million in 2025, reflecting steady demand from both residential and commercial sectors.
The market is expected to reach USD 539.20 million by 2035, indicating significant long-term growth potential.
The market is projected to grow at a CAGR of 6.28% during the forecast period from 2026 to 2035.
Key growth drivers include rising interest in indoor recreational activities, increasing home entertainment setups, and expansion of bars, clubs, and gaming lounges.
Pool tables are typically made using wood, slate, metal, and composite materials, with slate tables being preferred for professional gameplay.
Get in Touch
