Power Over Ethernet Lighting Market Report Scope & Overview:
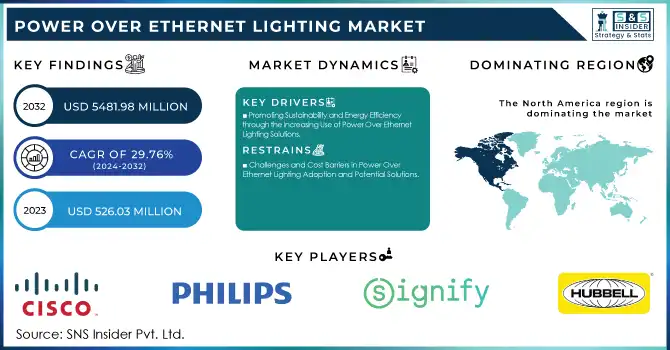
The Power Over Ethernet Lighting Market Size was valued at USD 526.03 Million in 2023 and is expected to reach USD 5481.98 Million by 2032 and grow at a CAGR of 29.76% over the forecast period 2024-2032.
Get more information on Power Over Ethernet (POE) Lighting Market - Request Sample Report
Power over Ethernet Lighting Market is changing the face of the lighting industry because it transmits electrical power and data over standard Ethernet cables. This innovation makes installation easier, cheaper, and integrates well with smart building systems, making it a preferred choice for modern infrastructures. Governments around the world are encouraging energy-efficient technologies that reduce carbon footprints. In the United States, the Department of Energy has encouraged advanced lighting systems, such as PoE, to improve the energy efficiency of buildings. In the European Union, the Green Deal focuses on the implementation of smart technologies in building infrastructures to achieve climate neutrality. All these policies have accelerated the adoption of PoE lighting systems worldwide.
The last few years have seen tremendous technological development in PoE lighting. The IoT feature enables controlling the luminaries in a centralized manner, managing energy consumption, and monitoring the lighting system in real time. In June 2022, onsemi announced two complete system solutions that support widely used building automation network protocols, namely PoE and KNX that help develop smart building systems. Significant products were released into the market in 2023 and 2024. PoE lighting solutions have now come to the fore, featuring high levels of enhanced functionality like superior energy efficiency, easier integration into building management systems, and interfaces for easier human operation. The increased demand in the commercial and industrial sectors is met through the availability of smart and automated lighting solutions.
PoE lighting seems promising to be extended towards new fields apart from its core sectors. PoE is appropriate for use in industry, hospitals, and home sectors due to the scalability and adaptability offered by the technology. The future will see increased implementation of smart building concepts, investment in smart cities, and growth in sustainable living and energy conservation, further bolstering PoE lighting systems. The Power Over Ethernet Lighting Market is experiencing very tremendous growth due to the support offered by the government, technological innovation, recent new product launches, and growing opportunities in the near future. At a time when the world is embracing smarter, more energy-efficient infrastructures, PoE lighting finds itself in a very significant position, taking this journey towards fulfilling modern lighting demands with sustainability and efficiency.
Market Dynamics
Key Drivers:
-
Promoting Sustainability and Energy Efficiency through the Increasing Use of Power Over Ethernet Lighting Solutions
Government around the globe have found an energy-efficient thrust to build. The United States Department of Energy claims LED lighting, if matched with a PoE system, can realize a reduction in up to 75% energy consumed than conventional light sources. PoE lighting systems contribute to the centralization of control and real-time energy monitoring. In 2023, government incentives such as tax credits in the U.S. for energy-efficient installations have been the main drivers for adoption.
More businesses are turning to PoE solutions to comply with environmental regulations and cut down on operational costs, which continues to drive adoption. The energy efficiency factor resonates strongly with sustainability goals, thus ensuring steady increases in adoption.
-
Power Over Ethernet Lighting Boosts IoT Integration and Promotes Innovations in Smart Building Solutions
Modern urban planning is incorporating more smart buildings that are IoT-enabled. PoE lighting systems integrate perfectly with IoT networks, offering functionalities such as motion detection, daylight harvesting, and remote management. According to a European Commission study published in 2023, 45% of new commercial buildings in Europe integrated smart lighting systems.
With the global IoT market expected to surpass USD 1 trillion by 2024, PoE lighting is perfectly placed to thrive as it complements smart infrastructure. The ability to control and analyze lighting systems through a unified IP-based network brings PoE lighting to the forefront as an indispensable component of the smart building ecosystem.
Restrain:
-
Challenges and Cost Barriers in Power Over Ethernet Lighting Adoption and Potential Solutions
Although PoE lighting saves money in the long term, its high initial investment in infrastructure and installation is an important limiting factor. As per the research, PoE systems in new installations are 20% to 30% more expensive than traditional wiring systems, mainly due to requirements for specific switches, cabling, and trained personnel for installation.
Small and medium-sized enterprises have very limited budgets, so even though they understand the benefits in the long term, adopting PoE technology may be hard for them. Also, old buildings need heavy retrofitting that is a significant problem and also increases the cost. Financial incentives or cost reduction strategies or technologies are likely to address these problems for future adoption.
Segment Analysis
By Wattage
In 2023, the "Above 25 Watt" segment led, accounting for an impressive 73% of market share. It is primarily due to the ability of high-wattage systems to support larger commercial and industrial spaces, which often require strong, consistent lighting. The "Above 25 Watt" category enjoys the use of advanced PoE technologies for high-power delivery compatibility with demanding applications such as manufacturing plants and large office buildings. Furthermore, advancements in PoE standards, such as IEEE 802.3bt, have further bolstered the growth of the segment.
The "Above 25 Watt" segment is anticipated to grow the fastest up until the year 2032 at a CAGR of 10.05% during the forecast period of 2024-2032. This rise is driven by increased investments in smart cities and large-scale infrastructure projects, especially in regions such as Asia-Pacific and North America. During the mature phase, the "Above 25 Watt" segment is likely to remain dominant and an important player that provides innovative solutions for modern lighting demands.
By Offering
Power over Ethernet Lighting Market was dominated in 2023 by the hardware segment which accounted for as much as 59% in terms of the market share. Hardware includes components such as switches, lighting, or sensors, used to implement lighting solutions based on PoE. The increasing adoption of smart lighting systems in commercial buildings and the need for energy-efficient solutions have led to the growth of the hardware segment. Technological advancements such as multi-port PoE switches and integrated LED fixtures have also added to its appeal.
In the future, the hardware segment is expected to lead with the highest CAGR of 10.07% during the forecast period of 2024 to 2032. This is due to continuous innovation in smart lighting components and the growing penetration of IoT-enabled devices. With the increasing adoption of connected lighting ecosystems by more businesses, the hardware segment will further gain importance in the Power Over Ethernet Lighting Market, supported by continued demand for reliable and scalable infrastructure.
Regional Analysis
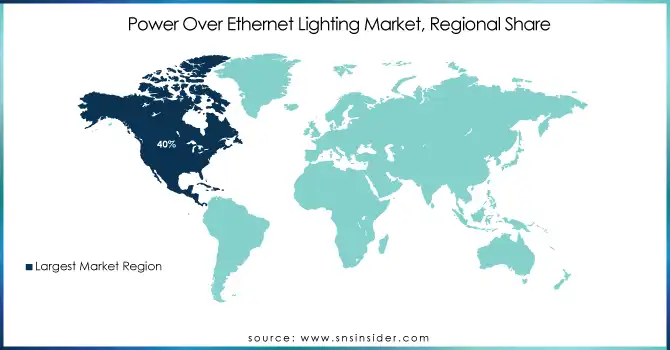
North America dominated the Power Over Ethernet Lighting Market in 2023 with 40% of the market share. The dominance is on account of a widespread adoption of smart building technologies and favorable government policies in terms of energy efficiency. For instance, the U.S. Department of Energy's efforts in energy conservation have further increased the installation of PoE systems in the commercial and residential sectors.
The Asia-Pacific region is expected to be the fastest-growing market, with a CAGR of 30.45% from 2024 to 2032. This growth is due to heavy investments in smart city projects in countries such as China, India, and Japan. The increasing urbanization and supportive government policies in these nations make them rich soil for the adoption of PoE lighting. In the overall changing market trend, regional features shine through as a most critical development in the worldwide PoE lighting scenario.
Need any customization research on Power Over Ethernet (POE) Lighting Market - Enquiry Now
Key Players
Some of the Major Players in the Power Over Ethernet Lighting Market Are
-
Cisco Systems (PoE Switches, Networking Solutions)
-
Philips Lighting (PoE LED Lights, Lighting Systems)
-
Signify (Connected Lighting Systems, Smart Lighting)
-
Hubbell Inc (PoE Lighting Fixtures, Wiring Devices)
-
Innovative Lighting (PoE Lighting Solutions, Smart Systems)
-
Acuity Brands (Smart LED Fixtures, IoT-enabled Lighting)
-
Ideal Industries (PoE Controllers, LED Lighting)
-
Cree Lighting (PoE LED Fixtures, IoT Lighting Solutions)
-
Molex (PoE Modules, Networking Components)
-
NuLEDs (PoE Lighting Solutions, Smart Controllers)
-
Versa Technology (PoE Switches, Networking Equipment)
-
Allied Telesis (PoE Network Switches, IoT Solutions)
-
Microsemi Corporation (PoE Controllers, Midspan Injectors)
-
Ubiquiti Networks (PoE Switches, Wireless Systems)
-
Digital Lumens (Smart PoE Lighting, Energy Management Systems)
-
Axis Communications (PoE Surveillance Systems, Cameras)
-
Eaton Corporation (PoE LED Fixtures, Control Systems)
-
Leviton (PoE Smart Lighting, Network Solutions)
-
Wipro Lighting (PoE-enabled LED Fixtures, Smart Systems)
-
CommScope (PoE Infrastructure Solutions, Connectivity Solutions)
Major Suppliers (Components, Technologies)
-
Broadcom (Semiconductors, Networking Components)
-
Texas Instruments (Integrated Circuits, LED Drivers)
-
Maxim Integrated (PoE ICs, Power Management Chips)
-
Analog Devices (Network Interface Chips, Power Solutions)
-
Infineon Technologies (Microcontrollers, ICs)
-
ON Semiconductor (Power Management Solutions, LED Drivers)
-
STMicroelectronics (Sensors, Microcontrollers)
-
Vishay Intertechnology (Semiconductors, Passive Components)
-
Murata Manufacturing (Inductors, Capacitors)
-
NXP Semiconductors (Microcontrollers, Networking ICs)
Recent Trends
-
January 2024: Cree LED, a subsidiary of SGH, and Current Lighting Solutions, LLC have declared that they have signed a patent licensing agreement, effective October 2022, concerning Current's patents associated with KSF (also known as PFS) red phosphor.
-
January 2025: Molex, the parent company of Phillips Medisize, has finalized, via an affiliate, the previously disclosed acquisition of Vectura Group Ltd. from Vectura Fertin Pharma Inc., a subsidiary of Philip Morris International Inc. With Vectura’s incorporation, Phillips Medisize now provides an expanded range of formulation, device design, combination product development, and manufacturing services.
| Report Attributes | Details |
|---|---|
| Market Size in 2023 | US$ 526.03 Million |
| Market Size by 2032 | US$ 5481.98 Million |
| CAGR | CAGR of 29.76% From 2024 to 2032 |
| Base Year | 2023 |
| Forecast Period | 2024-2032 |
| Historical Data | 2020-2022 |
| Report Scope & Coverage | Market Size, Segments Analysis, Competitive Landscape, Regional Analysis, DROC & SWOT Analysis, Forecast Outlook |
| Key Segments | • By Offering (Hardware, Software, Services), • By Wattage (Up To 25 Watt, Above 25 Watt), • By Application (Commercial, Residential, Industrial, Others) |
| Regional Analysis/Coverage | North America (US, Canada, Mexico), Europe (Eastern Europe [Poland, Romania, Hungary, Turkey, Rest of Eastern Europe] Western Europe] Germany, France, UK, Italy, Spain, Netherlands, Switzerland, Austria, Rest of Western Europe]), Asia Pacific (China, India, Japan, South Korea, Vietnam, Singapore, Australia, Rest of Asia Pacific), Middle East & Africa (Middle East [UAE, Egypt, Saudi Arabia, Qatar, Rest of Middle East], Africa [Nigeria, South Africa, Rest of Africa], Latin America (Brazil, Argentina, Colombia, Rest of Latin America) |
| Company Profiles | Cisco Systems, Philips Lighting, Signify, Hubbell Incorporated, Innovative Lighting, Acuity Brands, Ideal Industries, Cree Lighting, Molex, NuLEDs, Versa Technology, Allied Telesis, Microsemi Corporation, Ubiquiti Networks, Digital Lumens, Axis Communications, Eaton Corporation, Leviton, Wipro Lighting, CommScope. |
| Key Drivers | • Promoting Sustainability and Energy Efficiency through the Increasing Use of Power Over Ethernet Lighting Solutions • Power Over Ethernet Lighting Boosts IoT Integration and Promotes Innovations in Smart Building Solutions |
| Restraints | • Challenges and Cost Barriers in Power Over Ethernet Lighting Adoption and Potential Solutions |
Frequently Asked Questions
Ans: North America dominated the Power Over Ethernet Lighting Market in 2023.
Ans: The Above 25 Watt segment dominated the Power Over Ethernet Lighting Market.
Ans: The major growth factors of the Power Over Ethernet Lighting Market is IoT Integration and Innovations in Smart Building Solutions.
Ans: Power Over Ethernet Lighting Market size was USD 526.03 Million in 2023 and is expected to Reach USD 5481.98 Million by 2032.
Ans: The Power Over Ethernet Lighting Market is expected to grow at a CAGR of 29.76% during 2024-2032.
Get in Touch
