image

Procure-to-Pay Solution Market Size, Share & Segmentation By Deployment (On-Premise and SaaS), Enterprise Size (SMB and Large Enterprise), End-User Industry (BFSI, Healthcare, Oil & Gas, Telecommunication, Retail, Automotive, and Others), and Region| Global Forecast 2025-2032

Date: July 2025 Report Code: SNS/ICT/7783 Page 350

Procure-to-Pay Solution Market Report Scope & Overview:

The procure-to-pay solution market size was valued at USD 7.6 billion in 2024 and is expected to reach USD 13.9 billion by 2032, growing at a CAGR of 7.78% during 2025-2032.
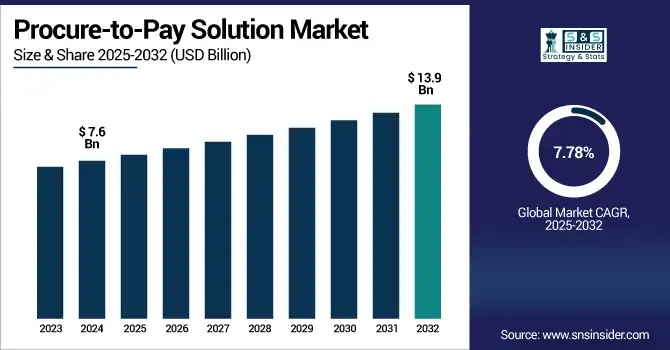
Procure-to-Pay Solution Market growth is driven by the rising demand for E2E procurement automation, real-time financial visibility, and improved collaboration with suppliers. The slow old days of procure-to-pay (P2P) with inefficient processes are gone, and organizations are increasingly adopting P2P solutions to streamline procurement, invoice processing, compliance management, and payment automation. The combination of AI, analytics, and cloud-based platforms is heralding widespread adoption across industries such as manufacturing, retail, BFSI, and healthcare. Growth has also been driven by remote work and digital workflows after the pandemic. From SMEs to large enterprises, everyone is investing in scalable P2P platforms to reduce costs and optimize procurement cycle time. According to the report, the increasing demand for digital transformation initiatives, vendor management needs, and the globalization of SaaS based procurement platforms globally sets up the market for strong growth through 2032.

The Procure-to-Pay Solution Market in the US is experiencing robust growth driven by the rising adoption of digital procurement tools, automation of compliance workflows, and cloud-based financial operations. In 2024, the market was valued at USD 2.1 billion and is projected to reach USD 3.8 billion by 2032, growing at a CAGR of 7.55%. The procure-to-pay solution market trend includes the rapid rise of AI-driven platforms that enable real-time spend analytics, dynamic supplier management, and predictive procurement capabilities.

Market Dynamics:

Drivers:

  • Surging Adoption of End-to-End Procure-to-Pay Solutions for Operational Efficiency Propel Market Growth

One of the primary drivers of market growth is the growing need for easy procurement processes across various industries. To minimize manual work, cut down the procurement cycle times, and ensure seamless connectivity between the procurement and finance departments, organizations are adopting procure-to-pay solutions. These platforms provide improved oversight for purchases, invoice matching, and payment approvals to enhance compliance and reduce costs. It gives real-time spend visibility, helps in monitoring supplier performance, and fosters strategic sourcing with the help of automation. As a complex of supply chains emerges in a globally interconnected region Automation and optimization of procurement workflow from simplicity and fragmentation into a unified strategy of practice becomes advantageous hence making every medium scale of enterprise and SME moving ahead towards and enjoying the competitive edge with robust P2P solution in place.

For instance, Organizations implementing full P2P automation achieved a 45% reduction in invoice processing time, as highlighted in the 2024 Ardent Partners ePayables Study.

Restraints:

  • Limited Adoption Among Small and Mid-Sized Enterprises Impede Market Growth

However, high initial costs related to the implementation and integration of procure-to-pay solutions are a major restraint on the market. Many of these platforms require businesses to replace their current legacy systems or ERP frameworks, which come with a price tag, both in infrastructure and licensing costs, and in costly training for employees. Moreover, for large enterprises with diverse global operations, integration with various procurement, finance, and vendor systems can be unwieldy. Such barriers may dissuade smaller and mid-tier organizations with constrained spending power from using P2P systems. Very tedious deployment and change management processes delay market penetration further, especially in traditional or highly regulated industries.

For instance, 52% of procurement organizations have deployed AI chatbots for handling supplier inquiries, streamlining communication and improving response times 

Opportunities:

  • Enabling Intelligent, Real-Time Procurement, and Spend Management Creates Market Growth Opportunities

This is a significant market opportunity in procure-to-pay solutions, which can be addressed due to the convergence of artificial intelligence and advanced analytics. AI-enabled P2P platforms can automate repetitive tasks, such as invoice matching and fraud detection and provide relevant recommendations for developing your procurement strategy. Predictive analytics improves demand forecasting, supplier risk evaluation, and tracking of the budget altogether in real time. But with the increased emphasis on visibility and control over spend management, these powerful technologies are taking center stage in next-generation P2P systems. In addition, all of these capabilities are scalable and affordable using cloud-based platforms, even for smaller firms. As AI and machine learning continue to mature, further efficiency leaps are anticipated, which likely will lead to broader adoption in the foreseeable future.

Challenges:

  • Increasing Complexity in Deployment and Vendor Selection Create Challenges for Market Expansion

Digitized data provides room for several unknown challenges, the most important being data security and compliance, which could hamper the growth of the procure-to-pay solution market. Since P2P systems deal with a lot of sensitive financial, supplier, or transactional data, they have become a prime target for cyberattacks and fraud. Beyond that, organizations have to stay compliant with a convoluted array of regulations including tax laws, procurement policies, and cross-border trade compliance, among others. Non-compliance can lead to fines or reputational harm. It is the responsibility of cloud-based P2P platforms to comply with stringent data protection protocols such as GDPR or HIPAA (if relevant). That requirement for strong cybersecurity and ongoing monitoring makes implementation more complex and costly, especially for more risk-averse firms, which may find themselves taking a breath before fully embracing the technology.

Segmentation Analysis:

By Deployment:

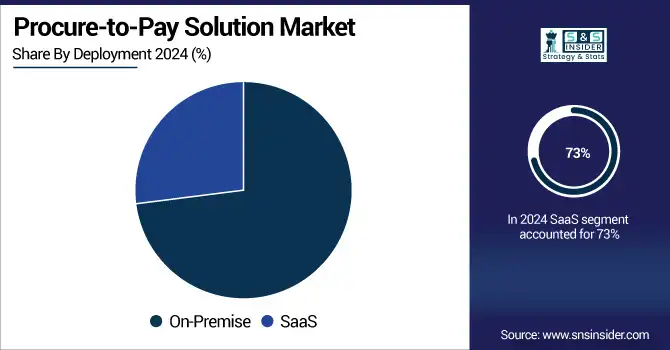
The SaaS segment dominated the market and represented a revenue share of more than 73% of revenue share and is projected to register the fastest CAGR through 2032. This growth is backed by the demand for scalable, cost-effective, and quickly deploying procurement solutions. The advantages of SaaS that make it preferable for enterprises are remote access, easy availability on all the ERP systems, and continuous updates. The SaaS model is expected to gain traction as adoption rises across both SMEs and large organizations. AI-enabled cloud-native platforms and real-time analytics are providing a further tailwind to this demand. SaaS is expected to retain dominance through 2032, with increased digital transformation projects, enhanced cybersecurity capabilities, and the transition towards subscription-based procurement ecosystems.

In July 2024, SAP introduced an enhanced cloud-native procure-to-pay offering focused on real-time analytics and improved supplier collaboration, reinforcing SaaS's scalability and efficiency advantages
By Enterprise Size:

The large enterprise segment dominated the market in 2024 and accounted for 65% of the procure-to-pay solution market share, due to leading technology providers, as a result of large corporations having complex procurement processes, broader vendor ecosystems, and more digital transformation capabilities. Such organizations require enterprise-grade solutions with built-in compliance, analytics, and automation capabilities. With global supply chains evolving fast and risk management becoming paramount, the vast deployment of AI-infused and ERP-integrated P2P platforms by large enterprises is an inevitable trend.

A G2 survey in April 2025 found that more than two-thirds of enterprise buyers are paying premiums for AI in procurement software. Nearly 50% switched vendors seeking better AI features.

The SMB segment is projected to grow at the fastest CAGR through 2032, owing to low-cost, scalable SaaS-based P2P platforms that are increasingly accessible. Rising awareness of procurement efficiency, control of cost, and vendor automation in conjunction with the current shift toward lightweight, cloud-native solutions, to reduce the burden of infrastructure costs, are trends supporting the growth of the SME domain. They provide AI, analytics, and real-time spend visibility, but for smaller operations. With a more pronounced embrace of digitalization than ever before, SMBs will turn to automation at a sharper clip to maintain competitive positions, serving as a primary growth driver in the P2P space in the years ahead.

By End-User Industry:

The BFSI segment dominated the procure-to-pay solution market in 2024 and accounted for a significant revenue share, due to the complex nature of financial operations, the high volume of transactions, and strict compliance with regulations in the environment. Banks and insurance companies are focusing on automation to improve the procurement process, mitigate the risk of fraud, and enable auditability. Adoption trends are further fueled by a heightened focus surrounding real-time analytics, centralized procurement, and secure financial workflows. In 2032, the BFSI sector will continue to be the dominant adopter as institutions will keep investing more in P2P platforms integrated with AI to facilitate changing compliance standards, enhance supplier governance, and improve spend management due to rising digitization and the need for risk mitigation.

The healthcare segment is projected to register the fastest CAGR through 2032, owing to rising demand for transparency in procurement, controlling costs, and expediently using a digitized inventory. The procure-to-pay platforms offer supply chain management for critical items, automate vendor transactions, and ensure operational resilience, and hence are being adopted by hospitals, clinics, and research institutions. This shift has been further hurried by post post-pandemic need to digitize healthcare infrastructure. Healthcare type will capture growth across the P2P market till 2032 as conformity regulations can be mitigated more efficiently in a wrinkly environment owing to a plethora of sustainability pressures, and growth propelled by AI-enabled tools for human resource optimization, mobile-enabled procurement, and cloud-based solutions for budget optimization and supply chain risks across the sector.

Regional Analysis:

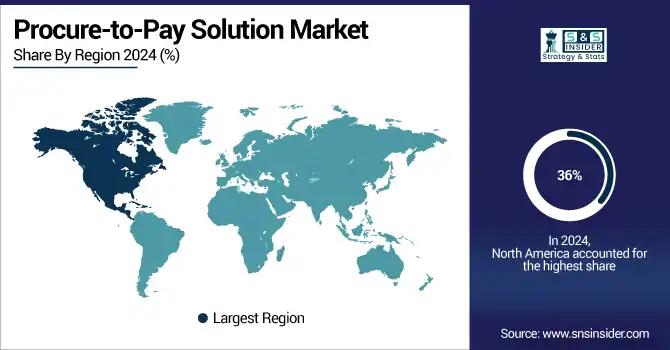
North America dominated the procure-to-pay solution market and accounted for 36% of revenue share, owing to the adoption of SaaS at a comparatively early age, strong digital infrastructure, and huge IT spending across industries, such as BFSI, healthcare, and telecom. Automation, compliance, and real-time analytics are top priorities for enterprises, driving rapid adoption. The region will remain dominant until 2032, owing to the sustained investment in AI-based procurement solutions, supplier risk management, and cloud-native platforms.

According to the procure-to-pay solution market analysis, Asia Pacific is projected to grow at the fastest rate during the forecast period. fueled by fast-paced digital transformation, higher SaaS adoption, and greater procurement automation in developing countries such as India and China. Scalable, cost-effective, and mobile-first procurement tools are in demand by businesses. APAC will grow to be the largest, fastest-growing region by 2032 due to increasing regional compliance, the rise of AI, and the adoption of cloud-based procurement.

Europe’s Procure-to-Pay market is driven by stringent regulations (GDPR, eInvoicing mandates), fueling growth in the region. The rapid adoption of AI in procurement (particularly in the DACH region) and emphasis on sustainability are also significant drivers of the Procure-to-Pay market in Europe. Demand for integrated, cloud-based, ESG-aligned procurement platforms capable of supporting multilingual, multi-currency buy-side procurement across manufacturing, BFSI, and public sectors will grow through 2032.

Germany leads Europe's Procure-to-Pay market due to its advanced manufacturing base, early ERP digitization, and strong demand for supplier risk and compliance tools. By 2032, AI-powered and SAP-integrated platforms will experience expanded use as German enterprises prioritize automation, cost control, and procurement resilience in global supply chains.
Key Players:

The major Procure-to-Pay solution market companies are SAP SE, Oracle Corporation, Coupa Software, Basware, Zycus, GEP, JAGGAER, Tradeshift, Ivalua, IBM Corporation, and others.

Recent Developments:

  • In March 2025, Oracle Corporation was named a Leader in Gartner’s Magic Quadrant for Source-to-Pay Suites for its Fusion Cloud Procurement, featuring embedded generative AI for sourcing, contract authoring, and supplier engagement.

  • In April 2024, Coupa Software launched Coupa Navi, a generative AI assistant for procurement users, and announced a roadmap for AI agents to autonomously manage transactions.

  • In September 2024, Coupa Software appointed Salvatore Lombardo as Chief Product & Technology Officer to lead AI-first product transformation.

Procure-to-Pay Solution Market Report Scope:

Report Attributes

Details

Market Size in 2024

US$ 7.6 Billion

Market Size by 2032

US$  13.9 Billion

CAGR

CAGR of 7.78% From 2025 to 2032

Base Year

2024

Forecast Period

2025-2032

Historical Data

2021-2023

Report Scope & Coverage

Market Size, Segments Analysis, Competitive  Landscape, Regional Analysis, DROC & SWOT Analysis, Forecast Outlook

Key Segments

• By Deployment (On-Premise, SaaS)
• By Enterprise Size (SMB, Large Enterprise)
• By End-User Industry (BFSI, Healthcare, Oil & Gas, Telecommunication, Retail, Automotive, Others)

Regional Analysis/Coverage

North America (US, Canada, Mexico), Europe (Germany, France, UK, Italy, Spain, Poland, Turkey, Rest of Europe), Asia Pacific (China, India, Japan, South Korea, Singapore, Australia, Rest of Asia Pacific), Middle East & Africa (UAE, Saudi Arabia, Qatar, South Africa, Rest of Middle East & Africa), Latin America (Brazil, Argentina, Rest of Latin America)

Company Profiles

SAP SE, Oracle Corporation, Coupa Software, Basware, Zycus, GEP, JAGGAER, Tradeshift, Ivalua, IBM Corporation and others in the report

Frequently Asked Questions

Ans- The expected CAGR of the Procure-to-Pay Solution Market over 2025-2032 is 7.78%.

Ans- The procure-to-pay solution market size was valued at USD 7.6 billion in 2024 and is expected to reach USD 13.9 billion by 2032

Ans- Driving Adoption of End-to-End Procure-to-Pay Solutions for Operational Efficiency

Ans- The SaaS segment dominated the market and represented revenue share of more than 73% of revenue share and is projected to register the fastest CAGR through 2032

Ans- North America region dominated the Procure-to-Pay Solution Market with 36% of revenue share in 2024.

Table of Contents

1. Introduction

1.1 Market Definition

1.2 Scope (Inclusion and Exclusions)

1.3 Research Assumptions

2. Executive Summary

2.1 Market Overview

2.2 Regional Synopsis

2.3 Competitive Summary

3. Research Methodology

3.1 Top-Down Approach

3.2 Bottom-up Approach

3.3. Data Validation

3.4 Primary Interviews

4. Market Dynamics Impact Analysis

4.1 Market Driving Factors Analysis

4.1.1 Drivers

4.1.2 Restraints

4.1.3 Opportunities

4.1.4 Challenges

4.2 PESTLE Analysis

4.3 Porter’s Five Forces Model

5. Statistical Insights and Trends Reporting

5.1 Adoption Rates of Procure-to-Pay Solutions, by Industry (Manufacturing, Retail, BFSI, Healthcare)

5.2 Cloud-based vs. On-Premise P2P Deployment Share, by Region

5.3 Average Procurement Cycle Time Reduction After P2P Implementation (2020–2024)

5.4 Spend Visibility & Compliance Improvement Metrics, by Organization Size (SMEs vs. Large Enterprises)

6. Competitive Landscape

6.1 List of Major Companies, By Region

6.2 Market Share Analysis, By Region

6.3 Product Benchmarking

6.3.1 Product specifications and features

6.3.2 Pricing

6.4 Strategic Initiatives

6.4.1 Marketing and promotional activities

6.4.2 Distribution and Supply Chain Strategies

6.4.3 Expansion plans and new Product launches

6.4.4 Strategic partnerships and collaborations

6.5 Technological Advancements

6.6 Market Positioning and Branding

7. Procure-to-Pay Solution Market Segmentation By Deployment

7.1 Chapter Overview

7.2 On-Premise

        7.2.1 On-Premise Market Trends Analysis (2021-2032)

7.2.2 On-Premise Market Size Estimates and Forecasts to 2032 (USD Billion)

7.3 SaaS

     7.3.1 SaaS Market Trends Analysis (2021-2032)

           7.3.2 SaaS Market Size Estimates and Forecasts to 2032 (USD Billion)

8. Procure-to-Pay Solution Market Segmentation By Enterprise Size

8.1 Chapter Overview

8.2 Large Enterprise

     8.2.1 Large Enterprise Market Trend Analysis (2021-2032)

           8.2.2 Large Enterprise Market Size Estimates and Forecasts to 2032 (USD Billion)

8.3 SMB

      8.3.1 SMB Market Trends Analysis (2021-2032)

           8.3.2 SMB Market Size Estimates and Forecasts to 2032 (USD Billion)

9. Procure-to-Pay Solution Market Segmentation By End-User

9.1 Chapter Overview

9.2 BFSI

        9.2.1 BFSI Market Trends Analysis (2021-2032)

9.2.2 BFSI Market Size Estimates and Forecasts to 2032 (USD Billion)

9.3 Healthcare

        9.3.1 Healthcare Market Trends Analysis (2021-2032)

9.3.2 Healthcare Market Size Estimates and Forecasts to 2032 (USD Billion)

9.4 Oil & Gas

        9.4.1 Oil & Gas Market Trends Analysis (2021-2032)

9.4.2 Oil & Gas Market Size Estimates and Forecasts to 2032 (USD Billion)

9.5 Telecommunication

        9.5.1 Telecommunication Market Trends Analysis (2021-2032)

9.5.2 Telecommunication Market Size Estimates and Forecasts to 2032 (USD Billion)

9.6 Retail

        9.6.1 Retail Market Trends Analysis (2021-2032)

9.6.2 Retail Market Size Estimates and Forecasts to 2032 (USD Billion)

9.7 Automotive

        9.7.1 Automotive Market Trends Analysis (2021-2032)

9.7.2 Automotive Market Size Estimates and Forecasts to 2032 (USD Billion)

9.8 Others

        9.8.1 Others Market Trends Analysis (2021-2032)

9.8.2 Others Market Size Estimates and Forecasts to 2032 (USD Billion)

10. Regional Analysis

10.1 Chapter Overview

10.2 North America

10.2.1 Trends Analysis

10.2.2 North America Procure-to-Pay Solution Market Estimates and Forecasts, by Country (2021-2032) (USD Billion)

10.2.3 North America Procure-to-Pay Solution Market Estimates and Forecasts, By Deployment (2021-2032) (USD Billion) 

10.2.4 North America Procure-to-Pay Solution Market Estimates and Forecasts, By Enterprise Size (2021-2032) (USD Billion)

10.2.5 North America Procure-to-Pay Solution Market Estimates and Forecasts, By End-User (2021-2032) (USD Billion)

10.2.6 USA

10.2.6.1 USA Procure-to-Pay Solution Market Estimates and Forecasts, By Deployment (2021-2032) (USD Billion)

10.2.6.2 USA Procure-to-Pay Solution Market Estimates and Forecasts, By Enterprise Size (2021-2032) (USD Billion)

10.2.6.3 USA Procure-to-Pay Solution Market Estimates and Forecasts, By End-User (2021-2032) (USD Billion)

10.2.7 Canada

10.2.7.1 Canada Procure-to-Pay Solution Market Estimates and Forecasts, By Deployment (2021-2032) (USD Billion)

10.2.7.2 Canada Procure-to-Pay Solution Market Estimates and Forecasts, By Enterprise Size (2021-2032) (USD Billion)

10.2.7.3 Canada Procure-to-Pay Solution Market Estimates and Forecasts, By End-User (2021-2032) (USD Billion)

10.2.8 Mexico

10.2.8.1 Mexico Procure-to-Pay Solution Market Estimates and Forecasts, By Deployment (2021-2032) (USD Billion)

10.2.8.2 Mexico Procure-to-Pay Solution Market Estimates and Forecasts, By Enterprise Size (2021-2032) (USD Billion)

10.2.8.3 Mexico Procure-to-Pay Solution Market Estimates and Forecasts, By End-User (2021-2032) (USD Billion)

10.3 Europe

10.3.1 Trends Analysis

10.3.2 Europe Procure-to-Pay Solution Market Estimates and Forecasts, by Country (2021-2032) (USD Billion)

10.3.3 Europe Procure-to-Pay Solution Market Estimates and Forecasts, By Deployment (2021-2032) (USD Billion) 

10.3.4 Europe Procure-to-Pay Solution Market Estimates and Forecasts, By Enterprise Size (2021-2032) (USD Billion)

10.3.5 Europe Procure-to-Pay Solution Market Estimates and Forecasts, By End-User (2021-2032) (USD Billion)

10.3.6 Germany

10.3.1.6.1 Germany Procure-to-Pay Solution Market Estimates and Forecasts, By Deployment (2021-2032) (USD Billion)

10.3.1.6.2 Germany Procure-to-Pay Solution Market Estimates and Forecasts, By Enterprise Size (2021-2032) (USD Billion)

10.3.1.6.3 Germany Procure-to-Pay Solution Market Estimates and Forecasts, By End-User (2021-2032) (USD Billion)

10.3.7 France

10.3.7.1 France Procure-to-Pay Solution Market Estimates and Forecasts, By Deployment (2021-2032) (USD Billion)

10.3.7.2 France a Procure-to-Pay Solution Market Estimates and Forecasts, By Enterprise Size (2021-2032) (USD Billion)

10.3.7.3 France Procure-to-Pay Solution Market Estimates and Forecasts, By End-User (2021-2032) (USD Billion)

10.3.8 UK

10.3.8.1 UK Procure-to-Pay Solution Market Estimates and Forecasts, By Deployment (2021-2032) (USD Billion)

10.3.8.2 UK Procure-to-Pay Solution Market Estimates and Forecasts, By Enterprise Size (2021-2032) (USD Billion)

10.3.8.3 UK Procure-to-Pay Solution Market Estimates and Forecasts, By End-User (2021-2032) (USD Billion)

10.3.9 Italy

10.3.9.1 Italy Procure-to-Pay Solution Market Estimates and Forecasts, By Deployment (2021-2032) (USD Billion)

10.3.9.2 Italy Procure-to-Pay Solution Market Estimates and Forecasts, By Enterprise Size (2021-2032) (USD Billion)

10.3.9.3 Italy Procure-to-Pay Solution Market Estimates and Forecasts, By End-User (2021-2032) (USD Billion)

10.3.10 Spain

10.3.10.1 Spain Procure-to-Pay Solution Market Estimates and Forecasts, By Deployment (2021-2032) (USD Billion)

10.3.10.2 Spain Procure-to-Pay Solution Market Estimates and Forecasts, By Enterprise Size (2021-2032) (USD Billion)

10.3.10.3 Spain Procure-to-Pay Solution Market Estimates and Forecasts, By End-User (2021-2032) (USD Billion)

10.3.12 Poland

10.3.12.1 Poland Procure-to-Pay Solution Market Estimates and Forecasts, by Country (2021-2032) (USD Billion)

10.3.12.1 Poland Procure-to-Pay Solution Market Estimates and Forecasts, By Deployment (2021-2032) (USD Billion) 

10.3.12.3 Poland Procure-to-Pay Solution Market Estimates and Forecasts, By Enterprise Size (2021-2032) (USD Billion)

10.3.12.3 Poland Procure-to-Pay Solution Market Estimates and Forecasts, By End-User (2021-2032) (USD Billion)

10.3.13 Turkey

10.3.13.1 Turkey Procure-to-Pay Solution Market Estimates and Forecasts, By Deployment (2021-2032) (USD Billion)

10.3.13.2 Turkey Procure-to-Pay Solution Market Estimates and Forecasts, By Enterprise Size (2021-2032) (USD Billion)

10.3.13.3 Turkey Procure-to-Pay Solution Market Estimates and Forecasts, By End-User (2021-2032) (USD Billion)

10.3.14 Rest of Europe

10.3.14.1 Rest of Europe Procure-to-Pay Solution Market Estimates and Forecasts, By Deployment (2021-2032) (USD Billion)

10.3.14.2 Rest of Europe Procure-to-Pay Solution Market Estimates and Forecasts, By Enterprise Size (2021-2032) (USD Billion)

10.3.14.3 Rest of Europe Procure-to-Pay Solution Market Estimates and Forecasts, By End-User (2021-2032) (USD Billion)

10.4 Asia-Pacific

10.4.1 Trends Analysis

  10.4.2 Asia-Pacific Procure-to-Pay Solution Market Estimates and Forecasts, by Country (2021-2032) (USD Billion)

 10.4.3 Asia-Pacific Procure-to-Pay Solution Market Estimates and Forecasts, By Deployment (2021-2032) (USD Billion) 

 10.4.4 Asia-Pacific Procure-to-Pay Solution Market Estimates and Forecasts, By Enterprise Size (2021-2032) (USD Billion)

 10.4.5 Asia-Pacific Procure-to-Pay Solution Market Estimates and Forecasts, By End-User (2021-2032) (USD Billion)

10.4.6 China

10.4.6.1 China Procure-to-Pay Solution Market Estimates and Forecasts, By Deployment (2021-2032) (USD Billion)

10.4.6.2 China Procure-to-Pay Solution Market Estimates and Forecasts, By Enterprise Size (2021-2032) (USD Billion)

10.4.6.3 China Procure-to-Pay Solution Market Estimates and Forecasts, By End-User (2021-2032) (USD Billion)

10.4.7 India

10.4.7.1 India Procure-to-Pay Solution Market Estimates and Forecasts, By Deployment (2021-2032) (USD Billion)

10.4.7.2 India Procure-to-Pay Solution Market Estimates and Forecasts, By Enterprise Size (2021-2032) (USD Billion)

10.4.7.3 India Procure-to-Pay Solution Market Estimates and Forecasts, By End-User (2021-2032) (USD Billion)

10.4.8 Japan

10.4.8.1 Japan Procure-to-Pay Solution Market Estimates and Forecasts, By Deployment (2021-2032) (USD Billion)

10.4.8.2 Japan Procure-to-Pay Solution Market Estimates and Forecasts, By Enterprise Size (2021-2032) (USD Billion)

10.4.8.3 Japan Procure-to-Pay Solution Market Estimates and Forecasts, By End-User (2021-2032) (USD Billion)

10.4.9 South Korea

10.4.9.1 South Korea Procure-to-Pay Solution Market Estimates and Forecasts, By Deployment (2021-2032) (USD Billion)

10.4.9.2 South Korea Procure-to-Pay Solution Market Estimates and Forecasts, By Enterprise Size (2021-2032) (USD Billion)

10.4.9.3 South Korea Procure-to-Pay Solution Market Estimates and Forecasts, By End-User (2021-2032) (USD Billion)

10.4.10 Singapore

10.4.10.1 Singapore Procure-to-Pay Solution Market Estimates and Forecasts, By Deployment (2021-2032) (USD Billion)

10.4.10.2 Singapore Procure-to-Pay Solution Market Estimates and Forecasts, By Enterprise Size (2021-2032) (USD Billion)

10.4.10.3 Singapore Procure-to-Pay Solution Market Estimates and Forecasts, By End-User (2021-2032) (USD Billion)

10.4.11 Australia

10.4.11.1 Australia Procure-to-Pay Solution Market Estimates and Forecasts, By Deployment (2021-2032) (USD Billion)

10.4.11.2 Australia Procure-to-Pay Solution Market Estimates and Forecasts, By Enterprise Size (2021-2032) (USD Billion)

10.4.11.3 Australia Procure-to-Pay Solution Market Estimates and Forecasts, By End-User (2021-2032) (USD Billion)

10.4.12 Rest of Asia-Pacific

10.4.12.1 Rest of Asia-Pacific Procure-to-Pay Solution Market Estimates and Forecasts, By Deployment (2021-2032) (USD Billion)

10.4.12.2 Rest of Asia-Pacific Procure-to-Pay Solution Market Estimates and Forecasts, By Enterprise Size (2021-2032) (USD Billion)

10.4.12.3 Rest of Asia-Pacific Procure-to-Pay Solution Market Estimates and Forecasts, By End-User (2021-2032) (USD Billion)

10.5 Middle East and Africa

10.5.1 Trends Analysis

10.5.2 Middle East and Africa East Procure-to-Pay Solution Market Estimates and Forecasts, by Country (2021-2032) (USD Billion)

10.5.3Middle East and Africa Procure-to-Pay Solution Market Estimates and Forecasts, By Deployment (2021-2032) (USD Billion) 

10.5.4 Middle East and Africa Procure-to-Pay Solution Market Estimates and Forecasts, By Enterprise Size (2021-2032) (USD Billion)

10.5.5 Middle East and Africa Procure-to-Pay Solution Market Estimates and Forecasts, By End-User (2021-2032) (USD Billion)

10.5.6 UAE

10.5.6.1 UAE Procure-to-Pay Solution Market Estimates and Forecasts, By Deployment (2021-2032) (USD Billion)

10.5.6.2 UAE Procure-to-Pay Solution Market Estimates and Forecasts, By Enterprise Size (2021-2032) (USD Billion)

10.5.6.3 UAE Procure-to-Pay Solution Market Estimates and Forecasts, By End-User (2021-2032) (USD Billion)

10.5.7 Saudi Arabia

10.5.7.1 Saudi Arabia Procure-to-Pay Solution Market Estimates and Forecasts, By Deployment (2021-2032) (USD Billion)

10.5.7.2 Saudi Arabia Procure-to-Pay Solution Market Estimates and Forecasts, By Enterprise Size (2021-2032) (USD Billion)

10.5.7.3 Saudi Arabia Procure-to-Pay Solution Market Estimates and Forecasts, By End-User (2021-2032) (USD Billion)

10.5.8 Qatar

10.5.8.1 Qatar Procure-to-Pay Solution Market Estimates and Forecasts, By Deployment (2021-2032) (USD Billion)

10.5.8.2 Qatar Procure-to-Pay Solution Market Estimates and Forecasts, By Enterprise Size (2021-2032) (USD Billion)

10.5.8.3 Qatar Procure-to-Pay Solution Market Estimates and Forecasts, By End-User (2021-2032) (USD Billion)

10.5.9 South Africa

10.5.9 1 South Africa Procure-to-Pay Solution Market Estimates and Forecasts, By Deployment (2021-2032) (USD Billion)

10.5.9 2 South Africa Procure-to-Pay Solution Market Estimates and Forecasts By Enterprise Size (2021-2032) (USD Billion)

10.5.9 3 South Africa Procure-to-Pay Solution Market Estimates and Forecasts, By End-User (2021-2032) (USD Billion)

10.5.10 Rest of Middle East & Africa

10.5.10.1 Rest of Middle East & Africa Procure-to-Pay Solution Market Estimates and Forecasts, By Deployment (2021-2032) (USD Billion)

10.5.10.2 Rest of Middle East & Africa Procure-to-Pay Solution Market Estimates and Forecasts, By Enterprise Size (2021-2032) (USD Billion)

10.5.10.3 Rest of Middle East & Africa Procure-to-Pay Solution Market Estimates and Forecasts, By End-User (2021-2032) (USD Billion)

10.6 Latin America

10.6.1 Trends Analysis

10.6.2 Latin America Procure-to-Pay Solution Market Estimates and Forecasts, by Country (2021-2032) (USD Billion)

10.6.3 Latin America Procure-to-Pay Solution Market Estimates and Forecasts, By Deployment (2021-2032) (USD Billion) 

10.6.4 Latin America Procure-to-Pay Solution Market Estimates and Forecasts, By Enterprise Size (2021-2032) (USD Billion)

10.6.5 Latin America Procure-to-Pay Solution Market Estimates and Forecasts, By End-User (2021-2032) (USD Billion)

10.6.6 Brazil

10.6.6.1 Brazil Procure-to-Pay Solution Market Estimates and Forecasts, By Deployment (2021-2032) (USD Billion)

10.6.6.2 Brazil Procure-to-Pay Solution Market Estimates and Forecasts, By Enterprise Size (2021-2032) (USD Billion)

10.6.6.3 Brazil Procure-to-Pay Solution Market Estimates and Forecasts, By End-User (2021-2032) (USD Billion)

10.6.7 Argentina

10.6.7.1 Argentina Procure-to-Pay Solution Market Estimates and Forecasts, By Deployment (2021-2032) (USD Billion)

10.6.7.2 Argentina Procure-to-Pay Solution Market Estimates and Forecasts, By Enterprise Size (2021-2032) (USD Billion)

10.6.7.3 Argentina Procure-to-Pay Solution Market Estimates and Forecasts, By End-User (2021-2032) (USD Billion)

10.6.8 Rest of Latin America

10.6.8.1 Rest of Latin America Procure-to-Pay Solution Market Estimates and Forecasts, By Deployment (2021-2032) (USD Billion)

10.6.8.2 Rest of Latin America Procure-to-Pay Solution Market Estimates and Forecasts, By Enterprise Size (2021-2032) (USD Billion)

10.6.8.3 Rest of Latin America Procure-to-Pay Solution Market Estimates and Forecasts, By End-User (2021-2032) (USD Billion)

12. Company Profiles

12.1 SAP SE

          12.1.1 Company Overview

12.1.2 Financial

12.1.3 Products/ Services Offered

12.1.4 SWOT Analysis

12.2 Oracle Corporation

           12.2.1 Company Overview

12.2.2 Financial

12.2.3 Products/ Services Offered

12.2.4 SWOT Analysis

12.3 Coupa Software

          12.3.1 Company Overview

12.3.2 Financial

12.3.3 Products/ Services Offered

12.3.4 SWOT Analysis

12.4 Basware

          12.4.1 Company Overview

12.4.2 Financial

12.4.3 Products/ Services Offered

12.4.4 SWOT Analysis

12.5 Zycus

          12.5.1 Company Overview

12.5.2 Financial

12.5.3 Products/ Services Offered

12.5.4 SWOT Analysis

12.6 GEP

            12.6.1 Company Overview

12.6.2 Financial

12.6.3 Products/ Services Offered

12.6.4 SWOT Analysis

12.7 JAGGAER

          12.7.1 Company Overview

12.7.2 Financial

12.7.3 Products/ Services Offered

12.7.4 SWOT Analysis

12.8 Tradeshift

            12.8.1 Company Overview

12.8.2 Financial

12.8.3 Products/ Services Offered

12.8.4 SWOT Analysis

12.9 Ivalua

           12.9.1 Company Overview

12.9.2 Financial

12.9.3 Products/ Services Offered

12.9.4 SWOT Analysis

12.10 IBM Corporation

            12.10.1 Company Overview

12.10.2 Financial

12.10.3 Products/ Services Offered

12.10.4 SWOT Analysi

12. Use Cases and Best Practices

13. Conclusion

An accurate research report requires proper strategizing as well as implementation. There are multiple factors involved in the completion of good and accurate research report and selecting the best methodology to compete the research is the toughest part. Since the research reports we provide play a crucial role in any company’s decision-making process, therefore we at SNS Insider always believe that we should choose the best method which gives us results closer to reality. This allows us to reach at a stage wherein we can provide our clients best and accurate investment to output ratio.

Each report that we prepare takes a timeframe of 350-400 business hours for production. Starting from the selection of titles through a couple of in-depth brain storming session to the final QC process before uploading our titles on our website we dedicate around 350 working hours. The titles are selected based on their current market cap and the foreseen CAGR and growth.


The 5 steps process:

Step 1: Secondary Research:

Secondary Research or Desk Research is as the name suggests is a research process wherein, we collect data through the readily available information. In this process we use various paid and unpaid databases which our team has access to and gather data through the same. This includes examining of listed companies’ annual reports, Journals, SEC filling etc. Apart from this our team has access to various associations across the globe across different industries. Lastly, we have exchange relationships with various university as well as individual libraries.

Secondary Research

Step 2: Primary Research

When we talk about primary research, it is a type of study in which the researchers collect relevant data samples directly, rather than relying on previously collected data.  This type of research is focused on gaining content specific facts that can be sued to solve specific problems. Since the collected data is fresh and first hand therefore it makes the study more accurate and genuine.

We at SNS Insider have divided Primary Research into 2 parts.

Part 1 wherein we interview the KOLs of major players as well as the upcoming ones across various geographic regions. This allows us to have their view over the market scenario and acts as an important tool to come closer to the accurate market numbers. As many as 45 paid and unpaid primary interviews are taken from both the demand and supply side of the industry to make sure we land at an accurate judgement and analysis of the market.

This step involves the triangulation of data wherein our team analyses the interview transcripts, online survey responses and observation of on filed participants. The below mentioned chart should give a better understanding of the part 1 of the primary interview.

Primary Research

Part 2: In this part of primary research the data collected via secondary research and the part 1 of the primary research is validated with the interviews from individual consultants and subject matter experts.

Consultants are those set of people who have at least 12 years of experience and expertise within the industry whereas Subject Matter Experts are those with at least 15 years of experience behind their back within the same space. The data with the help of two main processes i.e., FGDs (Focused Group Discussions) and IDs (Individual Discussions). This gives us a 3rd party nonbiased primary view of the market scenario making it a more dependable one while collation of the data pointers.

Step 3: Data Bank Validation

Once all the information is collected via primary and secondary sources, we run that information for data validation. At our intelligence centre our research heads track a lot of information related to the market which includes the quarterly reports, the daily stock prices, and other relevant information. Our data bank server gets updated every fortnight and that is how the information which we collected using our primary and secondary information is revalidated in real time.

Data Bank Validation

Step 4: QA/QC Process

After all the data collection and validation our team does a final level of quality check and quality assurance to get rid of any unwanted or undesired mistakes. This might include but not limited to getting rid of the any typos, duplication of numbers or missing of any important information. The people involved in this process include technical content writers, research heads and graphics people. Once this process is completed the title gets uploader on our platform for our clients to read it.

Step 5: Final QC/QA Process:

This is the last process and comes when the client has ordered the study. In this process a final QA/QC is done before the study is emailed to the client. Since we believe in giving our clients a good experience of our research studies, therefore, to make sure that we do not lack at our end in any way humanly possible we do a final round of quality check and then dispatch the study to the client.

Key Segments:

By  Deployment

  • On-Premise

  • SaaS

By Enterprise Size

  • SMB

  • Large Enterprise

By End-User Industry

  • BFSI

  • Healthcare

  • Oil & Gas

  • Telecommunication

  • Retail

  • Automotive

  • Others

Request for Segment Customization as per your Business Requirement: Segment Customization Request

Regional Coverage: 

North America

  • US

  • Canada

  • Mexico

Europe

  • Germany

  • France

  • UK

  • Italy

  • Spain

  • Poland

  • Turkey

  • Rest of Europe

Asia Pacific

  • China

  • India

  • Japan

  • South Korea

  • Singapore

  • Australia

  • Rest of Asia Pacific

Middle East & Africa

  • UAE

  • Saudi Arabia

  • Qatar

  • South Africa

  • Rest of Middle East & Africa

Latin America

  • Brazil

  • Argentina

  • Rest of Latin America

Request for Country Level Research Report: Country Level Customization Request

Available Customization 

With the given market data, SNS Insider offers customization as per the company’s specific needs. The following customization options are available for the report: 

  • Detailed Volume Analysis 

  • Criss-Cross segment analysis (e.g. Component X Application) 

  • Competitive Component Benchmarking 

  • Geographic Analysis 

  • Additional countries in any of the regions 

  • Customized Data Representation 

  • Detailed analysis and profiling of additional market players


Explore Key Insights.


  • Analyzes market trends, forecasts, and regional dynamics
  • Covers core offerings, innovations, and industry use cases
  • Profiles major players, value chains, and strategic developments
  • Highlights innovation trends, regulatory impacts, and growth opportunities
Request an Analyst Call