Cash Logistics Market Report Scope & Overview:
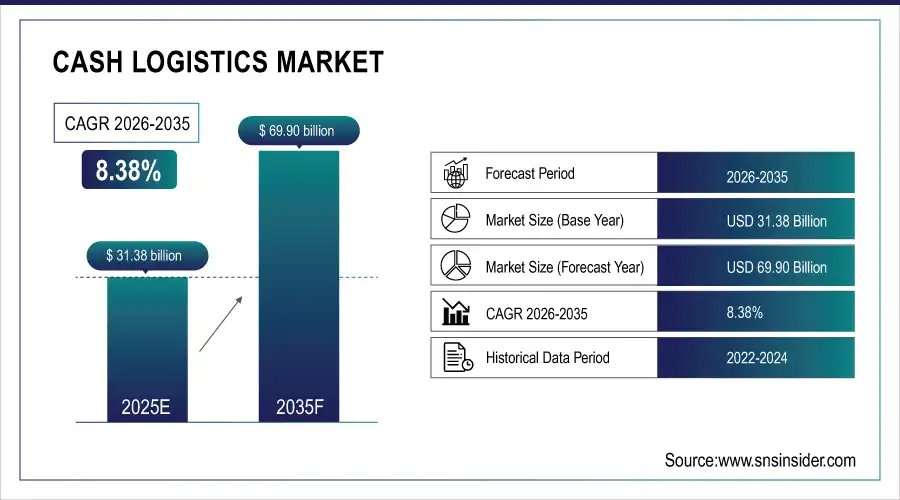
The cash logistics market size was valued at USD 31.38 billion in 2025 and is expected to reach USD 69.90 billion by 2035 and grow at a CAGR of 8.38% over the forecast period of 2026-2035.
The market is essential for the secure and efficient transport and processing of cash between the banking, retail, and commercial markets. Notable solutions consist of cash-in-transit, ATM replenishment, cash processing, and vault management. Continued usage of cash in developing markets, increased ATMs, and growth in cash management situations are expected to drive the market growth. But due to the increasing digital transactions and rising operational expenses associated with security and armored transport, the sector is under pressure. However, there is cash logistics, which is still an essential piece of keeping liquidity and businesses functioning, especially where digital infrastructure is still limited.
According to the study, by recent security concerns regarding cash processing and transmission, and the rise in ATM installations as revealed in the study. However, the higher the risk, the higher the demand for secure cash-in-transit or processing services has risen, as businesses and banks face a new criminal underbelly of theft and fraud. As a result, demand for real-time tracking, advanced vault management, and replenishment services has also increased. Consequently, more than 60% of financial institutions now use outsourced cash logistics service providers to achieve efficiency and security.
Cash Logistics Market Size and Forecast:
-
Market Size in 2025: USD 31.38 Billion
-
Market Size by 2035: USD 69.90 Billion
-
CAGR: 8.38% from 2026 to 2035
-
Base Year: 2025
-
Forecast Period: 2026–2035
-
Historical Data: 2022–2024
To Get more information on Cash Logistics Market - Request Free Sample Report
Cash Logistics Market Trends:
-
Increasing ATM installations and expansion of outsourced cash handling services
-
Rising adoption of real-time tracking, armored fleet modernization, and advanced vault management systems
-
Growing integration of smart safe technology in retail cash management
-
Expanding demand for secure cash-in-transit (CIT) services across banking and retail sectors
-
Rising cybersecurity investments to protect digital cash monitoring platforms
-
Strong growth in emerging economies where cash remains a dominant transaction medium
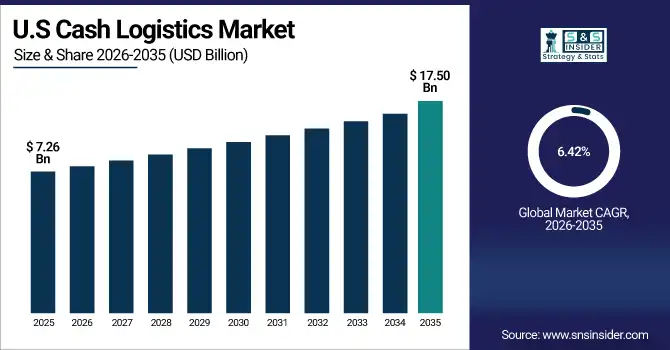
The U.S. cash logistics market size was USD 7.26 billion in 2025 and is expected to reach USD 17.50 billion by 2035, growing at a CAGR of 6.42% over the forecast period of 2026–2035.
Rising retail cash circulation, increasing ATM installations, and heightened demand for secure currency handling are driving the U.S. cash logistics market. The U.S. dominates the North American region due to its vast banking infrastructure, large-scale retail operations, and strong demand for outsourced cash management services. As a result, major financial institutions and retailers in the U.S. rely heavily on third-party providers to ensure efficient, secure, and compliant cash handling across dispersed locations.
Cash Logistics Market Dynamics:
Key Drivers:
-
Rising ATM Installations and Outsourced Cash Handling Services Drive the Global Cash Logistics Market Growth
The increasing number of ATM installations globally is a key driver of the cash logistics market, as financial institutions and service providers expand their reach to both urban and remote regions. This expansion requires reliable and secure cash-in-transit, ATM replenishment, and processing services, leading to a higher demand for outsourced logistics solutions. The complexity of managing cash cycles across various endpoints has pushed financial institutions and large retailers to partner with specialized vendors that provide end-to-end services. Outsourcing not only ensures regulatory compliance but also enhances operational efficiency by leveraging advanced tracking systems, armored vehicles, and real-time monitoring tools.
Moreover, financial entities prefer third-party vendors that can manage high cash volumes while reducing the risks associated with theft, fraud, and manual errors. In parallel, the continued use of cash in emerging economies further accelerates the need for structured logistics operations. As a result, the market is witnessing steady growth, especially in regions where cash remains a dominant medium of transaction and financial inclusion is on the rise. Together, these factors are shaping the evolution of cash logistics from a traditional transport service into a highly integrated component of the financial services infrastructure.
Restraints:
-
Digital Payment Penetration and Rising Operational Costs Restrain Growth in the Cash Logistics Market
While the cash logistics market continues to grow, its expansion is increasingly restrained by the global shift toward digital payments and rising operational costs. As mobile banking, contactless transactions, and e-wallets become more widespread, the volume of physical cash in circulation is stabilizing or declining, particularly in technologically advanced regions. This change reduces the demand for routine cash transportation and handling, weakening the volume upon which many logistics providers rely. At the same time, escalating costs related to vehicle maintenance, insurance, security systems, and labor place financial strain on companies operating in the sector. These rising expenses make it difficult for smaller players to stay competitive, while larger firms are forced to constantly innovate to maintain profitability.
Furthermore, the need to comply with strict regulatory standards around security, reporting, and environmental impact adds another layer of operational complexity. These pressures have led to tighter margins and, in some regions, market consolidation. As digital ecosystems continue to strengthen globally, the relevance of traditional cash logistics is being questioned, prompting providers to adapt or risk losing relevance in a changing financial landscape. This dual challenge significantly restrains the pace and scale of market growth.
Opportunities:
-
Smart Safe Technology Adoption in Retail Creates Growth Opportunities for the Cash Logistics Market
The global adoption of smart safe technology in retail environments is creating new growth opportunities for the cash logistics market. These devices automate key cash management processes, such as counting, deposit authentication, and reconciliation, allowing retailers to reduce shrinkage, enhance security, and streamline operations. The shift toward automation not only reduces the frequency of pickups but also improves cash flow by enabling faster deposit crediting through banking partnerships. This evolution is particularly attractive to mid-sized businesses and retail chains seeking operational efficiency without compromising cash safety. As more retailers adopt smart safes, logistics firms are transforming their business models from basic transportation services to technology-enabled cash management providers. This transition opens up a new service vertical within the industry and enhances its long-term relevance, particularly in hybrid payment environments, where cash remains significant despite digital growth.
Challenges:
-
Skilled Labor Shortage and Security Staffing Constraints Challenge Operational Continuity in the Cash Logistics Market
A persistent shortage of skilled labor, particularly among armed security personnel and technical operations staff, is a growing challenge for the global cash logistics market. As security threats increase and compliance standards become more stringent, logistics firms require highly trained staff to manage armored transport, vault operations, and emergency protocols. However, finding qualified personnel remains difficult due to high entry requirements, job-related stress, and limited interest from younger workforce segments. This shortage is especially problematic in regions lacking vocational training infrastructure or where employment in logistics is considered high-risk. Without adequate staffing, companies face disruptions in service schedules, delayed pickups, and reduced capacity to onboard new clients.
Moreover, firms are compelled to offer higher wages and benefits to retain experienced personnel, which increases operational costs and reduces profitability. Smaller logistics providers are disproportionately impacted, as they often lack the financial flexibility to compete for top talent. This labor gap not only affects service reliability but also undermines client confidence, leading to project delays or contract cancellations. Over time, the challenge of maintaining a consistent, trained workforce could limit the scalability and efficiency of logistics operations across various regions, affecting the market’s overall growth potential.
Cash Logistics Market Segmentation Analysis:
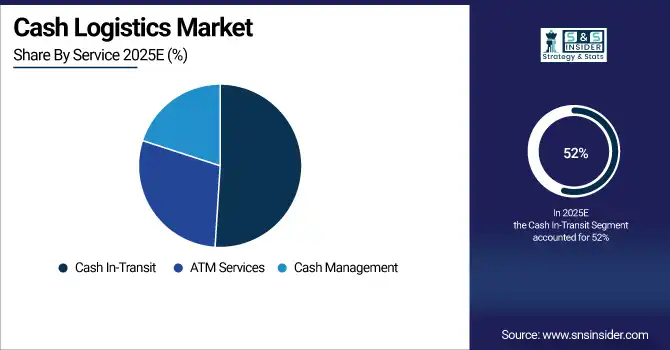
By Service
The Cash-In-Transit segment led the market with 52% revenue share in 2025 due to rising ATM installations and retail cash circulation. This surge has increased the need for secure armored transportation and real-time tracking. Product innovations, such as GPS-enabled vehicles and tamper-proof containers, enhance efficiency and safety. As cash remains vital in many regions, reliable transit solutions continue driving demand, firmly anchoring this segment’s contribution to the overall cash logistics market growth across both public and private sectors.
The Cash Management segment is expanding rapidly with a CAGR of 10.53%, fueled by automation, real-time monitoring, and smart safe deployment. Businesses increasingly seek outsourced services for reconciliation, counting, and float optimization. Product developments including AI-based forecasting tools and automated deposit systems streamline workflows. As digital tracking tools enhance transparency and reduce losses, cash logistics providers are shifting toward value-added services, positioning this segment as a key growth engine within the evolving market landscape.
By End-User
Financial institutions hold a 50% revenue share in 2025, driven by high cash transaction volumes, ATM servicing needs, and security mandates. As banks focus on operational efficiency, they rely on outsourced cash logistics for vault management, secure transit, and ATM replenishment. Developments, such as real-time cash tracking and biometric access control systems improve accountability. These institutions’ dependency on end-to-end secure handling services strengthens their dominance, reinforcing their strategic importance in the global cash logistics market.
Government agencies are growing at the fastest CAGR of 12.92% due to rising public infrastructure spending, defense security needs, and secure payroll distribution in cash-heavy regions. Governments increasingly seek regulated logistics providers for high-value and secure deliveries. Technological integration, including RFID-tagged containers and tamper-evident seals, ensures traceability and compliance. As public institutions adopt performance-based outsourcing models, the demand for specialized cash handling grows, positioning this segment as a strong contributor to future market expansion.
By Mode of Transit
The Roadways segment leads with 52% revenue in 2025, supported by widespread armored fleet deployment and urban cash demand. Cash-in-transit services via road remain the most flexible and cost-effective solution for banks and retailers. Innovations, including route optimization software, panic alert systems, and climate-controlled armored trucks have enhanced reliability and safety. Road-based logistics continue to serve as the operational backbone of the cash logistics market, enabling timely and secure cash movement across regional networks.
The Airways segment is growing at a CAGR of 10.74%, driven by the demand for rapid, due to long-distance transport of high-value cash and precious commodities. Airports and financial hubs are prioritizing air logistics to reduce transit time and exposure to theft. Developments in tamper-proof cargo containers, chain-of-custody technologies, and advanced scheduling systems support growth. As global trade expands and cash distribution requires faster turnarounds, the air transit segment becomes a crucial enabler in the cash logistics value chain.
By Security Type
Physical security holds a cash logistics market share of 49% in 2025, driven by continued reliance on armored vehicles, access control systems, and surveillance for transit and vault safety. Rising incidents of cash theft have forced firms to invest in bulletproof containers, double-lock systems, and armed guards. Product developments like real-time CCTV integration and biometric vault access enhance resilience. As theft prevention remains paramount, physical security infrastructure remains a core pillar supporting the cash logistics market’s operational integrity.
Cybersecurity is expanding at a 14.26% CAGR as digital cash management and smart devices expose systems to cyber threats. Attacks on real-time monitoring platforms, data theft, and ATM network breaches necessitate investment in end-to-end encryption and AI-based anomaly detection tools. As digital integration grows, cybersecurity becomes a strategic focus in protecting data integrity, further boosting this segment's role in shaping the modern cash logistics ecosystem.
Cash Logistics Market Regional Analysis:
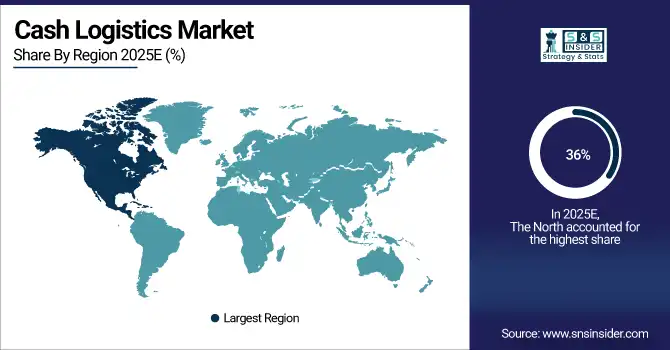
North America Cash Logistics Market Insights:
North America is the dominant region in the cash logistics market in 2025, with an estimated market share of 36%. High ATM penetration, robust retail infrastructure, and institutional demand for secure cash handling drive North America's leadership in the market. The U.S. leads the region, supported by extensive banking networks, consistent cash circulation, and widespread outsourcing of CIT services. In 2025, major providers introduced real-time tracking systems and armored fleet upgrades for enhanced operational security. These developments solidify the U.S. position as the regional hub for innovation, efficiency, and high-volume cash logistics operations.
Asia Pacific Cash Logistics Market Insights
Asia Pacific is the fastest-growing region in the cash logistics market in 2025, with an estimated CAGR of 11.36%. Rapid financial inclusion, expanding ATM networks, and growing retail sectors are accelerating demand for cash logistics in Asia Pacific. China dominates this fast-growing region due to high cash transaction volumes and strong government support for financial access. In 2025, Chinese providers deployed smart safe solutions and digitized vault management across tier-2 cities. Backed by infrastructure modernization and hybrid payment models, China is spearheading service expansion and securing the long-term relevance of cash logistics across the region.
Europe Cash Logistics Market Insights
Europe’s regulatory landscape and high-value cash transactions drive the cash logistics market in 2025. Regulated cash handling standards, retail stability, and strong demand for traceable logistics are key to Europe’s market strength. Germany leads the region, driven by a mature banking sector, robust armored vehicle infrastructure, and institutional focus on secure cash management. In 2025, German firms implemented AI-integrated route planning and contactless deposit systems. With strict compliance mandates and industrial cash needs, Germany continues to anchor Europe’s advanced, efficiency-focused cash logistics service model.
Middle East & Africa and Latin America Cash Logistics Market Insights
In 2025, the cash logistics market in the Middle East & Africa (MEA) and Latin America sees rising momentum driven by financial inclusion and infrastructure investment. In MEA, the UAE leads, supported by modern banking facilities and digitized cash handling frameworks aligned with smart city goals. Dubai’s secure cash ecosystem and advanced CIT partnerships highlight regional progress. In Latin America, Brazil dominates due to high cash dependency, especially in public welfare distribution and informal markets. Providers in both regions are investing in armored transport upgrades and localized logistics models, fostering scalable growth in underserved but cash-reliant economies.
Get Customized Report as per Your Business Requirement - Enquiry Now
Key Players:
-
Cash Logistik Security AG
-
CMS Info Systems Ltd.
-
G4S Limited
-
GardaWorld
-
Global Security Logistic Co.
-
Security and Intelligence Services Ltd.
-
Loomis AB
-
Cash in Transit Solutions Pty Ltd
-
Transguard Group
-
G4S Cash Solutions India Pvt. Ltd.
-
BHS Corrugated India Pvt. Ltd.
-
SecureCash
-
Mancorp Security Solutions
-
MMA Group
-
SBV Services
-
Fidelity Security Group
-
NCR Corporation
-
Linfox Armaguard Pty Ltd
Recent Developments:
-
June 2025 – Brinks made a strategic investment in KAL ATM Software to enhance its ATM Managed Services Solutions globally, reinforcing its strength in ATM cash logistics and digital retail infrastructure.
| Report Attributes | Details |
|---|---|
| Market Size in 2025 | USD 31.38 Billion |
| Market Size by 2035 | USD 69.90 Billion |
| CAGR | CAGR of 8.38% From 2026 to 2035 |
| Base Year | 2025 |
| Forecast Period | 2026-2035 |
| Historical Data | 2022-2024 |
| Report Scope & Coverage | Market Size, Segments Analysis, Competitive Landscape, Regional Analysis, DROC & SWOT Analysis, Forecast Outlook |
| Key Segments | • By Service Type (ATM Services, Cash In-Transit, Cash Management) • By End-User (Financial Institutions, Government Agencies, Retail, Others) • By Mode of Transit (Roadways, Railways, Airways, Others) • By Security Type (Physical Security, Electronic Security, Cybersecurity Solutions, Others) |
| Regional Analysis/Coverage | North America (US, Canada), Europe (Germany, UK, France, Italy, Spain, Russia, Poland, Rest of Europe), Asia Pacific (China, India, Japan, South Korea, Australia, ASEAN Countries, Rest of Asia Pacific), Middle East & Africa (UAE, Saudi Arabia, Qatar, South Africa, Rest of Middle East & Africa), Latin America (Brazil, Argentina, Mexico, Colombia, Rest of Latin America). |
| Company Profiles | Brink's Incorporated, Cash Logistik Security AG, CMS Info Systems Ltd., G4S Limited, GardaWorld, Global Security Logistic Co., Security and Intelligence Services Ltd., Loomis AB, Prosegur, Cash in Transit Solutions Pty Ltd, Transguard Group, G4S Cash Solutions India Pvt. Ltd., BHS Corrugated India Pvt. Ltd., SecureCash, Mancorp Security Solutions, MMA Group, SBV Services, Fidelity Security Group, NCR Corporation, and Linfox Armaguard Pty Ltd, and Others. |
Frequently Asked Questions
Ans: The Cash Logistics Market is expected to grow at a CAGR of 8.38% during 2026–2035.
Ans: The market was valued at USD 31.38 Billion in 2025 and is expected to reach USD 69.90 Billion by 2035.
Ans: Key drivers include rising ATM installations, growing outsourced cash handling services, increasing demand for secure cash-in-transit (CIT), adoption of real-time tracking and smart safe technologies, and continued cash usage in emerging economies.
Ans: The Cash-In-Transit (CIT) segment dominated the market in 2025, accounting for 52% revenue share.
Ans: North America dominated the Cash Logistics Market in 2025, holding approximately 36% market share.
Get in Touch
