
Projection Mapping Market Report Scope & Overview:
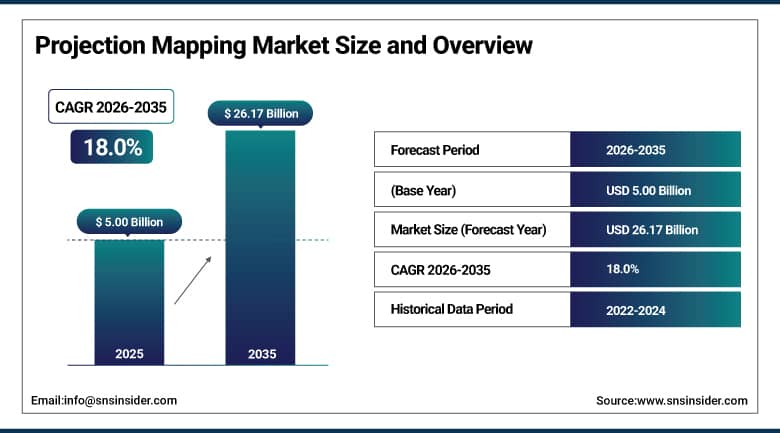
The Projection Mapping Market was valued at USD 5.00 Billion in 2025 and is projected to reach USD 26.17 Billion by 2035, registering a CAGR of 18.0% from 2026 to 2035.
The Projection Mapping Market refers to the projectors, media servers, and software that enable buildings, stages, and irregularly-shaped three-dimensional surfaces to be turned into dynamic visual presentations, and is also referred to as spatial augmented reality. There is demand from entertainment, advertising, education, corporate event planners, and municipal placemakers; theme parks, concerts, sports events, and public exhibitions are fueling the steady growth of adoption through 2025. The cost-per-lumen of RGB laser projectors was equal to that of lamp-based models in 2025 while offering operational lives of around 20,000 hours, reducing maintenance and power usage, and significantly decreasing overall costs of ownership for permanent architectural and venue applications. AI-powered solutions for auto-UV unwrapping, texture creation, and edge-blending optimization kept cutting down deployment timeframes from months to weeks, sparking off a flood of medium-budget corporate and retail deployments which would have otherwise needed specialized production teams.
In March 2025, Disney introduced "Shadows of Memory, A Skywalker Saga," its first projection mapping show at Galaxy's Edge, which was seen to increase the number of guests per hour by 18% by using plazas which were previously just corridors between attractions.
To Get More Information On Projection Mapping Market - Request Free Sample Report
Projection Mapping Market Trends
-
Subscription-based software models continued converting one-off hardware outlays into recurring operating expenses that corporate finance teams increasingly preferred.
-
AI-driven auto-UV unwrapping and edge-blend optimization tools continued reducing dependence on specialized technical labor for complex multi-surface installations.
-
Short-throw projector adoption continued reducing rigging costs, which often represented as much as 30% of total legacy project budgets, while cutting insurance premiums tied to overhead mounting.
-
Integration with augmented reality and virtual reality technologies continued expanding the application scope of projection mapping across hybrid in-person and virtual event formats.
-
Regulatory convergence around laser illumination safety standards continued reducing certification hurdles for compliant equipment manufacturers.
U.S. Projection Mapping Market Outlook
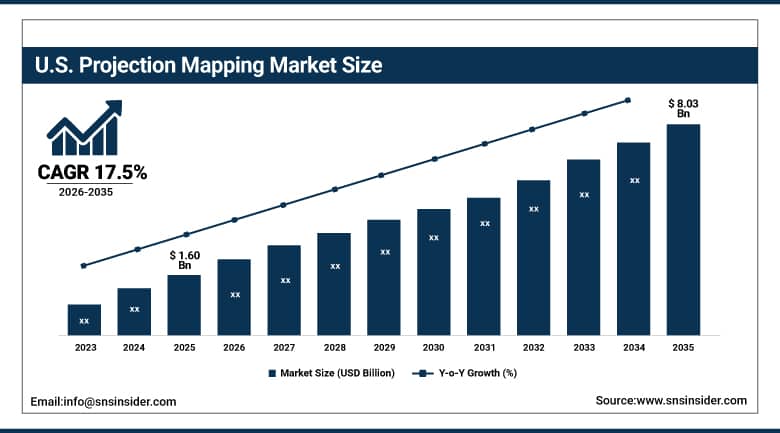
The U.S. Projection Mapping Market was valued at approximately USD 1.60 Billion in 2025 and is projected to reach approximately USD 8.03 Billion by 2035, registering a CAGR of approximately 17.5% from 2026 to 2035.
One of the biggest markets in the world projection mapping was the United States in 2025 because the adoption rate of immersive digital display technology grew significantly among entertainment firms, advertising firms, and event planners. There was extensive use of projection mapping technology in music concerts, sports activities, museums, new product launches, and even in amusement parks with significant requirements for high-definition projectors, 3D visualization software, and interactive projection mapping technology. The growth of marketing activities through digital art projects and large entertainment activities further intensified competition in the market with Hollywood production companies, live entertainment companies, and foreign advertising agencies headquartered in the United States emerging as major technology users.
In August 2025, Panasonic Projector & Display Americas confirmed that it would continue its role as the Exclusive Projection Technology Sponsor for an important American live entertainment event.
Projection Mapping Market Segment Analysis
-
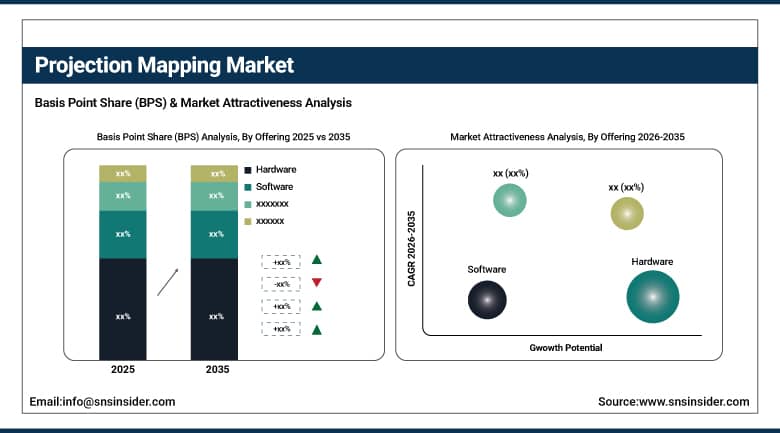
By Offering, Hardware led the market with an estimated 61.2% share in 2025, while Software was the fastest-growing offering, tracking a projected 30.1% CAGR as subscription-based delivery models gained traction.
-
By Dimension, 2D projection mapping accounted for a substantial share of revenue in 2025 owing to its flexibility and cost-effectiveness, while 3D projection mapping was the fastest-growing dimension category.
-
By Application, Large Venues & Facades led with an estimated 28.7% share in 2025, while Theme Parks & Attractions were the fastest-growing application, tracking a projected 25.9% CAGR.
Hardware Leads the Offering Segment While Software Grows Fastest
Hardware accounted for the largest offering share in 2025, at an estimated 61.2%, reflecting the capital intensity of laser projectors, media servers, and rigging frames that every projection mapping deployment fundamentally required. That physical infrastructure layer, essential regardless of the sophistication of the content or software layered on top of it, kept hardware the largest single revenue category across the market.
Software recorded the fastest growth among offerings in 2025, tracking a projected 30.1% CAGR, as subscription models continued converting one-off capital outlays into recurring operating expenses that corporate finance teams increasingly preferred. AI-driven platforms performing auto-UV unwrapping, texture generation, and edge-blend optimization kept compressing deployment timelines considerably, and cloud-software providers achieving gross margins above 60%, well ahead of the mid-20s margins typical of projector hardware manufacturing, continued attracting disproportionate investor capital into software-centric challengers.
2D Mapping Retains Largest Share While 3D Mapping Grows Fastest
The revenue generated from 2D projection mapping was significant in 2025 because of the great flexibility and low costs involved compared to 3D and 4D which were relatively more complex in nature. The ease in application and capacity to offer immersive visuals ensured that 2D projection mapping remained the most favored form of mapping when artists sought to turn walls and building structures into artistic visual displays.
3D projection mapping showed faster growth in 2025 because of the increasing need to create immersive visual experiences across different industries. With advancements in computer modeling, real time rendering and calibration technologies, 3D mapping projects were able to create illusions of motion and depth that could not be achieved by 2D mapping projects, hence faster growth for the category than the dominant 2D mapping category.
Large Venues Lead Application Mix While Theme Parks Grow Fastest
Large Venues & Facades accounted for the largest application share in 2025, at an estimated 28.7%, as civic leaders across major cities continued seeking eye-catching nighttime visual icons to promote tourism and cultural identity. Building-facade projections during national holidays and public awareness campaigns kept this application category the market's largest single revenue source, and strict light-pollution and facade-protection codes at heritage sites continued shaping how these installations were designed and approved.
Theme Parks & Attractions recorded the fastest growth among applications in 2025, tracking a projected 25.9% CAGR, as operators sought differentiated storytelling to redefine guest immersion. Disney's Shadows of Memory demonstrated measurable throughput gains by distributing crowds across previously underutilized plaza space, and as theme park operators increasingly recognized projection mapping's ability to simultaneously enhance guest experience and generate merchandise and food and beverage upsell over a multi-year operating window, investment in this application category kept accelerating ahead of every other segment tracked in this market.
Regional Analysis
|
Region |
Major Country |
Share within Region, 2025 (%) |
|---|---|---|
|
North America |
United States |
82.60% |
|
Europe |
Germany |
24.60% |
|
Asia Pacific |
China |
31.15% |
|
Middle East & Africa |
UAE |
28.90% |
|
Latin America |
Brazil |
34.40% |
North America Projection Mapping Market Insights
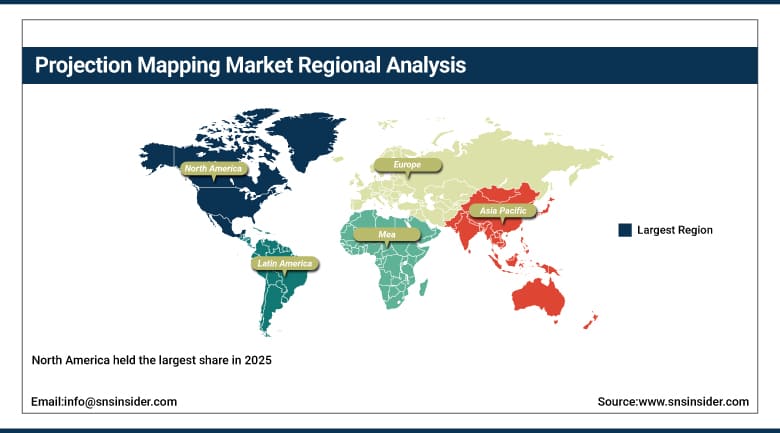
North America held the largest share in 2025, supported by a strong entertainment and events industry combined with high investment in immersive media across the region. Hollywood studios, live entertainment companies, and global advertising agencies headquartered in the region remained primary technology adopters, sustaining North America's leading position even as Asia Pacific's growth rate continued closing the gap.
The United States accounted for roughly 82.60% of regional revenue in 2025, contributing approximately 32% of total global market value on its own, anchored by its deep concentration of entertainment, advertising, and live-event production companies. Canada added further regional demand through its own growing events and tourism sector, and that combined regional strength kept North America the largest addressable market for projection mapping vendors through the forecast period.
Get Customized Report as Per Your Business Requirement - Enquiry Now
Europe Projection Mapping Market Insights
Europe held a meaningful share with countries including Germany, the UK, and France increasingly using projection mapping for cultural festivals, public installations, and commercial exhibitions. That combination of cultural programming and commercial event demand kept European adoption climbing steadily across the region's major economies.
Germany led regional demand at roughly 24.60% of European revenue, supported by its strong events and commercial exhibition sector. The UK and France contributed substantial additional demand through their own cultural festival and public installation programs, and continued European investment in immersive event technology should keep regional demand for projection mapping climbing through the forecast period.
Asia Pacific Projection Mapping Market Insights
Asia Pacific was the fastest-growing region tracking a CAGR of approximately 27.6% and positioned to overtake North America's growth trajectory over the coming years. Large-scale smart-city programs and expanding domestic projector manufacturing capability continued driving rapid regional growth, supported by booming tourism and retail sectors across the region's largest economies.
China led the region, supported by its expanding domestic manufacturing base and growing retail and tourism-driven demand for projection-based installations. Japan and South Korea contributed meaningful additional demand, with countries across the region innovating with projection-based installations in malls, hotels, and smart-city infrastructure, and India's rapidly growing urban centers and government-backed digital infrastructure initiatives continuing to expand the region's addressable market.
MEA & Latin America Projection Mapping Market Insights
The Middle East & Africa region and Latin America both experienced significant market adoption for Projection Mapping Market in 2025, owing to the investment from the Middle East region in large-scale cultural and tourism projects that incorporated projection mapping technology. Latin America also witnessed a consistent adoption trend over the period under review, driven by the use of projection mapping technology in carnival projects and urban renewal projects.
In the Middle East & Africa region, UAE was the leader with around 28.90% of regional revenues, owing to the considerable investments made by the country in large-scale cultural and tourism projects. Saudi Arabia added more regional demand with the help of its own national branding and tourism development initiatives. In Latin America, Brazil emerged as the leader in terms of regional revenue share with around 34.40%, owing to the use of projection mapping in carnival projects and urban renewal projects.
Market Dynamics
Growth Drivers: Rising Live Event Adoption and Immersive Experience Demand
One of the main factors is the increasing use of projection mapping in live events and outdoor displays because consumer demands for immersion and entertainment kept rising. More than 65% of concerts, festivals, and sports events used this technology for stage design and interactive storytelling in their performances and activities.
World cities continued using projections on buildings for national celebrations and public awareness campaigns in 2025, and the film and game industry kept applying projection mapping technology in the previsualization and simulations, which saved post-production costs and increased creativity. Education establishments and museums started using projection mapping more often in creating interactive environments for education and entertainment, and all these needs helped to ensure the steady growth of the market.
Restraints: High Setup Costs and Skilled Workforce Dependence
Expensive initial installation cost, the difficulty of installation and operation, and reliance on highly skilled labor continued to be the reasons why the projection mapping was not adopted by many in developing areas that were still unaware of what the technology can do for them. Traditional rigging methods, wherein the costs of rigging sometimes comprised up to 30% of the budget allocation for the entire project, also created an additional barrier compared with new short throw methods.
New tariffs imposed by the United States in 2025 also contributed in determining the sources and the costs of the projection mapping technology, forcing companies to consider nearshoring and local partnerships with other suppliers. Companies also started re-negotiations of maintenance and software contracts due to compliance issues along with longer delivery time for equipment.
Opportunities: AI Content Automation and Theme Park Expansion
Integration of artificial intelligence and augmented reality technologies represent a genuinely significant opportunity, as AI-driven content adaptation and real-time data visualization capability continued expanding what large-scale projection mapping installations could deliver. Vendors offering genuinely automated content creation tools, reducing dependence on specialized production labor, stood to capture meaningful share as mid-budget corporate and retail customers entered the market.
Rapid expansion of theme park and attraction applications offered a second substantial opportunity, as this application segment's fastest-growing status among all categories tracked in this market reflected operators' genuine appetite for differentiated, throughput-improving guest experiences. As theme park operators increasingly recognized projection mapping's dual ability to enhance storytelling while generating measurable operational and revenue benefits, vendors with proven, large-scale installation capability stood to capture meaningful share of this rapidly expanding, high-value application category.
Recent Developments:
-
March 2025: Disney unveiled Shadows of Memory, A Skywalker Saga, its first projection-mapping show at Galaxy's Edge, demonstrating hourly guest throughput gains of 18% by distributing crowds across previously underutilized plaza space.
-
September 2025: Christie announced it would showcase a lineup of smart display solutions, including projection, direct-view LED, and content management innovations, at InfoComm India 2025 in Mumbai.
-
2025: Christie Digital Systems introduced advanced AI-powered projection mapping and content synchronization technologies, while Sharp NEC Display Solutions launched upgraded cloud-based projection management and immersive visualization platforms.
Projection Mapping Market key players are:
-
Panasonic Corporation
-
Seiko Epson Corporation
-
Barco NV
-
Christie Digital Systems USA, Inc.
-
BenQ Corporation
-
Sharp NEC Display Solutions
-
ViewSonic Corporation
-
Vivitek Corporation
-
Green Hippo Ltd.
-
AV Stumpfl GmbH
-
Mediacraft GmbH
-
Pixel Rain Digital
-
Obscura Digital, Inc.
-
Quince Imaging, Inc.
-
Lumenarius
-
3D Mapping Factory
-
disguise (d3 Technologies Ltd.)
-
Derivative Inc. (TouchDesigner)
-
Resolume B.V.
-
Scintilla
Projection Mapping Market Report Scope:
| Report Attributes | Details |
|---|---|
| Market Size in 2025 | USD 5.00 Billion |
| Market Size by 2035 | USD 26.17 Billion |
| CAGR | CAGR of 18.00% From 2026 to 2035 |
| Base Year | 2025 |
| Forecast Period | 2026-2035 |
| Historical Data | 2022-2024 |
| Report Scope & Coverage | Market Size, Segments Analysis, Competitive Landscape, Regional Analysis, DROC & SWOT Analysis, Forecast Outlook |
| Key Segments | • By Offering (Hardware, Software, Services) • By Dimension (2D, 3D, 4D) • By Application (Large Venues & Facades, Events & Festivals, Theme Parks & Attractions, Sports Arenas & Stadiums, Advertising & Marketing, Corporate Events, Museums & Exhibitions) |
| Regional Analysis/Coverage | North America (US, Canada, Mexico), Europe (Eastern Europe [Poland, Romania, Hungary, Turkey, Rest of Eastern Europe] Western Europe] Germany, France, UK, Italy, Spain, Netherlands, Switzerland, Austria, Rest of Western Europe]), Asia Pacific (China, India, Japan, South Korea, Vietnam, Singapore, Australia, Rest of Asia Pacific), Middle East & Africa (Middle East [UAE, Egypt, Saudi Arabia, Qatar, Rest of Middle East], Africa [Nigeria, South Africa, Rest of Africa], Latin America (Brazil, Argentina, Colombia, Rest of Latin America) |
| Company Profiles | Panasonic Corporation, Seiko Epson Corporation, Barco NV, Christie Digital Systems USA, Inc., BenQ Corporation, Sharp NEC Display Solutions, ViewSonic Corporation, Vivitek Corporation, Green Hippo Ltd., AV Stumpfl GmbH, Mediacraft GmbH, Pixel Rain Digital, Obscura Digital, Inc., Quince Imaging, Inc., Lumenarius, 3D Mapping Factory, disguise (d3 Technologies Ltd.), Derivative Inc. (TouchDesigner), Resolume B.V., Scintilla |
Frequently Asked Questions
The Projection Mapping Market is expected to grow at a CAGR of approximately 18.0% from 2026 to 2035, based on triangulated secondary research estimates.
The Projection Mapping Market was valued at approximately USD 5.00 Billion in 2025, based on triangulation across multiple independent research sources.
The major growth factor is rising adoption in live events and public displays, driven by growing consumer expectations for immersive and engaging visual experiences.
The Hardware segment dominated the Projection Mapping Market by offering, representing an estimated 61.2% of revenue in 2025.
North America dominated the Projection Mapping Market in 2025, contributing approximately 32% of total global market value through the United States alone.
