Pyrolytic Boron Nitride Market Report Scope & Overview:
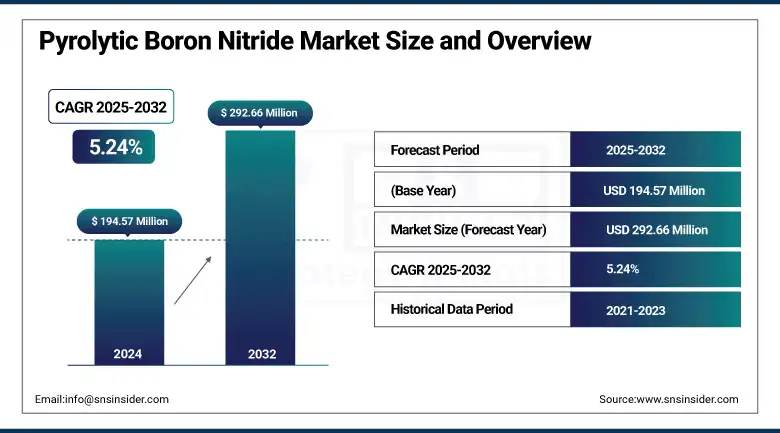
The Pyrolytic Boron Nitride Market size was valued at USD 194.57 million in 2024 and is expected to reach USD 292.66 million by 2032, growing at a CAGR of 5.24% over the forecast period of 2025-2032.
The pyrolytic boron nitride market is witnessing a high rate of growth due to the expanding usage in semiconductors, OLED & LED manufacturing, and EV power electronics, due to superior PBN performance for thermal stability and electrical insulation. Prominent pyrolytic boron nitride market trends involve the application of the product in high-temperature furnaces and crystal growth.
To Get more information On Pyrolytic Boron Nitride Market - Request Free Sample Report
-
For instance, Momentive Performance Materials revealed in December 2025 a 50% expansion of its Ohio facility for boron nitride powder, strengthening robust pyrolytic boron nitride market size growth.
Meanwhile, companies including Shin-Etsu Chemical Co., Ltd. and others that develop pyrolytic boron nitride are expanding their business in the boron nitride line of materials through their advanced ceramics departments. The increasing government support for inert ceramics in the aerospace and energy industries will further propagate the growth of the pyrolytic boron nitride market. The North American pyrolytic boron nitride business continues to lead with innovative products and a secure supply chain, which further strengthens the pyrolytic boron nitride market analysis for applications.
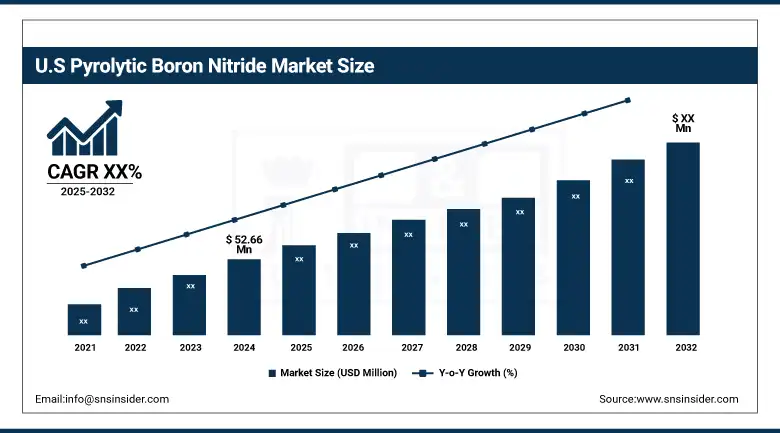
The U.S. leads the North America pyrolytic boron nitride market with a a market valuation of USD 52.66 million in 2024 with a market share of around 72%.
Pyrolytic Boron Nitride Market Drivers:
-
DOE‐reported OLED Manufacturing Energy Savings Validate Pyrolytic Boron Nitride Market trends
The U.S. Department of Energy has estimated that mass roll-to-roll OLED manufacturing would save the equivalent of 0.22 quadrillion BTU of energy each year, and would reduce emissions by 3.7 million metric tons.
Thus, pyrolytic boron nitride is no less than a key player in the development of these sustainable results, with it being a necessary part of any OLED crucibles and furnace linings. This trend proffers a bifold pedestal to the pyrolytic boron nitride market growth, with the focus on making energy-efficient manufacturing facilities top-of-the-line, per the mandatory environmental framework and technological innovation.
-
Emerging Defense and Nuclear Uses Expand High-Temperature Pyrolytic Boron Nitride demand
According to the Advanced Research Projects Agency–Energy (ARPA–E), boron nitride has been used for radiation detection and shielding applications given its small size and high gamma rejection. It further contributes to neutron detectors and aerospace components for defense applications, and small nuclear reactors. Thus, moving out of electronics helps in driving pyrolytic boron nitride market trends and also enables pyrolytic boron nitride companies to extract further value in high-reliability fields, such as defense and space, thus solidifying the application space of the boron nitride market.
Pyrolytic Boron Nitride Market Restraints:
-
High Capital Expenditure for CVD Production Limits New Market Entrants, Impeding Market Growth
Chemical vapor deposition (CVD), which is necessary to manufacture pyrolytic boron nitride, has expensive infrastructure. The cost of equipping Momentive's facility was USD 5.8 million, and newcomers to the market also face the capital cost barrier. Smaller firms also tend not to be capable of receiving operational grants, such as the Ohio Third Frontier, which will eventually be USD 918,000, because they happen not to have been at the right place at the right time. This limits the entry of new competitors in the pyrolytic boron nitride business and leads to a concentrated pyrolytic boron nitride market share with established North American players.
Pyrolytic Boron Nitride Market Segmentation Analysis:
By Grade
In 2024, high-purity grade led with a 55.2% share. The majority of the high-purity pyrolytic boron nitride is known for its very high purity as well as thermal conductivity, which makes it suitable for semiconductor wafer handling and crucible applications. Over half of the sales of its advanced ceramics are devoted to high-purity material, and Shin-Etsu Chemical Co., Ltd. says that this is contributing to the expansion of its share of the pyrolytic boron nitride market in North America. Fabs have stringent contamination near-zero requirements, and government initiatives to spur domestic supply chains have driven this dominance.
Ultra-pure grade, driven by next generation chip and gallium-nitride device manufacturing is the fastest growing segment at 5.44% CAGR. Momentive Performance Materials expects growing demand for high-purity crucibles and coatings utilized in compound semiconductor epitaxy, compatible with DOE efforts to increase domestic GaN LED production efficiency.
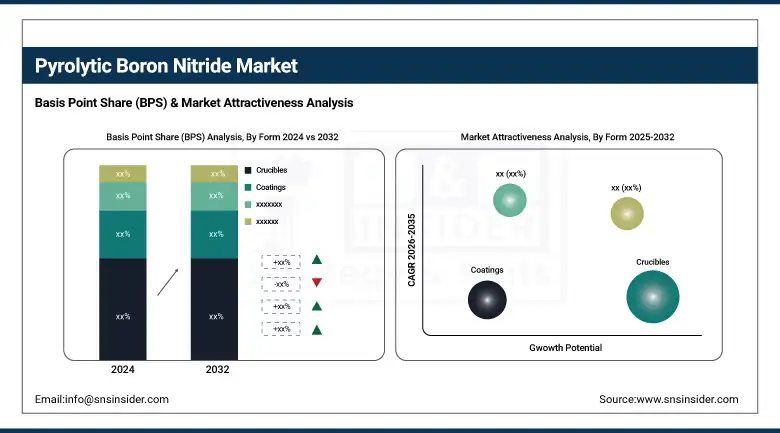
By Form
In 2024, the Crucible dominated and accounted for the largest market share of 47.5%. This dominance is based on its common application as substrate material in a multitude of CVD and MOCVD reactors for semiconductor and LED substrate elaboration. The U.S. Department of Energy reports that the use of high-temperature crucibles protected by pyrolytic boron nitride linings reduces particulate contamination by 30%, increasing yield for advanced PBN processes. Shin-Etsu and Morgan Advanced Materials are the major companies producing crucibles in huge quantities in the North American market for pyrolytic boron nitride.
Coatings are the fastest growing type, with a CAGR of 8.9% due to vacuum systems providers using PBN liners to increase furnace life and improve thermal uniformity. With a 40% reduction in maintenance downtime in semiconductor deposition systems, PBN coatings are driving market expansion, according to ARPA-E.
By Application
In 2024, Furnace components led with a 35.1% share. Pyrolytic boron nitride liners and heaters for high-temperature vacuum processing in semiconductor and materials research require extreme temperature stability and chemical inertness. PBN-lined furnaces, which have ensured ±2 °C uniformity at 1,200 °C, have been reported by the U.S. National Institute of Standards and Technology to enhance the quality of crystal growth. This segment is powered by major suppliers, including 3M, Saint-Gobain Ceramics & Plastics, and others.
The fastest growing application is OLED & LED production at a 6.75% CAGR where PBN crucibles and boats make it possible to accurately evaporate organic compounds and rare metals. According to the Department of Energy, the PBN crucibles have lowered contamination levels of organic emitters by 25%, thus boosting device efficacy and continuing the sustainable lighting Pyrolytic Boron Nitride Market Trends.
By End-Use Industry
In 2024, electronics & semiconductors were the leading end users, accounting for 36.2%. This segment is driven by demand from wafer fabrication and power device assembly, where PBN dielectric strength and thermal conductivity meet stringent semiconductor industry specifications. PBN components cut defect rates by 20% in high-volume fabs, according to the Semiconductor Industry Association, further affirming North America's pyrolytic boron nitride industry statistics.
The fastest-growing end-use is optoelectronics, where CAGR is 6.31%, driven by the development of micro-LED displays and VCSEL production. Government support in terms of grants provided through the DOE’s display technology is a testament to the contribution PBNs have made to bettering thermal management and device longevity, which is focused on the pyrolytic boron nitride market growth in this space.
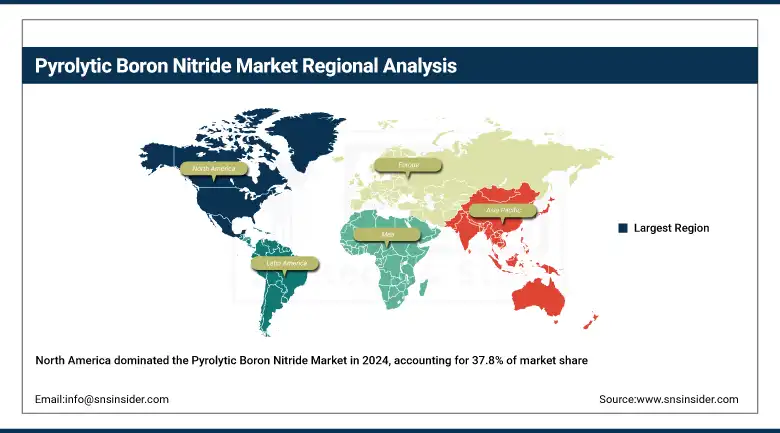
Pyrolytic Boron Nitride Market Regional Outlook:
North America dominates the pyrolytic boron nitride market at 37.8%, supported by the presence of large semiconductor fabs and materials R&D centers in the U.S. and Canada. CVD equipment is in high demand for high-purity PBN (polycrystalline boron nitride) crucibles and coatings due to the U.S. wafer starts comprising 28.4% of global capacity, according to the Semiconductor Industry Association. These aforementioned natural resources Canada grants for EV power electronics research further add to the North American pyrolytic boron nitride market size. Shin-Etsu and Momentive have large production sites in Ohio and Ontario, providing a good base to secure supply chains producing more advanced PBN technology applications.
Get Customized Report as per Your Business Requirement - Enquiry Now
Europe follows with a 25.6% share, powered by Germany’s precision ceramics sector and France’s aerospace composites activities. PBN liner development for high-temperature reactors was supported by the European Commission under Horizon 2020 and led to increased furnace uptime by 20% in German crystal growth establishments. The micro-LED pilot lines in Italy are equipped with PBN evaporation boats, the key feature of which is an integrated thermal control system, providing a glimpse of other boron nitride market trends toward various applications. Europe’s stable pyrolytic boron nitride industry share is also supported by government and association initiatives.
Asia Pacific is the fastest-growing region, with a 6.02% CAGR driven by China’s expansion in compound semiconductor and gallium nitride device manufacturing. The Chinese Ministry of Industry and Information Technology allocated USD 120 million in 2023 to PBN research for 5G infrastructure, accelerating local boron nitride market growth. South Korea’s display manufacturers also increased PBN crucible procurement by 30% to support advanced OLED production. These investments cement Asia Pacific’s leadership in advanced PBN technology adoption.
Latin America is witnessing significant growth in the market due to Brazil’s growing investments in domestic semiconductor and renewable energy R&D. In 2024, the Brazilian Ministry of Science and Technology announced a USD 50 million grant for PBN applications in the solar inverter industry, cutting thermal management expenses by 15%. The automotive electronics industry in Mexico followed by employing PBN-lined furnaces to enhance the yield of the components. Such government programs are proliferating the boron nitride material ecosystem, which in turn will assist in increasing the Latin American pyrolytic boron nitride market share.
The Middle East and Africa, powered by the Gulf and South Africa’s nuclear and aerospace research, are experiencing dramatic expansion. According to the IAEA, the PBN-coated items are installed in the Barakah Plant of the UAE to increase the lifespan of reactor instrumentation by 25%. Similarly, the NEOM project of Saudi Arabia includes PBN liners for high-temperature materials testing. These are some of the active pyrolytic boron nitride companies globally. Innovations taken by companies and the pyrolytic boron nitride market trends. Boron nitride market players and their growth strategies. These strategies have led to the expansion of the application areas of BN, thereby increasing its demand in the market.
Pyrolytic Boron Nitride Market Companies are:
The major pyrolytic boron nitride companies include Shin-Etsu Chemical Co., Ltd., Momentive Performance Materials Inc., Morgan Advanced Materials, Saint-Gobain Ceramics & Plastics, Inc., 3M Company, Denka Company Limited, H.C. Starck Solutions (TANIOBIS), Mitsubishi Chemical Corporation, Precision Ceramics USA, and Innovacera Technical Ceramic Solutions.
Recent Developments:
-
In August 2023, Morgan Advanced Materials’ H1 2023 interim results highlighted 5.6% organic growth in its faster-growing markets, reflecting rising demand for PBN-based crucibles and coatings in semiconductor and LED production
-
In October 2024, DOE’s Office of Science announced up to $500 million in “Open Call” funding, explicitly encouraging proposals in advanced ceramics, including PBN, for clean-energy applications
| Report Attributes | Details |
|---|---|
| Market Size in 2024 | USD 194.57 million |
| Market Size by 2032 | USD 292.66 million |
| CAGR | CAGR of 5.24% From 2025 to 2032 |
| Base Year | 2024 |
| Forecast Period | 2025-2032 |
| Historical Data | 2021-2023 |
| Report Scope & Coverage | Market Size, Segments Analysis, Competitive Landscape, Regional Analysis, DROC & SWOT Analysis, Forecast Outlook |
| Key Segments | •By Grade (High Pure, Ultra Pure) •By Form (Crucibles, Plates, Coatings, Tubes, Rods, Nozzles, Custom Shapes) •By Application (Semiconductor Manufacturing, OLED & LED Production, Crystal Growth, Furnace Components, Thin Film Deposition, Aerospace & Defense Components, Vacuum Technology, Others) •By End-Use Industry (Electronics & Semiconductors, Optoelectronics, Aerospace & Defense, Energy & Power, Research Laboratories, Industrial Manufacturing, Others) |
| Regional Analysis/Coverage | North America (US, Canada, Mexico), Europe (Germany, France, UK, Italy, Spain, Poland, Turkey, Rest of Europe), Asia Pacific (China, India, Japan, South Korea, Singapore, Australia, Rest of Asia Pacific), Middle East & Africa (UAE, Saudi Arabia, Qatar, South Africa, Rest of Middle East & Africa), Latin America (Brazil, Argentina, Rest of Latin America) |
| Company Profiles | Shin-Etsu Chemical Co., Ltd., Momentive Performance Materials Inc., Morgan Advanced Materials, Saint-Gobain Ceramics & Plastics, Inc., 3M Company, Denka Company Limited, H.C. Starck Solutions (TANIOBIS), Mitsubishi Chemical Corporation, Precision Ceramics USA, and Innovacera Technical Ceramic Solutions |
Frequently Asked Questions
The North America Pyrolytic Boron Nitride Market ranks second with 24.3% share, led by strict FDA regulations and rising construction.
Sustainable digitalized processes are key Pyrolytic Boron Nitride Market trends driving cleaner production in pharmaceutical and food industries.
Leading Pyrolytic Boron Nitride Companies include USG Corporation, Saint-Gobain, PABCO, and Yoshino Gypsum.
The Pyrolytic Boron Nitride Market share is led by pharmaceuticals due to FDA-grade excipient use in tablets and capsules.
The Pyrolytic Boron Nitride Market is expected to reach USD 18.11 billion by 2032 due to increasing demand across multiple industries.
Get in Touch
