Ready-to-Drink Beverages Market Report Scope & Overview:
Get More Information on Ready-to-Drink Beverages Market - Request Sample Report
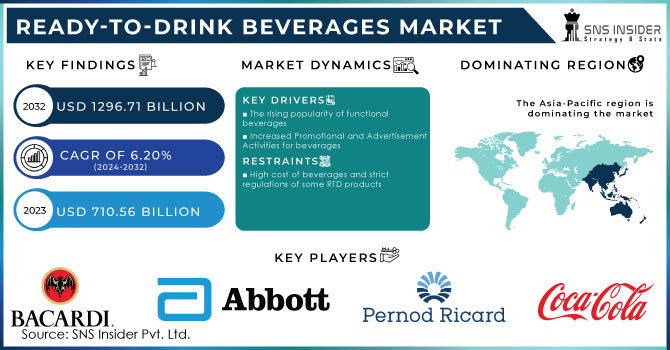
The Ready-to-Drink Beverages Market size was valued at USD 710.56 billion in 2023 and is expected to reach USD 1296.71billion by 2032 and grow at a CAGR of 6.20% over the forecast period of 2024-2032.
Ready-to-drink (RTD) beverages are those that have been packaged and are ready to drink without further preparation. They are usually marketed in single-serve containers like cans, bottles, or pouches. RTD drinks can be alcoholic or non-alcoholic. Consumers, particularly fitness freaks, are shifting toward ready-to-drink beverages with functional benefits as health and wellness trends rise. Functional ready-to-drink beverages are high in protein, probiotics, and antioxidants while being low in sugar. Furthermore, dairy-free and vegan drinks are gaining popularity among lactose-intolerant persons as healthful on-the-go beverages. According to Nielsen, enhanced RTDs will account for 15% of overall impulse category sales in 2023.
Ready-to-drink tea will most certainly be the next functional crowd-pleaser as new varieties such as herbal tea, iced tea, black tea, and others are produced to service the world's large consumer base. Furthermore, producers are developing low-calorie items or including zero-calorie sweeteners such as stevia. In order to improve the functionality of the items, they are also integrating herbs and Ayurvedic substances. This, together with the growing diabetes population around the world, is expected to fuel demand for these drinks as an alternative to carbonated beverages.
MARKET DYNAMICS
KEY DRIVERS
-
The rising popularity of functional beverages
-
Increased Promotional and Advertisement Activities for beverages
Social media has changed consumer purchasing behavior all around the world. As a result, increased promotions of ready-to-drink beverages such as RTD Tea, Coffee, Dairy products, Energy and sports drinks, Fortified Water, Carbonated drinks, and other types of beverages on various social media channels help market growth. Leading businesses, including Coca-Cola, Nestle, and Tropicana, have turned to social media platforms such as Facebook, Instagram, and YouTube in recent years to engage a broad consumer base through promotional efforts. Social media platforms also serve to expand the reach of smaller businesses or start-up brands that require larger advertising budgets or, in some situations, an offline presence.
RESTRAIN
-
High cost of beverages and strict regulations of some RTD products
High taxes on RTD beverages can make them more expensive for consumers, resulting in lower demand. In India, for example, the excise duty on carbonated soft drinks is 40%, one of the highest in the world. Many nations have strict rules that limit the quantity of caffeine and sugar that can be used in RTD beverages. The European Union, for example, limits the caffeine amount in RTD beverages to 150 milligrams per 100 milliliters. As a result, India's use of carbonated soft drinks has decreased. RTD beverages must also be labeled with information such as the ingredients, nutritional value, and caffeine content.
OPPORTUNITY
-
Premium drinks and different flavors of beverages
Customers are increasingly willing to spend more for premium RTD beverages with higher taste, quality, and packaging, as well as a wide range of flavors. The growing desire for luxury beverages, the appeal of ethnic cuisines, and the growing understanding of the health advantages of various fruits and vegetables are driving this trend. RTD beverage makers are responding to this trend by introducing new premium and flavored RTD beverages, as well as improving the quality of their existing RTD beverages.
CHALLENGES
-
Supply of counterfeit products
-
The increasing demand for healthier beverages
Customers are increasingly seeking better beverage options, and RTD beverages are under pressure to provide more healthy options. This is resulting in the development of new RTD beverages with less sugar, calories, or fat, or with added vitamins, minerals, or other nutrients.
IMPACT OF RUSSIA UKRAINE WAR
The war between Russia and Ukraine has had a substantial influence on the ready-to-drink (RTD) beverage sector. The war has hampered the supply of coffee from Ukraine, a significant supplier of coffee beans, as well as the supply of energy drinks from Russia, another key manufacturer of energy drinks. Some RTD beverage manufacturers have had to hike their prices as a result of the scarcity of materials. For example, since the commencement of the conflict, the price of Red Bull in Europe has risen by 15%. This is because the cost of raw ingredients, packaging materials, and transportation has risen. Some countries have seen a decrease in RTD beverage consumption as a result of the war. This is owing to the war's economic slump as well as the interruption of
IMPACT OF ONGOING RECESSION
Customers' purchasing habits have been influenced by the recession. Recessions can have a mixed effect on energy drink demand. On the one hand, during a recession, customers may resort to functional beverages and energy drinks for a pick-me-up. Consumers, on the other hand, may reduce their spending on beverages. The average yearly rate of inflation for food and drink was 19.2% in 2023, according to the Office of National Statistics (ONS). Food price increases have indirectly raised the prices of ready-to-drink beverages.
MARKET SEGMENTATION
by Product Type
-
RTD Tea
-
TRD Coffee
-
Dairy products
-
Energy drinks
-
Fortified and Flavoured Water
-
Carbonated drinks
-
Other
By Distribution Channel
-
Convenience/Grocery Stores
-
Specialty Retail Stores
-
Supermarkets/Hypermarkets
-
Online Stores
-
Other
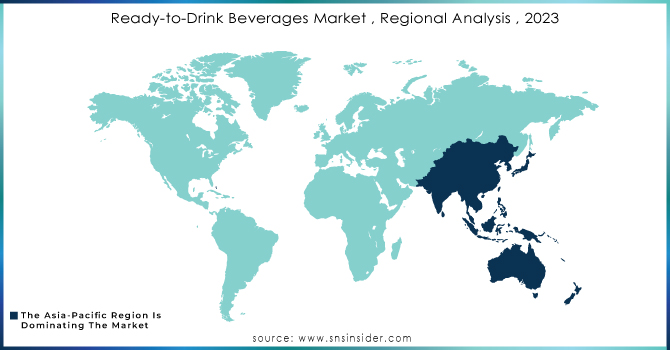
REGIONAL ANALYSIS
The Asia-Pacific region dominates the market for ready-to-drink beverages. The region's growing population, increased health consciousness, and rising per capita income are some of the primary reasons driving demand for ready-to-drink beverages in the Asia-Pacific region. Furthermore, sugar-free or lower-sugar energy drinks and natural ingredients are projected to prosper and continue to pique the curiosity of more people suffering from medical conditions such as diabetes.
Because of increased disease concerns, consumers prefer naturally sweetened or sugar-free ready-to-drink beverages in North America, which is driving rapid growth in the RTD beverages industry. The United States is North America's largest RTD beverage market, followed by Canada. According to new data, more than two-thirds (70%) of American customers choose a vodka-based ready-to-drink (RTD) beverage over any other liquor. Customers prefer gut health-improving and functional beverages such as energy drinks, Kombucha, and so on.
Europe has the substantial growth in the RTD beverage market due to concerns about environmental sustainability and the growing popularity of plant-based diets. As a result, industry participants are starting to increase their visibility in the RTD beverage market for plant-based products.
Latin America and Middle East and Africa regional market has a growing demand for beverages among customers due to rising awareness about the potential benefits of functional beverages and the nutritional value of fruits in drinks.
Need any customization research on Ready-to-Drink Beverages Market - Enquiry Now
REGIONAL COVERAGE
North America
-
US
-
Canada
-
Mexico
Europe
-
Eastern Europe
-
Poland
-
Romania
-
Hungary
-
Turkey
-
Rest of Eastern Europe
-
-
Western Europe
-
Germany
-
France
-
UK
-
Italy
-
Spain
-
Netherlands
-
Switzerland
-
Austria
-
Rest of Western Europe
-
Asia Pacific
-
China
-
India
-
Japan
-
South Korea
-
Vietnam
-
Singapore
-
Australia
-
Rest of Asia Pacific
Middle East & Africa
-
Middle East
-
UAE
-
Egypt
-
Saudi Arabia
-
Qatar
-
Rest of Middle East
-
-
Africa
-
Nigeria
-
South Africa
-
Rest of Africa
-
Latin America
-
Brazil
-
Argentina
-
Colombia
-
Rest of Latin America
KEY PLAYERS
The Coca-Cola Company, Abbott Laboratories Inc, Bacardi Limited, Pernod Richard, Suntory Holdings Ltd, Yakult Honsha Co. Ltd, PepsiCo, Del Monte Foods, Inc, Monster Beverage Corporation, Diageo PLC, Red Bull GmbH, Nestlé S.A. and other key players are mentioned in the final report
RECENT DEVELOPMENT
In 2023 The Coca-Cola brand partnered with whiskey Jack Daniel's, with RTD alcoholic cans reaching retailers across the UK market. The Coca-Cola Company intends to expand its presence in the alcoholic ready-to-drink sector.
In 2023 Tata Coffee Cold Brew was introduced by NourishCo, a subsidiary of Tata Consumer Products Limited (TPCL), as part of its effort to expand its functional beverages market. Tata Coffee Cold Brew, a reduced sugar content version priced at ₹125.
In 2023 Salud Beverages plans to invest capital of $1.5 million in order to expand its beverages in 10 new Indian markets.
In 2023 Global Brands-owned Hooch revealed a new range of caffeinated ready-to-drink (RTD) alcoholic beverages, called Soopa Hooch. The launch of Soopa Hooch comes with the enhanced RTD category, which comprises beverages promoted as alcoholic energy drinks, in the UK.
| Report Attributes | Details |
| Market Size in 2023 | US$ 710.56 Billion |
| Market Size by 2032 | US$ 1296.71 Billion |
| CAGR | CAGR of 6.20 % From 2024 to 2032 |
| Base Year | 2023 |
| Forecast Period | 2024-2032 |
| Historical Data | 2020-2022 |
| Report Scope & Coverage | Market Size, Segments Analysis, Competitive Landscape, Regional Analysis, DROC & SWOT Analysis, Forecast Outlook |
| Key Segments | • By Product Type (RTD Tea, TRD Coffee, Dairy products, Energy drinks, Fortified and Flavoured Water, Carbonated drinks, Other) • By Distribution Channel (Convenience/Grocery Stores, Specialty Retail Stores, Supermarkets/Hypermarkets, Online Stores, and Other) |
| Regional Analysis/Coverage | North America (US, Canada, Mexico), Europe (Eastern Europe [Poland, Romania, Hungary, Turkey, Rest of Eastern Europe] Western Europe] Germany, France, UK, Italy, Spain, Netherlands, Switzerland, Austria, Rest of Western Europe]), Asia Pacific (China, India, Japan, South Korea, Vietnam, Singapore, Australia, Rest of Asia Pacific), Middle East & Africa (Middle East [UAE, Egypt, Saudi Arabia, Qatar, Rest of Middle East], Africa [Nigeria, South Africa, Rest of Africa], Latin America (Brazil, Argentina, Colombia Rest of Latin America) |
| Company Profiles | The Coca-Cola Company, Abbott Laboratories Inc, Bacardi Limited, Pernod Richard, Suntory Holdings Ltd, Yakult Honsha Co. Ltd, PepsiCo, Del Monte Foods, Inc, Monster Beverage Corporation, Diageo PLC, Red Bull GmbH, Nestlé S.A. |
| Key Drivers | • The rising popularity of functional beverages • Increased Promotional and Advertisement Activities for beverages |
| Market Challenges | • Supply of counterfeit products • The increasing demand for healthier beverages |
Frequently Asked Questions
Challenges are Supply of counterfeit products and The increasing demand for healthier beverages
USD 1296.71 billion is expected to grow by 2032.
Ready-to-Drink Beverages Market size was valued at USD 710.56 billion in 2023
Asia Pacific is dominating the market.
Ready-to-Drink Beverages Market is anticipated to expand by 6.20 % from 2024 to 2032.
Get in Touch
