image

Carotenoids Market Report Scope & Overview:

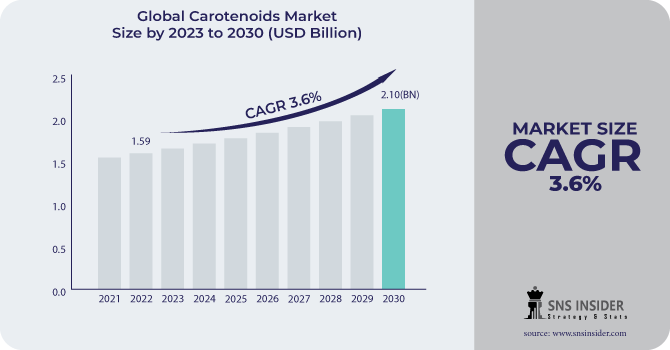
The Carotenoids Market size was USD 1.59 billion in 2022 and is expected to Reach USD 2.10 billion by 2030 and grow at a CAGR of 3.6 % over the forecast period of 2023-2030. 

Carotenoids are a class of natural pigments that are produced by plants, algae, and some bacteria. They are responsible for the yellow, orange, and red colors of many fruits, vegetables, and flowers. Carotenoids are also found in some animals, such as salmon and shrimp.

Carotenoids Market Revenue Analysis

The Carotenoids Market is segmented based on Type as Annatto, Canthaxanthin, Astaxanthin, Beta-carotene, Lutein, Zeaxanthin, Lycopene, and Others. Beta-carotene and Astaxanthin are the largest growing segment due to high utilization in end-user industries. These segments are two naturally occurring carotenoids that can be employed in a number of food and beverage applications. Consumers want more natural food and colorants. The industry is driven by the potential involvement of the aforementioned pigments in enhancing immunity, enhancing health, reducing diabetes, and providing several important health advantages.

By application, the animal feed segment is predicted to account for the largest market. The demand for nutrient-rich animal feed for domestic animals and cattle is rising.  Due to their coloring abilities, carotenoids are widely employed in animal nutrition products and are included in the coloration of fish, crustaceans, egg yolks, and broiler skin.

MARKET DYNAMICS

KEY DRIVERS

  • Increase demand for personal care and cosmetic products

  • Increasing Demand for Natural Colorant

As consumers seek more transparency in their food and beverages and as marketers tout the usage of natural colors, the buyer's purchasing interest rises. When the label specifies fruit and vegetable juices and concentrates as colorings included in the ingredient declaration, consumers have a favorable perception of the brand. Anthocyanins, such as grape skin extract, give fruits and vegetables their red, blue, and purple colors. Carotenoids, including lycopene in tomatoes and beta-carotene in carrots, provide a variety of colors from yellow to red. The carotenoid market is being driven by a growing awareness of and use of naturally occurring colors from sources like tomatoes and carrots.

RESTRAIN

  • High prices of carotenoids

Synthetic carotenoids are produced by chemical synthesis. The production of synthetic carotenoids process is less complex and less expensive, which makes it more affordable than natural carotenoids. Carotenoids are a group of natural pigments that are extracted from algae, plants, and bacteria. This process involves using solvents and other chemicals, which can add to the cost of the carotenoids.

OPPORTUNITY

  • Potential benefits of carotenoids

It is believed that dietary carotenoids have health benefits by lowering the risk of disease, especially some malignancies and eye conditions. Beta-carotene, lycopene, lutein, and zeaxanthin are the carotenoids that have been most extensively researched in this regard.  Carotenoids' antioxidant properties are thought to contribute in some measure to their positive benefits. Due to its capacity to be transformed into vitamin A, beta-carotene may offer additional advantages. Additionally, because lutein and zeaxanthin absorb harmful blue light that enters the eye, they may be preventive against eye illness. While a variety of fruits and vegetables contain these chemicals, tomatoes and tomato-related products are the main food sources of lycopene. Additionally, lutein and zeaxanthin can be found in egg yolks and are highly bioavailable. There are supplements that include these carotenoids.

CHALLENGES

  • Availability of synthetic carotenoids

Synthetic carotenoids are cheaper than natural carotenoids and they act as the best substitute, and they are often used in food and beverage products. This can pose a challenge to the natural carotenoids market.

IMPACT OF RUSSIA UKRAINE WAR

Russia and Ukraine are major producers of carotenoids, accounting for a combined share of 15% of the global market. The war has disrupted production and exports of carotenoids from Russia and Ukraine, leading to shortages in the global market. This is notably true for astaxanthin, a carotenoid used in dietary supplements, cosmetics, and aquaculture, among other uses. Prices for these goods have increased as a result of the scarcity of carotenoids. Astaxanthin, lutein, and zeaxanthin are produced in a BASF facility in Russia. War has caused Kemin Industries Inc. (Ukraine) and other important players to delay production.

IMPACT OF ONGOING RECESSION

The recession has impacted the global market of carotenoids. Food coloring used in the food sector is a significant source of carotenoids. Through 2022, the US market for food and beverage natural colors is anticipated to grow by 7.9% yearly. But the manufacture has been delayed because to carotenoid price increases. Natural carotenoid prices range from USD 350/kg to USD 7,500/kg, while synthetic carotenoid prices range from USD 250/kg to USD 2,000/kg. This difference in the prices is also the major reason for the manufacturers to choose synthetic carotenoids.

MARKET SEGMENTATION

By Type

  • Annatto

  • Astaxanthin

  • Beta-carotene

  • Canthaxanthin

  • Lutein

  • Lycopene

  • Zeaxanthin

  • Others

By Source

  • Natural

  • Synthetic

By Application

  • Animal Feed

  • Food & Beverages

  • Dietary Supplements

  • Cosmetics

  • Pharmaceuticals

Carotenoids Market Segmentation Analysis

REGIONAL ANALYSIS

Europe was the largest market, with revenue predicted to expand at a CAGR of 4.0% from 2022 to 2025 due to rising demand for health supplements and animal feed. The presence of prominent manufacturers such as Unilever, L'Oréal, Henkel, and Beiersdorf in the region is expected to be a major factor affecting growth in the region. Furthermore, rising food safety concerns in the United Kingdom are driving manufacturers to adopt clean labeling, fueling demand for carotenoids.

Asia-Pacific is the fastest-growing region, with an increasing number of customers opting for illness-prevention methods such as health supplements. Consumer-changing lifestyles and food consumption patterns have also contributed to the growth of the Asia-Pacific carotenoid market. Furthermore, economic expansion, technical developments, industrial growth, and low manufacturing costs in nations like as China, Japan, and India are expected to fuel the industry.

North America has the largest carotenoid marketowing to the growing demand for clean-label foods and health awareness. This market's expansion can be attributed to expanding awareness of the health advantages of carotenoids, rising demand for natural food colors, and rising demand for dietary supplements.

South America has grown significantly as the pharmaceutical and energy industries have expanded. These chemicals are increasingly being used in feed, food, supplements, cosmetic, and medicinal applications.

REGIONAL COVERAGE

North America

  • US

  • Canada

  • Mexico

Europe

  • Eastern Europe

    • Poland

    • Romania

    • Hungary

    • Turkey

    • Rest of Eastern Europe

  • Western Europe

    • Germany

    • France

    • UK

    • Italy

    • Spain

    • Netherlands

    • Switzerland

    • Austria

    • Rest of Western Europe

Asia Pacific

  • China

  • India

  • Japan

  • South Korea

  • Vietnam

  • Singapore

  • Australia

  • Rest of Asia Pacific

Middle East & Africa

  • Middle East

    • UAE

    • Egypt

    • Saudi Arabia

    • Qatar

    • Rest of Middle East

  • Africa

    • Nigeria

    • South Africa

    • Rest of Africa

Latin America

  • Brazil

  • Argentina

  • Colombia

  • Rest of Latin America

KEY PLAYERS

Some major key players in the Carotenoids Market are NovoNutrients, Kemin Industries, BASF SE, Allied Biotech, Brenntag, Cyanotech Corp., Chr. Hansen, D.D. Williamson, Divis Laboratories, DSM Nutritional Products, Naturex SA, Lycored., and other key players.

NovoNutrients-Company Financial Analysis

RECENT DEVELOPMENTS

In 2023, NovoNutrients announced an advancement in carotenoid manufacturing technology. For every ton of protein-rich component, the company's overall carbon capture technique upcycles nearly two tons of carbon dioxide.

In 2023, LifeMeter, a portable, non-invasive instrument proven to assess the amount of important antioxidants known as carotenoids, is being introduced by MacuHealth, the leader in novel eye supplements. At the 2023 Vision Source Exchange in San Antonio, Texas, a device demonstration is taking place.

Carotenoids Market Report Scope:
Report Attributes Details
Market Size in 2022  US$ 1.59 Billion
Market Size by 2030  US$ 2.10 Billion
CAGR   CAGR of 3.6 % From 2023 to 2030
Base Year 2022
Forecast Period  2023-2030
Historical Data  2019-2021
Report Scope & Coverage Market Size, Segments Analysis, Competitive  Landscape, Regional Analysis, DROC & SWOT Analysis, Forecast Outlook
Key Segments • By Type (Annatto, Canthaxanthin, Astaxanthin, Beta-carotene, Lutein, Zeaxanthin, Lycopene, and Others)
• By Source (Natural and Synthetic)
• By Application (Animal Feed, Dietary Supplements, Food & Beverages, Cosmetics, and Pharmaceuticals)
Regional Analysis/Coverage North America (US, Canada, Mexico), Europe (Eastern Europe [Poland, Romania, Hungary, Turkey, Rest of Eastern Europe] Western Europe] Germany, France, UK, Italy, Spain, Netherlands, Switzerland, Austria, Rest of Western Europe]), Asia Pacific (China, India, Japan, South Korea, Vietnam, Singapore, Australia, Rest of Asia Pacific), Middle East & Africa (Middle East [UAE, Egypt, Saudi Arabia, Qatar, Rest of Middle East], Africa [Nigeria, South Africa, Rest of Africa], Latin America (Brazil, Argentina, Colombia Rest of Latin America)
Company Profiles NovoNutrients, Kemin Industries, BASF SE, Allied Biotech, Brenntag, Cyanotech Corp., Chr. Hansen, D.D. Williamson, Divis Laboratories, DSM Nutritional Products, Naturex SA, Lycored.
Key Drivers • Increase demand for personal care and cosmetic products
• Increasing Demand for Natural Colorant
Market Restrain • High prices of carotenoids


Frequently Asked Questions

Ans: Carotenoids Market is anticipated to expand by 3.6 % from 2023 to 2030.

Ans: Drivers are increasing demand for personal care and cosmetic products and increasing Demand for Natural colorants.

Ans:   USD 2.10 billion is expected to grow by 2030.

Ans: Asia Pacific region is the fastest-growing in the Carotenoids Market.

Ans: Challenges are availability of synthetic carotenoids.

Table of Contents

1. Introduction
1.1 Market Definition
1.2 Scope
1.3 Research Assumptions

2. Research Methodology

3. Market Dynamics
3.1 Drivers
3.2 Restraints
3.3 Opportunities
3.4 Challenges

4. Impact Analysis
4.1 Impact of the Russia-Ukraine War
4.2 Impact of Ongoing Recession
4.2.1 Introduction
4.2.2 Impact on Major Economies
4.2.2.1 US
4.2.2.2 Canada
4.2.2.3 Germany
4.2.2.4 France
4.2.2.5 United Kingdom
4.2.2.6 China
4.2.2.7 Japan
4.2.2.8 South Korea
4.2.2.9 Rest of the World

5. Value Chain Analysis

6. Porter’s 5 forces model

7. PEST Analysis

8. Carotenoids Market Segmentation, By Type
8.1 Annatto
8.2 Astaxanthin
8.3 Beta-carotene
8.4 Canthaxanthin
8.5 Lutein
8.6 Lycopene
8.7 Zeaxanthin
8.8 Others

9. Carotenoids Market Segmentation, By Source
9.1 Natural
9.2 Synthetic

10. Carotenoids Market Segmentation, By Application
10.1 Animal Feed
10.2 Food & Beverages
10.3 Dietary Supplements
10.4 Cosmetics
10.5 Pharmaceuticals

11. Regional Analysis
11.1 Introduction
11.2 North America
11.2.1 North America Carotenoids Market by Country
11.2.2 North America Carotenoids Market by Type
11.2.3 North America Carotenoids Market by Source
11.2.4 North America Carotenoids Market by Application
11.2.5 USA
11.2.5.1 USA Carotenoids Market by Type
11.2.5.2 USA Carotenoids Market by Source
11.2.5.3 USA Carotenoids Market by Application
11.2.6 Canada
11.2.6.1 Canada Carotenoids Market by Type
11.2.6.2 Canada Carotenoids Market by Source
11.2.6.3 Canada Carotenoids Market by Application
11.2.7 Mexico
11.2.7.1 Mexico Carotenoids Market by Type
11.2.7.2 Mexico Carotenoids Market by Source
11.2.7.3 Mexico Carotenoids Market by Application
11.3 Europe
11.3.1 Eastern Europe
11.3.1.1 Eastern Europe Carotenoids Market by Country
11.3.1.2 Eastern Europe Carotenoids Market by Type
11.3.1.3 Eastern Europe Carotenoids Market by Source
11.3.1.4 Eastern Europe Carotenoids Market by Application
11.3.1.5 Poland
11.3.1.5.1 Poland Carotenoids Market by Type
11.3.1.5.2 Poland Carotenoids Market by Source
11.3.1.5.3 Poland Carotenoids Market by Application
11.3.1.6 Romania
11.3.1.6.1 Romania Carotenoids Market by Type
11.3.1.6.2 Romania Carotenoids Market by Source
11.3.1.6.4 Romania Carotenoids Market by Application
11.3.1.7 Turkey
11.3.1.7.1 Turkey Carotenoids Market by Type
11.3.1.7.2 Turkey Carotenoids Market by Source
11.3.1.7.3 Turkey Carotenoids Market by Application
11.3.1.8 Rest of Eastern Europe
11.3.1.8.1 Rest of Eastern Europe Carotenoids Market by Type
11.3.1.8.2 Rest of Eastern Europe Carotenoids Market by Source
11.3.1.8.3 Rest of Eastern Europe Carotenoids Market by Application
11.3.2 Western Europe
11.3.2.1 Western Europe Carotenoids Market by Type
11.3.2.2 Western Europe Carotenoids Market by Source
11.3.2.3 Western Europe Carotenoids Market by Application
11.3.2.4 Germany
11.3.2.4.1 Germany Carotenoids Market by Type
11.3.2.4.2 Germany Carotenoids Market by Source
11.3.2.4.3 Germany Carotenoids Market by Application
11.3.2.5 France
11.3.2.5.1 France Carotenoids Market by Type
11.3.2.5.2 France Carotenoids Market by Source
11.3.2.5.3 France Carotenoids Market by Application
11.3.2.6 UK
11.3.2.6.1 UK Carotenoids Market by Type
11.3.2.6.2 UK Carotenoids Market by Source
11.3.2.6.3 UK Carotenoids Market by Application
11.3.2.7 Italy
11.3.2.7.1 Italy Carotenoids Market by Type
11.3.2.7.2 Italy Carotenoids Market by Source
11.3.2.7.3 Italy Carotenoids Market by Application
11.3.2.8 Spain
11.3.2.8.1 Spain Carotenoids Market by Type
11.3.2.8.2 Spain Carotenoids Market by Source
11.3.2.8.3 Spain Carotenoids Market by Application
11.3.2.9 Netherlands
11.3.2.9.1 Netherlands Carotenoids Market by Type
11.3.2.9.2 Netherlands Carotenoids Market by Source
11.3.2.9.3 Netherlands Carotenoids Market by Application
11.3.2.10 Switzerland
11.3.2.10.1 Switzerland Carotenoids Market by Type
11.3.2.10.2 Switzerland Carotenoids Market by Source
11.3.2.10.3 Switzerland Carotenoids Market by Application
11.3.2.11.1 Austria
11.3.2.11.2 Austria Carotenoids Market by Type
11.3.2.11.3 Austria Carotenoids Market by Source
11.3.2.11.4 Austria Carotenoids Market by Application
11.3.2.12 Rest of Western Europe
11.3.2.12.1 Rest of Western Europe Carotenoids Market by Type
11.3.2.12.2 Rest of Western Europe Carotenoids Market by Source
11.3.2.12.3 Rest of Western Europe Carotenoids Market by Application
11.4 Asia-Pacific
11.4.1 Asia-Pacific Carotenoids Market by Country
11.4.2 Asia-Pacific Carotenoids Market by Type
11.4.3 Asia-Pacific Carotenoids Market by Source
11.4.4 Asia-Pacific Carotenoids Market by Application
11.4.5 China
11.4.5.1 China Carotenoids Market by Type
11.4.5.2 China Carotenoids Market by Application
11.4.5.3 China Carotenoids Market by Source
11.4.6 India
11.4.6.1 India Carotenoids Market by Type
11.4.6.2 India Carotenoids Market by Source
11.4.6.3 India Carotenoids Market by Application
11.4.7 Japan
11.4.7.1 Japan Carotenoids Market by Type
11.4.7.2 Japan Carotenoids Market by Source
11.4.7.3 Japan Carotenoids Market by Application
11.4.8 South Korea
11.4.8.1 South Korea Carotenoids Market by Type
11.4.8.2 South Korea Carotenoids Market by Source
11.4.8.3 South Korea Carotenoids Market by Application
11.4.9 Vietnam
11.4.9.1 Vietnam Carotenoids Market by Type
11.4.9.2 Vietnam Carotenoids Market by Source
11.4.9.3 Vietnam Carotenoids Market by Application
11.4.10 Singapore
11.4.10.1 Singapore Carotenoids Market by Type
11.4.10.2 Singapore Carotenoids Market by Source
11.4.10.3 Singapore Carotenoids Market by Application
11.4.11 Australia
11.4.11.1 Australia Carotenoids Market by Type
11.4.11.2 Australia Carotenoids Market by Source
11.4.11.3 Australia Carotenoids Market by Application
11.4.12 Rest of Asia-Pacific
11.4.12.1 Rest of Asia-Pacific Carotenoids Market by Type
11.4.12.2 Rest of Asia-Pacific Carotenoids Market by Source
11.4.12.3 Rest of Asia-Pacific Carotenoids Market by Application
11.5 Middle East & Africa
11.5.1 Middle East
11.5.1.1 Middle East Carotenoids Market by Country
11.5.1.2 Middle East Carotenoids Market by Type
11.5.1.3 Middle East Carotenoids Market by Source
11.5.1.4 Middle East Carotenoids Market by Application
11.5.1.5 UAE
11.5.1.5.1 UAE Carotenoids Market by Type
11.5.1.5.2 UAE Carotenoids Market by Source
11.5.1.5.3 UAE Carotenoids Market by Application
11.5.1.6 Egypt
11.5.1.6.1 Egypt Carotenoids Market by Type
11.5.1.6.2 Egypt Carotenoids Market by Source
11.5.1.6.3 Egypt Carotenoids Market by Application
11.5.1.7 Saudi Arabia
11.5.1.7.1 Saudi Arabia Carotenoids Market by Type
11.5.1.7.2 Saudi Arabia Carotenoids Market by Source
11.5.1.7.3 Saudi Arabia Carotenoids Market by Application
11.5.1.8 Qatar
11.5.1.8.1 Qatar Carotenoids Market by Type
11.5.1.8.2 Qatar Carotenoids Market by Source
11.5.1.8.3 Qatar Carotenoids Market by Application
11.5.1.9 Rest of Middle East
11.5.1.9.1 Rest of Middle East Carotenoids Market by Type
11.5.1.9.2 Rest of Middle East Carotenoids Market by Source
11.5.1.9.3 Rest of Middle East Carotenoids Market by Application
11.5.2 Africa
11.5.2.1 Africa Transfusion Diagnostics Market by Country
11.5.2.2 Africa Carotenoids Market by Type
11.5.2.3 Africa Carotenoids Market by Source
11.5.2.4 Africa Carotenoids Market by Application
11.5.2.5 Nigeria
11.5.2.5.1 Nigeria Carotenoids Market by Type
11.5.2.5.2 Nigeria Carotenoids Market by Source
11.5.2.5.3 Nigeria Carotenoids Market by Application
11.5.2.6 South Africa
11.5.2.6.1 South Africa Carotenoids Market by Type
11.5.2.6.2 South Africa Carotenoids Market by Source
11.5.2.6.3 South Africa Carotenoids Market by Application
11.5.2.7 Rest of Africa
11.5.2.7.1 Rest of Africa Carotenoids Market by Type
11.5.2.7.2 Rest of Africa Carotenoids Market by Source
11.5.2.7.3 Rest of Africa Carotenoids Market by Application
11.6 Latin America
11.6.1 Latin America Carotenoids Market by Country
11.6.2 Latin America Carotenoids Market by Type
11.6.3 Latin America Carotenoids Market by Source
11.6.4 Latin America Carotenoids Market by Application
11.6.5 Brazil
11.6.5.1 Brazil Carotenoids Market by Type
11.6.5.2 Brazil Carotenoids Market by Source
11.6.5.3 Brazil Carotenoids Market by Application
11.6.6 Argentina
11.6.6.1 Argentina Carotenoids Market by Type
11.6.6.2 Argentina Carotenoids Market by Source
11.6.6.3 Argentina Carotenoids Market by Application
11.6.7 Colombia
11.6.7.1 Colombia Carotenoids Market by Type
11.6.7.2 Colombia Carotenoids Market by Source
11.6.7.3 Colombia Carotenoids Market by Application
11.6.8 Rest of Latin America
11.6.8.1 Rest of Latin America Carotenoids Market by Type
11.6.8.2 Rest of Latin America Carotenoids Market by Source
11.6.8.3 Rest of Latin America Carotenoids Market by Application

12. Company profile
12.1 Kemin Industries
12.1.1 Company Overview
12.1.2 Financial
12.1.3 Products/ Services Offered
12.1.4 SWOT Analysis
12.1.5 The SNS View
12.2 NovoNutrients
12.2.1 Company Overview
12.2.2 Financials
12.2.3 Product/Services Offered
12.2.4 SWOT Analysis
12.2.5 The SNS View
12.3 BASF SE
12.3.1 Company Overview
12.3.2 Financials
12.3.3 Product/Services Offered
12.3.4 SWOT Analysis
12.3.5 The SNS View
12.4 Allied Biotech
12.4.1 Company Overview
12.4.2 Financials
12.4.3 Product/Services Offered
12.4.4 SWOT Analysis
12.4.5 The SNS View
12.5 Brenntag
12.5.1 Company Overview
12.5.2 Financials
12.5.3 Product/Services Offered
12.5.4 SWOT Analysis
12.5.5 The SNS View
12.6 Cyanotech Corp.
12.6.1 Company Overview
12.6.2 Financials
12.6.3 Product/Services Offered
12.6.4 SWOT Analysis
12.6.5 The SNS View
12.7 Chr. Hansen
12.7.1 Company Overview
12.7.2 Financials
12.7.3 Product/Services Offered
12.7.4 SWOT Analysis
12.7.5 The SNS View
12.8 DSM Nutritional Products
12.8.1 Company Overview
12.8.2 Financials
12.8.3 Product/Services Offered
12.8.4 SWOT Analysis
12.8.5 The SNS View
12.9 D.D. Williamson
12.9.1 Company Overview
12.9.2 Financials
12.9.3 Product/Services Offered
12.9.4 SWOT Analysis
12.9.5 The SNS View
12.10 Divis Laboratories
12.10.1 Company Overview
12.10.2 Financials
12.10.3 Product/Services Offered
12.10.4 SWOT Analysis
12.10.5 The SNS View
12.11 Lycored
12.11.1 Company Overview
12.11.2 Financials
12.11.3 Product/Services Offered
12.11.4 SWOT Analysis
12.11.5 The SNS View
12.12 Naturex SA
12.12.1 Company Overview
12.12.2 Financials
12.12.3 Product/Services Offered
12.12.4 SWOT Analysis
12.12.5 The SNS View

13. Competitive Landscape
13.1 Competitive Benchmarking
13.2 Market Share Analysis
13.3 Recent Developments
13.3.1 Industry News
13.3.2 Company News
13.3.3 Mergers & Acquisitions

14. Use Case and Best Practices

15. Conclusion

An accurate research report requires proper strategizing as well as implementation. There are multiple factors involved in the completion of good and accurate research report and selecting the best methodology to compete the research is the toughest part. Since the research reports we provide play a crucial role in any company’s decision-making process, therefore we at SNS Insider always believe that we should choose the best method which gives us results closer to reality. This allows us to reach at a stage wherein we can provide our clients best and accurate investment to output ratio.

Each report that we prepare takes a timeframe of 350-400 business hours for production. Starting from the selection of titles through a couple of in-depth brain storming session to the final QC process before uploading our titles on our website we dedicate around 350 working hours. The titles are selected based on their current market cap and the foreseen CAGR and growth.


The 5 steps process:

Step 1: Secondary Research:

Secondary Research or Desk Research is as the name suggests is a research process wherein, we collect data through the readily available information. In this process we use various paid and unpaid databases which our team has access to and gather data through the same. This includes examining of listed companies’ annual reports, Journals, SEC filling etc. Apart from this our team has access to various associations across the globe across different industries. Lastly, we have exchange relationships with various university as well as individual libraries.

Secondary Research

Step 2: Primary Research

When we talk about primary research, it is a type of study in which the researchers collect relevant data samples directly, rather than relying on previously collected data.  This type of research is focused on gaining content specific facts that can be sued to solve specific problems. Since the collected data is fresh and first hand therefore it makes the study more accurate and genuine.

We at SNS Insider have divided Primary Research into 2 parts.

Part 1 wherein we interview the KOLs of major players as well as the upcoming ones across various geographic regions. This allows us to have their view over the market scenario and acts as an important tool to come closer to the accurate market numbers. As many as 45 paid and unpaid primary interviews are taken from both the demand and supply side of the industry to make sure we land at an accurate judgement and analysis of the market.

This step involves the triangulation of data wherein our team analyses the interview transcripts, online survey responses and observation of on filed participants. The below mentioned chart should give a better understanding of the part 1 of the primary interview.

Primary Research

Part 2: In this part of primary research the data collected via secondary research and the part 1 of the primary research is validated with the interviews from individual consultants and subject matter experts.

Consultants are those set of people who have at least 12 years of experience and expertise within the industry whereas Subject Matter Experts are those with at least 15 years of experience behind their back within the same space. The data with the help of two main processes i.e., FGDs (Focused Group Discussions) and IDs (Individual Discussions). This gives us a 3rd party nonbiased primary view of the market scenario making it a more dependable one while collation of the data pointers.

Step 3: Data Bank Validation

Once all the information is collected via primary and secondary sources, we run that information for data validation. At our intelligence centre our research heads track a lot of information related to the market which includes the quarterly reports, the daily stock prices, and other relevant information. Our data bank server gets updated every fortnight and that is how the information which we collected using our primary and secondary information is revalidated in real time.

Data Bank Validation

Step 4: QA/QC Process

After all the data collection and validation our team does a final level of quality check and quality assurance to get rid of any unwanted or undesired mistakes. This might include but not limited to getting rid of the any typos, duplication of numbers or missing of any important information. The people involved in this process include technical content writers, research heads and graphics people. Once this process is completed the title gets uploader on our platform for our clients to read it.

Step 5: Final QC/QA Process:

This is the last process and comes when the client has ordered the study. In this process a final QA/QC is done before the study is emailed to the client. Since we believe in giving our clients a good experience of our research studies, therefore, to make sure that we do not lack at our end in any way humanly possible we do a final round of quality check and then dispatch the study to the client.

Start a Conversation

Hi! Click one of our member below to chat on Phone