Recycled Styrenics Market Report Scope & Overview:
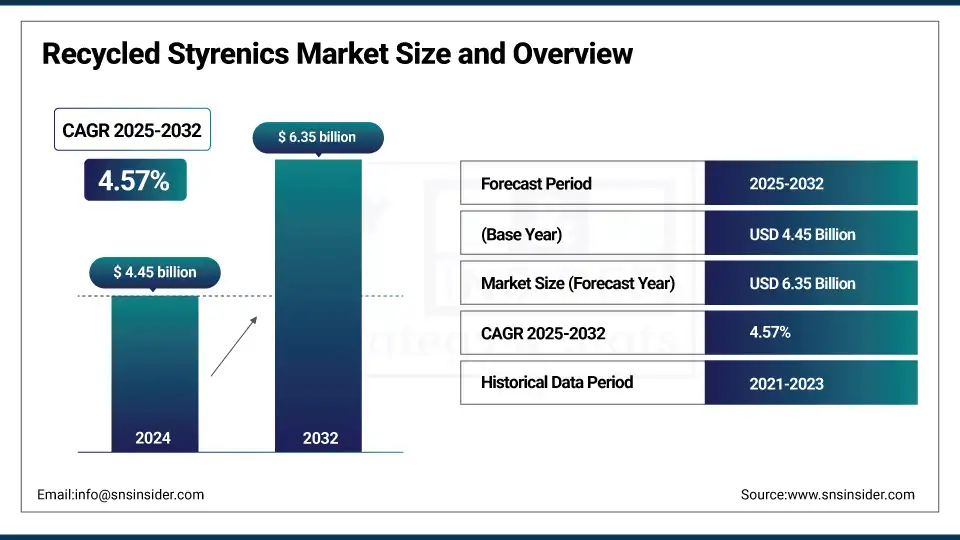
The Recycled Styrenics market size was valued at USD 4.45 billion in 2024 and is expected to reach USD 6.35 billion by 2032, growing at a CAGR of 4.57% over the forecast period of 2025-2032.
To Get more information On Recycled Styrenics Market - Request Free Sample Report
Growth for the recycled styrenics market is driven by breakthroughs such as INEOS Styrolution’s finalist entry for the 2025 Plastics Recycling Awards Europe and Agilyx’s TruStyrenyx plant, which will increase recycled polystyrene recovery. For example, partnerships like INEOS Styrolution with Indaver for feedstock recycling and SABIC to deliver to market one million metric tons of TRUCIRCLE circular solutions by 2030, reiterate the market trends. 2018 U.S. EPA Polystyrene Containers Recycling under 5,000 tons of PS containers recycled out of 80,000 tons generated, production, and end-of-life plastic recycling infrastructure. Pilot plant recycling of chemicals for BASF at Schwarzheide, in a bid for a continuous supply of raw materials. Safety guaranteed by the European Commission’s 2022 recycled plastics for food contact regulation and increased cross-recycled-styrenics company cooperation drives uptake. All these factors collectively propel the market growth and recycling of the styrenics market size, share, and growth across various industries, which subsequently supports the circular economy goals and recycled polystyrene market growth.
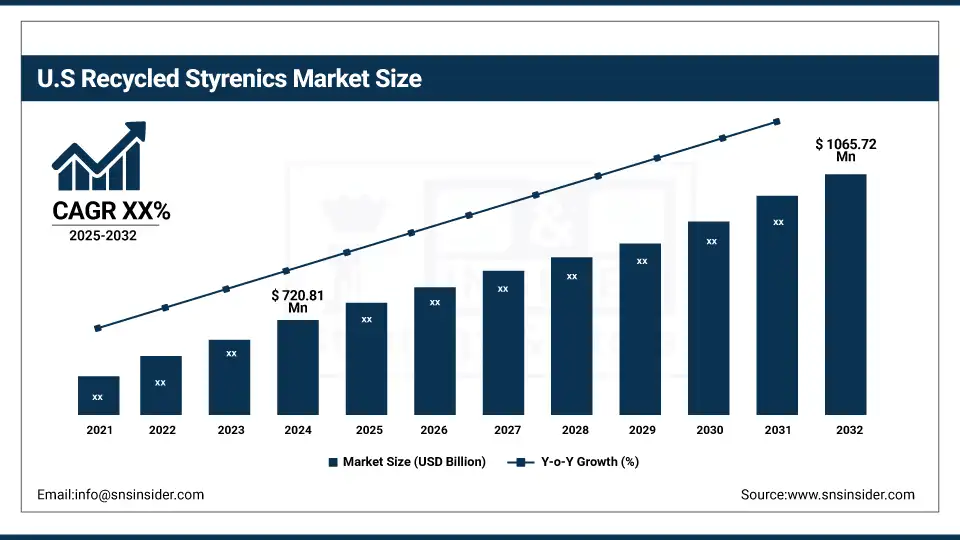
The U.S. dominates the North American recycled styrenics market with a market size of USD 720.81 million and is projected to reach USD 1065.72 million by 2032 with a market share of about 70%. The dominance is due to technological innovation, public-private recycling investments, and large-scale consumption. Companies like Agilyx and Americas Styrenics have built chemical recycling plants that turn waste polystyrene into virgin-equivalent resin. In 2023, Agilyx launched commercial-scale operations in Oregon under its partnership with Technip Energies. These facilities support EPA goals under the Save Our Seas Act and reinforce the United States’ position in the recycled polystyrene market, enabling scalable plastic waste management.
Market Dynamics:
Drivers:
-
Increasing regulatory mandates for recycled content accelerate market penetration
Government mandates for recycled content, such as the EU’s 2022 regulation for food-contact plastic and the US EPA’s Plastics Innovation Challenge, are helping to spur demand. Recycled styrenics makers, like Sabic, are meeting the challenge by coming up with high-quality resins in their TRUCIRCLE line. Such initiatives reinforce current recycled styrenics market trends for regulatory compliance and consumer-safe packaging. These mandates drive the recycled styrenics market analysis as well as enlarge the utilization in consumer goods and food packaging along the national sustainability goals.
-
Corporate sustainability initiatives drive demand for high-quality recycled styrenics
Sabic and Agilyx initiatives, focused on ESG, are driving growth in the recycled styrenics market. Sabic’s announcement to provide one million metric tons of circular products by 2030 under TRUCIRCLE™, in which Agilyx’s TruStyrenyx plant figures notably, illustrates robust corporate momentum. These efforts are in line with international objectives for plastic waste management, leading to higher use of recycled polystyrene and a larger size of the recycled styrenics market. They also characterize prevailing trends within the recycled styrenics market, favoring closed-loop applications and low-carbon packaging.
Restraints:
-
Consumer concerns over quality and performance limit market acceptance
Consumer concern may remain with whether recycled styrenics are safe and effective despite the political push. The EU’s 2022 rule guarantees food safety compliance, though perception gaps persist in industries like packaging and electronics. Recyclers of styrenics need to combat skepticism with clear testing and information. Without a recovery of public trust, these issues will continue to limit the recycled styrenics market share, holding down recycled styrenics market growth in high-profile applications.
Segmentation Analysis:
By Type
Recycled acrylonitrile butadiene styrene dominated and held a 35.2% market share in 2024. Its dominance is based on strength and strong recyclability, and is therefore a favorite raw material in automotive and electronic applications. And companies such as Ineos Styrolution have ramped up rABS recovery operations. Regulatory drivers for high-performance recycled content have also supported that segment in the EU. This is largely attributed to increased developments like this, which scale the recycled styrenics market size share in industries.
Recycled polystyrene is the fastest-growing type with a 5.01% CAGR forecast from 2025 to 2032, on account of its growing applications in food packaging and insulation. Technological advancements, such as Agilyx’s Trustryrenyx technology, are increasing yields in polystyrene chemical recycling, thereby increasing the supply of more feedstock. Meanwhile, U.S. EPA actions and EU legislation triggered efforts to manage plastic waste, while also driving rPS demand in the recycled polystyrene market. These dynamics are contributing to the rise of the recycled styrenics market, particularly in packaging, where end users are increasingly looking for circular material solutions.
By Application
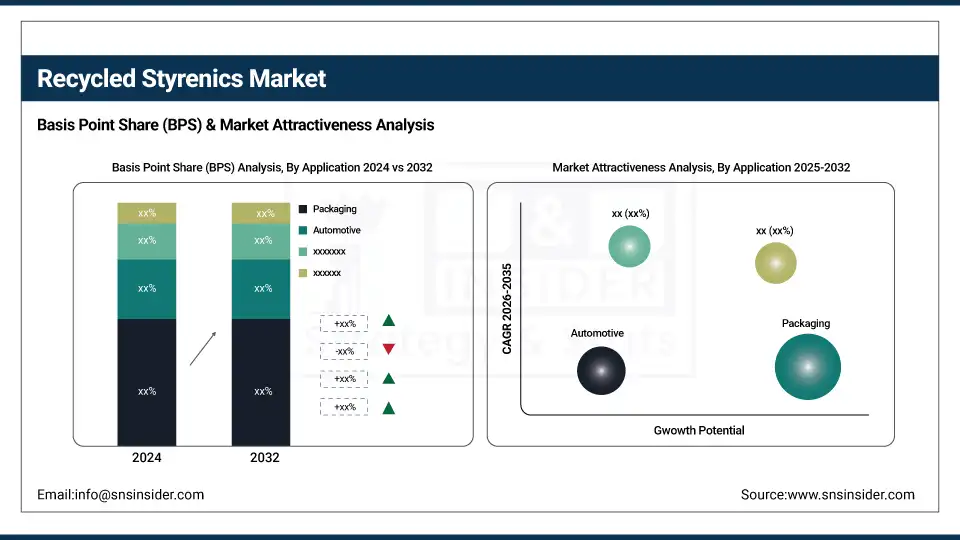
Packaging dominated and held a 39.6% market share in 2024, dominating the recycled styrenics market due to increasing sustainability mandates and consumer demand for recyclable materials. Governments in both the US and Europe have signed off on laws that favour circular economy packaging. Sabic and BASF are among companies adding food-grade recycled styrenics in response to EU regulation 2022/1616 on recycled plastics as well as industrial packaging. These are the factors that are driving the trend of the analysis in the recycled styrenics market, which can be seen in the packaging campaign.
The automotive segment is projected to grow at the highest CAGR of 5.01% between 2025 and 2032 in the recycled styrenics market. This development can be attributed to the rising adoption of lightweight, recycled plastics, such as the recycled ABS in the interiors and panels of automobiles. Auto manufacturers are collaborating with recycled styrenics producers in order to lower carbon footprints and to comply with EPR (extended producer responsibility) directives. This market evolution is in line with worldwide policies concerning the management of plastic waste and is quickly changing the sourcing of materials within the automotive sector.
Regional Analysis:
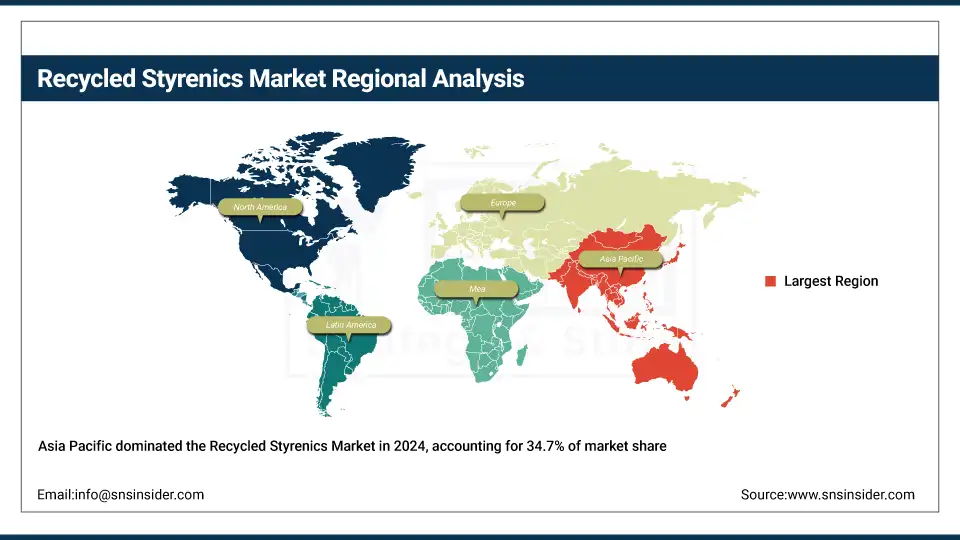
Asia Pacific dominated the recycled styrenics market in 2024 with a 34.7% market share due to strong manufacturing infrastructure and rising environmental policies. China and India lead the region, driven by their growing packaging and electronics sectors. China’s National Sword Policy and India’s EPR rules have boosted recycled plastic resins collection and processing. Recycled styrenics companies like LG Chem and Ineos Styrolution have expanded their presence here, accelerating regional recycled styrenics market growth and improving plastic waste management solutions.
Get Customized Report as per Your Business Requirement - Enquiry Now
Europe held a 27.5% market share in the recycled styrenics market in 2024, driven by stringent sustainability regulations and established recycling systems. Countries like Germany and the Netherlands are at the forefront due to circular economy policies and public-private recycling collaborations. The European Commission’s Circular Plastics Alliance promotes standardization in recycled plastic use. Recycled styrenics companies like BASF and Sabic have developed certified circular polymers in this region, helping shape global recycled styrenics market trends and boosting material innovation across industries.
North America holds the third-largest market share and is the fastest-growing region in the recycled styrenics market. This growth is fueled by government policy shifts, innovation in chemical recycling, and rising consumer sustainability awareness. The U.S. Environmental Protection Agency’s National Recycling Strategy emphasizes market development for recycled plastic resins. In addition, collaborative platforms like the U.S. Plastics Pact aim to achieve 30% average recycled content in plastic packaging by 2025, boosting recycled styrenics market trends across packaging and automotive applications.
Latin America is witnessing steady recycled styrenics market growth due to evolving sustainability legislation and industrial development. Brazil is the regional leader, promoting circular practices through its National Solid Waste Policy. Local governments are working with recycled styrenics companies to modernize recycling networks and increase access to recycled plastic resins. Public-private partnerships are expanding across Argentina and Colombia, creating opportunities in the recycled polystyrene market. These combined efforts are strengthening plastic waste management and driving long-term recycled styrenics market trends in the region.
The Middle East & Africa region is projected to be the fastest-growing in the recycled styrenics market from 2025 to 2032 due to emerging environmental frameworks. South Africa is a frontrunner with its Extended Producer Responsibility (EPR) Act mandating industrial recycling. The UAE is pushing zero-waste-to-landfill policies aligned with its national green agenda. These reforms are creating demand for recycled plastic resins and encouraging recycled styrenics companies to expand in the region, accelerating recycled styrenics market trends in the packaging and construction sectors.
Key Players:
The major recycled styrenics market competitors include INEOS Styrolution, Trinseo, AmSty (Americas Styrenics LLC), Agilyx, MBA Polymers, LG Chem, BASF SE, SABIC, ALPLA, and Styropek.
Recent Developments:
-
In March 2025, Repsol and ELIX Polymers launched ISCC-Plus certified ABS grades made from 100% chemically recycled content, using sustainable inputs like used cooking oil to support circularity and reduce emissions.
-
In January 2025, INEOS Styrolution’s recycled polystyrene solution became a finalist at the 2025 Plastics Recycling Awards Europe for enabling food-grade recyclates compliant with EU regulations, showcased in a recycled yogurt cup.
| Report Attributes | Details |
|---|---|
| Market Size in 2024 | USD 4.45 billion |
| Market Size by 2032 | USD 6.35 billion |
| CAGR | CAGR of 4.57% From 2025 to 2032 |
| Base Year | 2024 |
| Forecast Period | 2025-2032 |
| Historical Data | 2021-2023 |
| Report Scope & Coverage | Market Size, Segments Analysis, Competitive Landscape, Regional Analysis, DROC & SWOT Analysis, Forecast Outlook |
| Key Segments | •By Type (Recycled Polystyrene (rPS), Recycled Acrylonitrile Butadiene Styrene (rABS), Recycled Styrene-Butadiene-Styrene (rSBS), Recycled Styrene-Acrylonitrile (rSAN), and Others) •By Application (Packaging, Automotive, Electronics & Electrical (E&E), Construction, Others) |
| Regional Analysis/Coverage | North America (US, Canada, Mexico), Europe (Germany, France, UK, Italy, Spain, Poland, Turkey, Rest of Europe), Asia Pacific (China, India, Japan, South Korea, Singapore, Australia, Rest of Asia Pacific), Middle East & Africa (UAE, Saudi Arabia, Qatar, South Africa, Rest of Middle East & Africa), Latin America (Brazil, Argentina, Rest of Latin America) |
| Company Profiles | INEOS Styrolution, Trinseo, AmSty (Americas Styrenics LLC), Agilyx, MBA Polymers, LG Chem, BASF SE, SABIC, ALPLA, and Styropek |
Frequently Asked Questions
Mechanical recycling is enabling food-grade polystyrene applications and driving regulatory-compliant innovations across industries.
INEOS Styrolution, Trinseo, SABIC, Agilyx, BASF, and LG Chem are major recycled styrenics market companies globally.
Asia Pacific leads the recycled styrenics market due to strong policies, followed by Europe and North America.
Innovations, ESG initiatives, and government recycling mandates are propelling global recycled styrenics market growth and adoption.
The recycled styrenics market was valued at USD 4.45 billion in 2024, growing at a CAGR of 4.57%.
Get in Touch
