Bioinsecticides Market Report Scope & Overview:
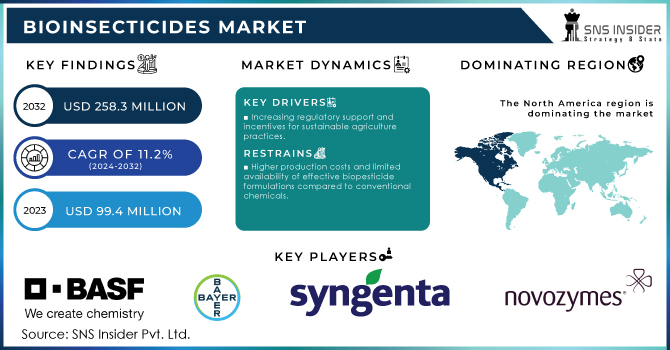
The Bioinsecticides Market Size was valued at USD 99.4 million in 2023, and is expected to reach USD 258.3 million by 2032, and grow at a CAGR of 11.2% over the forecast period 2024-2032.
The bioinsecticides market is growing exponentially, majorly supported by increased demand and application for sustainable agricultural practices and a high level of environmental awareness. Bioinsecticides based on natural organisms, like bacteria, fungi, and plant extracts, offer alternatives that are friendly to the environment. Drivers have been the elevating regulatory pressures, increased consumer preference for organic, and eco-friendly products. Bioinsecticides can also target the specific set of pests without harming the beneficial insects, thus serving as a backbone to the integrated pest management tool. Biotechnology advancements that make the produced products more efficacious and applicable support further growth of the market.
Bioinsecticides Market Size and Forecast
-
Market Size in 2023: USD 99.4 Million
-
Market Size by 2032: USD 258.3 Million
-
CAGR: 11.2% from 2024 to 2032
-
Base Year: 2023
-
Forecast Period: 2024–2032
Get E-PDF Sample Report on Bioinsecticides Market - Request Sample Report
Bioinsecticides Market Trends
-
Growing shift toward sustainable agriculture is accelerating adoption of bioinsecticides, with the global biopesticides segment expanding at a CAGR of over 12%, outpacing conventional chemical pesticides.
-
Rising regulatory restrictions on synthetic insecticides across North America and Europe have increased bio-based product penetration, accounting for over 35% of new crop protection product registrations in recent years.
-
Increasing demand for organic food is boosting usage, as global organic farmland surpassed 75 million hectares, driving higher bioinsecticide consumption.
-
Advancements in microbial and botanical formulations are improving field efficacy by 20–30%, enhancing pest control performance and shelf life.
-
Expansion in emerging economies, particularly in Asia-Pacific and Latin America, is supporting market growth, with these regions contributing over 40% of incremental demand for bioinsecticides.
One of the major dynamics for the market is the increasing regulatory support and incentives for bioinsecticides. Governments and regulatory bodies worldwide are slowly recognizing these developments of biopesticides in relation to reducing chemical residues and promoting sustainable agricultural practices. The UK government is in the process of developing such policies that will give incentives for increasing the adoption of biopesticides, as indicated in Fera's report dated July 2024. All the farmers would easily shift to more sustainable pest control regimes with these initiatives and, in turn, increase market adoption rates. Relatedly, the European Union has applied biopesticides under its regulation. This development has facilitated the market penetration of biopesticides to the European markets. In March 2024, Croda International Plc launched its first product into the market. The company has a foothold on the product since it was developed for the exclusively biopesticide market. The product claims exceptional efficacy for pest control with mild environmental friendliness. More significantly, Croda's move into the sector underlined major players' increasing interest in new formulations and solutions addressing the evolving needs of sustainable agriculture. In August 2024, the college announced that PhD research scholars at the university have made a hallmark discovery to develop a novel biopesticide that could have applications worldwide. Proven from groundbreaking initial field trials, this novel biopesticide has already shown potential in transforming the pest management scenario worldwide.
Advancements in research and development have also been factors in market dynamics. Firms have poured a major financial investment into the development of new, innovative biopesticide formulations that make it more effective and more application friendly. For example, as published in an article in Agribusiness Global on June 2024, biopesticides have emerged as a growing element of sustainable alternatives in organic farming. Firm commitments to providing the best possible solutions while adhering to environmental safety will be key in this pursuit of new sources and delivery systems for bioinsecticides.
The consumer will continue to drive the bioinsecticides market with the increasing awareness and demand for green/organic and sustainable product consumption. Consumers' understanding and preferences related to the environmental impacts of the use of chemical pesticides are favored with the use of biopesticides in line with systems of organic farming. With increasing consumer awareness, the trend is moving toward biopesticides which is encouraging firms to have product development of such portfolios. Regulatory support coupled with advances in technology and diverse consumer preferences will predispose the bioinsecticide market to a healthy trend.
Bioinsecticides Market Drivers:
-
Increasing regulatory support and incentives for sustainable agriculture practices.
The increasing demand in the bioinsecticides market is driven by growing governmental support and incentives for sustainable agriculture practices. Most governments and regulatory bodies around the world have been insisting on environment-friendly pest management solution methods. Governments have continued to offer an enabling environment through incentives; for example, in April 2023, the U.S. Environmental Protection Agency announced a new initiative dubbed "Sustainable Pest Management," which incorporates grants and subsidies aimed at farmers who take up biopesticides. The initiative seeks to reduce dependency on synthetic chemicals by providing natural alternatives; an action that will boost the bioinsecticides market. In October 2023, the European Commission presented the "Farm to Fork Strategy," a wider strategy on sustainable agriculture into which it integrated biopesticides. The policy opens up financing incentives for European farmers to change over to biopesticides to support their development and commercialization. Another important aspect was the initiation of the "National Biopesticide Mission" by the Indian government in January 2024, accompanied by tax break-ins and funding for research into new biopesticide innovations. The awareness to be created herein is for the adoption of biopesticides in India's rapidly growing agricultural sector, following the global trend of using regulations in support of sustainable agriculture. These measures, hence, in terms of regulation and financial incentive, will be key drivers keeping the bioinsecticides market economically viable for farmers to adopt and integrate these sustainable solutions in their strategies of pest management.
-
Rising consumer demand for organic and environmentally friendly pest control solutions.
Increased consumer demand for organic and ecofriendly pest control solutions in bioinsecticides comes mainly from an increasing number of consumers seeking products that align best with their values on sustainability and health. This change in consumer preference manifests in a number of recent developments within the industry. For instance, in March 2024, the global agribusiness firm Bayer CropScience launched a new line of bioinsecticides under its "Naturals" brand, specifically designed to meet the growing consumer demand for products free from synthetic chemicals. This launch reflects Bayer's response to the rising consumer trend of organic farming and sustainable management against pests. Also, a breakthrough in the development of biopesticides has been achieved by the startup company BioNex Solutions, which has developed a new biopesticide made from plant extracts for application in the Organic Farming segment and has recently grown a lot due to consumer awareness. Surveys by consumers and market research drivers reflect a strong preference towards an environmentally safe pest control alternative for such a product. Indeed, in July 2024, the Australian AgBiTech reported that sales from its bioinsecticide products had increased by 30%, driven by an extraordinary lift in consumer demand for environmentally friendly agricultural solutions. This development further reinforces a larger trend of change in market dynamics, whereby increasingly, consumer choices come to define farming practices and ultimately have an impact on the growth of the bioinsecticides sector.
Bioinsecticides Market Restraints:
-
Higher production costs and limited availability of effective biopesticide formulations compared to conventional chemicals.
High costs of production and delivery of proper, efficient formulations of biopesticides are major challenges in this market. A French firm, Valagro, for example, cited high prices in raw material sourcing and running their production facility as intense pressure on means of production for biopesticide products in their portfolio in June 2024. These higher costs are partially due to the complex processes associated with the development and manufacturing of biopesticides, which normally require special equipment and tight control over the quality of these products. Moreover, in September 2024, a U.S.-based AgriNano Solutions startup noted inconsistencies in achieving effective performance under variable environmental conditions of their biopesticide products, thereby making such products limited in market penetration against established synthetic chemicals which generally expand the spectrum of pest control at a lower cost. The difference in the effectiveness and production costs of biopesticides both limits their competitive edge over conventional chemical alternatives and affects their acceptance and growth in the market.
Bioinsecticides Market Opportunities:
-
Technological advancements in biotechnology improving the efficacy and application of bioinsecticides.
Improving technological advancement in biotechnology is significantly enhancing the efficacy and applicability of bioinsecticides, and this actually offers a goldmine opportunity for the market. For instance, in February 2024, the biotech company BioShield Technologies unveiled a new biopesticide formulation using advanced gene-editing techniques to optimize the potency of natural insecticidal proteins. This innovation has led to a more effective control of pest populations while minimizing non-target effects. Also in August 2024, AgroBioTech, an agricultural technology company, outlined an innovative nano-encapsulation technology that adds in comforting the stability and delivery of biopesticide to more consistently produce the expected performance under variable environmental conditions. Such new technologies will up the efficacy of bioinsecticides but also increase their potential application, making it more competitive with the conventional chemical solutions and hence allowing broader diffusion in sustainable agriculture.
Bioinsecticides Market Challenges:
-
Variability in the effectiveness of bioinsecticides across different environmental conditions and pest species.
Variable performance of bioinsecticides under different environmental conditions and against different pest species offers the opportunity for market growth through focused research and product development. For example, in April 2024, the company EcoPest Innovations introduced a new biopesticide formulated particularly for use against the challenge of efficacy in variable climates by using sophisticated modeling to tailor the product across various environmental conditions. This approach shall improve the performance of biopesticides in most agricultural settings. Again, in September 2024, GreenTech Solutions engaged in another milestone in a research program for broad-spectrum biopesticides—biopesticides that can act on several species of pests—the solution to one major problem which has limited their application: variability in their effectiveness. Such efforts show a rising trend in the development of more flexible and versatile biopesticide solutions to boost adoption in the market by addressing environmental and pest-specific variability.
KEY MARKET SEGMENTS
By Type
The microbial segment dominated the bioinsecticides market in 2023 due to the wide range of applications and its efficiency in controlling a wide variety of pests. The microbial category has seen huge adoption because it has specific efficacy on certain pests, along with its eco-friendly nature. For example, Bacillus thuringiensis and Beauveria bassiana based products have rapidly occupied the space because of the established record of their performance in managing pests across a wide array of crops. This has been projected to take up nearly 60% of the market share itself in 2023, hence showcasing its intense presence and high popularity in the respective industry. The dominance in the market is attributed to ongoing developments in microbial technology and raising awareness about the benefits of using biopesticides among farmers and agricultural stakeholders.
By Organism
The Bacillus thuringiensis segment accounted for the bioinsecticides market in 2023 and is anticipated to lead by value to account for about 40% of the total market size at the end of the forecast period. Bacillus thuringiensis is widely known to be active against many kinds of insect pests, especially related to agriculture and horticulture. Most of its popularity is because it produces very specific insecticidal proteins against target pests, thus forming a main component in organic farming and integrated pest management programs. For example, products based on Bt have been incorporated into cotton and corn crops to manage the European corn borer and cotton bollworm, hence dominating the share in the bioinsecticides market.
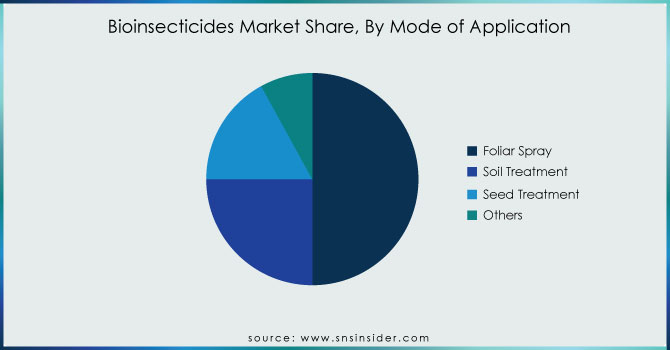
By Mode of Application
The foliar spray segment dominated and accounted for about 50% of the bioinsecticides market in 2023. Foliar sprays are very effective since they involve the direct application of bioinsecticides onto the surfaces of plants where pests are more active, hence immediate contact with and rapid control of pests. This mode of application is best suited for use in crops such as vegetables, fruits, and ornamentals, where targeted pest management is called for. As a result, foliar sprays had been already applied on a wide scale, helping to control such pests as aphids and caterpillars in vineyards and orchards, so they had the largest share of the market. Furthermore, the favor of foliar sprays among farmers and farming producers soared, and in clearing the way for them, global market leadership in bioinsecticides was also established satisfactorily.
Get Customized Report as Per Your Business Requirement - Request For Customized Report
By Crop Type
In 2023, the fruits and vegetables segment dominated the bioinsecticides market, capturing an estimated market share of around 55%. This is largely due to the high value and sensitivity of the crops, which require effective pest management solutions that are safe and environmentally friendly. Especially in regard to fruits and vegetables, bioinsecticides are quite appropriate because they bear minimal residues, making them quite-suited to consumers demanding organic and pesticide-free produce. For example, in crops such as tomatoes, lettuce, and apples, bioinsecticides are heavily applied to protect against destructive pests such as aphids, whiteflies, and caterpillars, ensuring quality and safety of crops. Bioinsecticides have been adopted in this sector due to the significant rise in including organic farming and integrated pest management practices in horticulture, ranking it highly in most statistics.
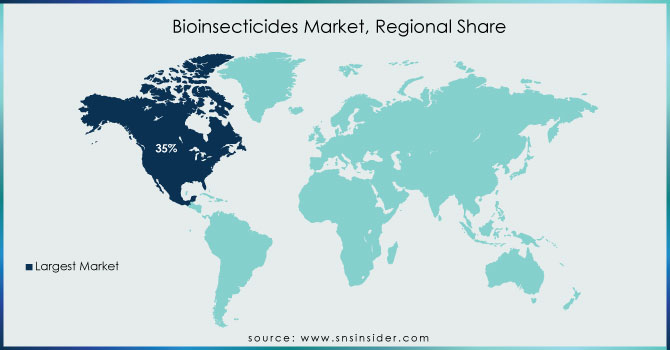
Bioinsecticides Market Regional Analysis
North America dominated and accounted for an estimated 35% market share in the bioinsecticides market in 2023 and is viewed to be at the forefront. This is because sustainable agriculture is increasingly trending in this region, and integrated pest management has been gaining significant traction in this region. The U.S. had already made a big headway into the process since most of its farmers have already switched over to using bioinsecticides amid rising consumer demand for organics and non-GMO produce. But what really helped the broad-based adoption of bioinsecticides in fruit and vegetable farming in North America was the emergence of requirements for effective, yet eco-friendly solutions for the control of pests and diseases in apples, grapes, leafy greens, and the like. Another key factor that gives impetus to the North American market growth, which helped take the leading position, is through strong regulatory support in biopesticides and their products, combined with agricultural biotechnology development.
The Asia-Pacific region emerged as the fasting-growing in bioinsecticides market, by capturing a market share of close to 25% by the year 2023. The growth spurt could majorly be located on the upswing in agricultural activities and increasing adoption of sustainable farming practices in countries like China, India, and Japan. Governments are promoting the use of bioinsecticides to increase crop yield while shifting from the environmental burden presented by chemical pesticides. For example, in India, there has been a significant movement toward organic farming, which is leading to rising demand for bioinsecticides in crops such as rice, cotton, and vegetables. Moreover, increasing awareness among farmers about the long-term benefits of bioinsecticides and supportive government policies and subsidies accelerate their adoption in the region, thus making Asia-Pacific the fastest-growing market for bioinsecticides in 2023.
KEY PLAYERS
BASF SE, Bayer AG, Syngenta AG, Kilpest India Ltd, Nufarm, Marrone Bio innovations, Novozymes A/S, Biobest Group NV, Som Phytopharma, Valent Bioscience, and other key players are mentioned in the final report.
Recent Developments
-
June 2024: Kyrgyzstan conducted its first biopesticide trials against locusts with the support of FAO and DCPPQ.
-
May 2024: Italy became the second EU country to approve an emergency use of Vestaron's bioinsecticide SPEAR LEP against the tomato leafminer. Authorization permitted its use from March 28 to July 25 on tomatoes.
-
April 2024: Bayer granted an exclusive license from AlphaBio Control for the new biological insecticide with a target launch date of 2028 for arable crops.
-
February 2024: Syngenta Crop Protection and Lavie Bio Ltd. entered into collaboration for developing biological insecticidal solutions by fusing technology from Lavie Bio and global expertise from Syngenta Crop Protection.
| Report Attributes | Details |
| Market Size in 2023 | US$ 99.4 Million |
| Market Size by 2032 | US$ 258.3 Million |
| CAGR | CAGR of 11.2% From 2024 to 2032 |
| Base Year | 2023 |
| Forecast Period | 2024-2032 |
| Historical Data | 2020-2022 |
| Report Scope & Coverage | Market Size, Segments Analysis, Competitive Landscape, Regional Analysis, DROC & SWOT Analysis, Forecast Outlook |
| Key Segments | •By Type (Macrobials, Microbials, Others) •By Organism (Bacillus thuringienis, Beauveria bassiana, Verticillium lecanii, Metarhizium anisopliae, Baculovirus, Others) •By Mode of Application (Foliar Spray, Soil Treatment, Seed Treatment, Others) •By Crop Type (Cereals & Grains, Oilseeds & Pulses, Fruits & Vegetables, Others) |
| Regional Analysis/Coverage | North America (US, Canada, Mexico), Europe (Eastern Europe [Poland, Romania, Hungary, Turkey, Rest of Eastern Europe] Western Europe] Germany, France, UK, Italy, Spain, Netherlands, Switzerland, Austria, Rest of Western Europe]), Asia Pacific (China, India, Japan, South Korea, Vietnam, Singapore, Australia, Rest of Asia Pacific), Middle East & Africa (Middle East [UAE, Egypt, Saudi Arabia, Qatar, Rest of Middle East], Africa [Nigeria, South Africa, Rest of Africa], Latin America (Brazil, Argentina, Colombia, Rest of Latin America) |
| Company Profiles | BASF SE, Bayer AG, Syngenta AG, Kilpest India Ltd, Nufarm, Marrone Bio innovations, Novozymes A/S, Biobest Group NV, Som Phytopharma, Valent Bioscience and other key players |
| Key Drivers | • Increasing regulatory support and incentives for sustainable agriculture practices • Rising consumer demand for organic and environmentally friendly pest control solutions |
| RESTRAINTS | • Higher production costs and limited availability of effective biopesticide formulations compared to conventional chemicals |
Frequently Asked Questions
The key drivers are
- Bioinsecticides are selective in their effect, and they tend to target the pest species of interest.
- To eliminate harmful effects on the environment and health caused by synthetic pesticides.
USD 99.4 Million was the market size of the Bioinsecticides market in 2023.
North America is the fastest-growing region of the Bioinsecticides Market.
USD 258.3 Million is the projected market size of the Bioinsecticides market by 2032.
The Compound Annual Growth rate for Bioinsecticides Market over the forecast period is 11.2%.
Get in Touch
