Reference Thermometer Market Size & Growth:
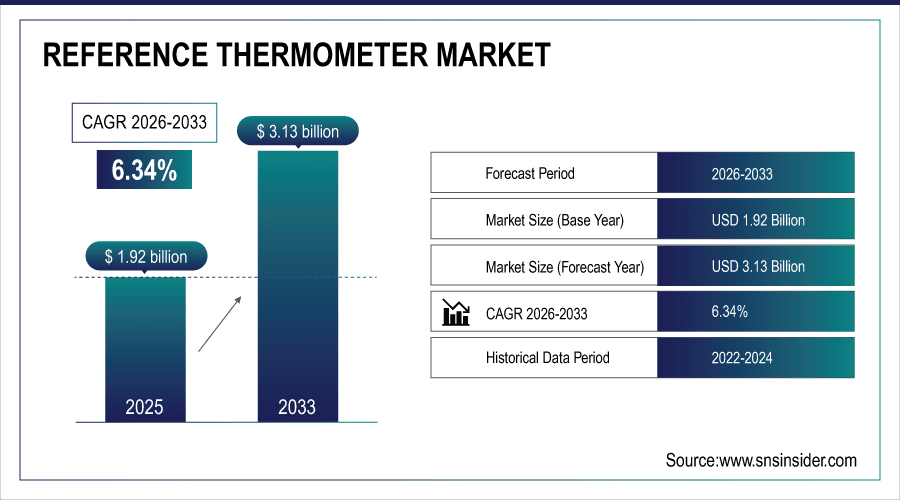
The Reference Thermometer Market size was valued at USD 1.92 Billion in 2025E and is projected to reach USD 3.13 Billion by 2033, growing at a CAGR of 6.34% during 2026-2033.
The Reference Thermometer Market is expanding due to the rising demand for precise temperature measurement in industries like pharmaceuticals, food and beverage, and energy. Increasing regulatory standards and calibration requirements are driving adoption across laboratories and manufacturing units. Technological advancements, such as digital and infrared reference thermometers, are enhancing accuracy and usability. Growth in automation and industrial IoT is further fueling demand for high-performance calibration instruments.
In 2024, over 70% of pharmaceutical and food & beverage manufacturers upgraded to digital reference thermometers to comply with ISO 17025 and FDA 21 CFR Part 11 calibration mandates, driving a 22% YoY increase in lab-grade thermometer sales.
To Get More Information On Reference Thermometer Market - Request Free Sample Report
Market Size and Forecast:
-
Market Size in 2025: USD 1.92 Billion
-
Market Size by 2033: USD 3.13 Billion
-
CAGR: 6.34% from 2026 to 2033
-
Base Year: 2025
-
Forecast Period: 2026–2033
-
Historical Data: 2022–2024
Reference Thermometer Market Trends
-
The shift from traditional glass thermometers to advanced digital solutions is driving accuracy, faster readings, and improved usability, catering to industrial automation, healthcare, and pharmaceutical calibration needs globally.
-
Strict regulatory requirements in pharma and biotech sectors are increasing reliance on highly accurate reference thermometers, ensuring compliance, quality control, and consistency in production and laboratory environments.
-
Infrared reference thermometers are witnessing growing adoption, especially in energy, food, and healthcare sectors, due to their quick response, safety advantages, and suitability in harsh operating environments.
-
Industries are increasingly deploying fixed-point and comparison calibration methods using reference thermometers, ensuring long-term reliability, traceability, and higher measurement precision for critical industrial and scientific applications.
-
Rapid industrialization and stricter quality standards in Asia-Pacific and Latin America are accelerating demand for reference thermometers, strengthening market presence and creating new growth opportunities.
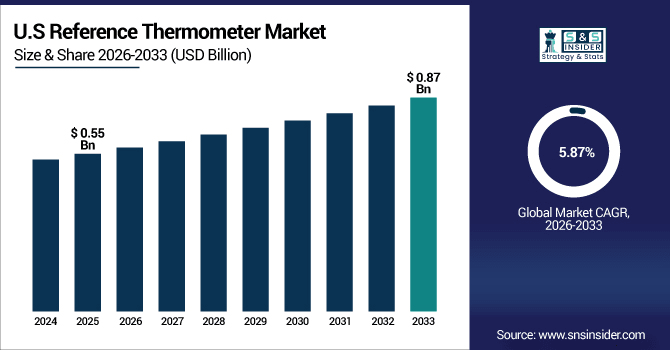
The U.S. Reference Thermometer Market size was valued at USD 0.55 Billion in 2025E and is projected to reach USD 0.87 Billion by 2033, growing at a CAGR of 5.87% during 2026-2033. Reference Thermometer Market growth is driven strict regulatory standards across pharmaceuticals, biotechnology, and food safety industries. Rising demand for accurate calibration in healthcare and clinical laboratories further supports adoption. The country’s strong presence of leading calibration equipment manufacturers enhances innovation and availability. Increasing investments in R&D and digital thermometer technologies are fueling advanced product adoption.
Reference Thermometer Market Growth Drivers:
-
Increasing regulatory compliance and quality assurance needs across pharmaceutical, healthcare, and industrial sectors.
The Reference Thermometer Market is driven by stringent global regulations demanding precise temperature measurement and calibration standards. Industries such as pharmaceuticals, food and beverage, healthcare, and energy require highly accurate thermometers to maintain compliance, ensure product safety, and achieve process consistency. Growing emphasis on quality assurance, coupled with expanding calibration laboratories, is fueling adoption of advanced digital and infrared reference thermometers, supporting market growth across both developed and emerging regions.
In 2024, 85% of pharmaceutical and food processing facilities globally adopted digital reference thermometers with ±0.02°C accuracy to meet FDA, EU GMP, and WHO compliance mandates, triggering a 25% rise in calibration lab certifications worldwide. Infrared reference thermometers saw 40% adoption growth in energy and healthcare sectors, driven by non-contact safety needs and real-time audit trails for ISO 13485 and HACCP standards.
Reference Thermometer Market Restraints:
-
High costs and complex calibration processes limiting adoption across small and medium-sized enterprises
The Reference Thermometer Market faces challenges due to the significant costs associated with advanced digital and infrared thermometers. Complex calibration procedures and the need for skilled technicians add to operational burdens. These factors discourage adoption among smaller laboratories, low-budget healthcare facilities, and cost-sensitive industries. Furthermore, limited awareness in emerging economies regarding calibration standards reduces market penetration, restricting overall growth potential despite increasing global demand for precision instruments.
Reference Thermometer Market Opportunities:
-
Rising demand for digital thermometers with IoT integration across industrial, healthcare, and energy applications
The Reference Thermometer Market presents strong opportunities with the integration of IoT and smart technologies. Digital reference thermometers equipped with wireless connectivity enable real-time monitoring, predictive maintenance, and enhanced efficiency across applications. Growing use in pharmaceuticals, biotechnology, energy, and clinical laboratories supports advanced process control and regulatory compliance. Emerging economies investing in healthcare and industrial infrastructure provide further growth avenues, strengthening market expansion in the coming years.
In 2024, over 45% of newly deployed reference thermometers in pharma and biotech labs featured IoT connectivity, enabling real-time cloud logging and reducing calibration downtime by 30% through predictive maintenance alerts.
Reference Thermometer Market Segment Analysis
-
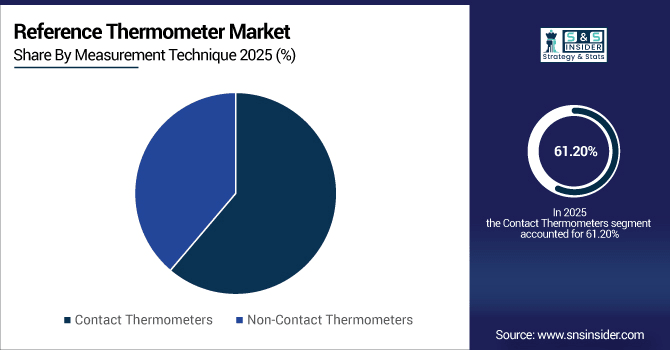
By Measurement Technique, Contact Thermometers held the leading share of 61.20% in 2025E, while Non-Contact Thermometers are expected to grow fastest at a CAGR of 8.1%.
-
By Product, Platinum Resistance Thermometers led the market with 34.50% share in 2025E, while Infrared Thermometers are the fastest growing with a CAGR of 8.9%.
-
By Application, Calibration Laboratories dominated with 32.80% share in 2025E, whereas Pharmaceutical and Biotechnology is the fastest growing segment with a CAGR of 9.40%.
-
By Calibration Type, Comparison Calibration accounted for 36.70% share in 2025E, while Fixed Point Calibration is projected to grow fastest with a CAGR of 8.50%.
By Measurement Technique, Contact Thermometers Lead While Non-Contact Thermometers Registers Fastest Growth
Contact thermometers currently lead the market because of their proven reliability and accuracy in controlled calibration processes, especially within laboratories, pharmaceuticals, and industrial applications. Their ability to provide consistent results ensures their dominance. However, non-contact thermometers, particularly infrared-based devices, are witnessing the fastest growth. Industries like healthcare, food safety, and energy increasingly favor these for hygienic, quick, and safe measurements. The rising use of automation and real-time monitoring technologies is further fueling the adoption of advanced non-contact thermometer solutions worldwide.
By Product, Platinum Resistance Thermometers Leads Market While Infrared Thermometers. Registers Fastest Growth
Platinum resistance thermometers dominate the reference thermometer market due to their superior accuracy, stability, and reliability across calibration laboratories, healthcare, and industrial environments. These thermometers are widely adopted for applications requiring long-term precision and compliance with strict standards. However, infrared thermometers are projected to grow at the fastest pace, driven by rising demand for non-contact measurement in food safety, healthcare, and energy sectors. Their ability to deliver quick, safe, and reliable readings makes them increasingly popular across diverse industries.
By Application, Calibration Laboratories Dominate While Pharmaceutical and Biotechnology Shows Rapid Growth
Calibration laboratories remain the leading application segment, as they form the backbone of quality assurance and standardization across industries requiring precise temperature measurement. They play a critical role in ensuring compliance with international standards. Meanwhile, the pharmaceutical and biotechnology industries are experiencing rapid growth in reference thermometer adoption due to stringent regulatory requirements for drug safety, vaccine storage, and process validation. The rising global focus on healthcare quality and advancements in biotechnological research are accelerating thermometer demand in this segment.
By Calibration Type, Comparison Calibration Lead While Fixed Point Calibration Grow Fastest
Comparison calibration remains the most widely used technique in the reference thermometer market due to its flexibility, cost-effectiveness, and applicability across multiple industries. It allows simultaneous comparison of multiple thermometers against a standard, ensuring accurate results. However, fixed point calibration is registering the fastest growth, as industries seek highly accurate and traceable measurements aligned with international standards. Its growing importance in high-precision fields like pharmaceuticals, biotechnology, and advanced industrial applications is driving adoption, despite higher complexity and cost considerations.
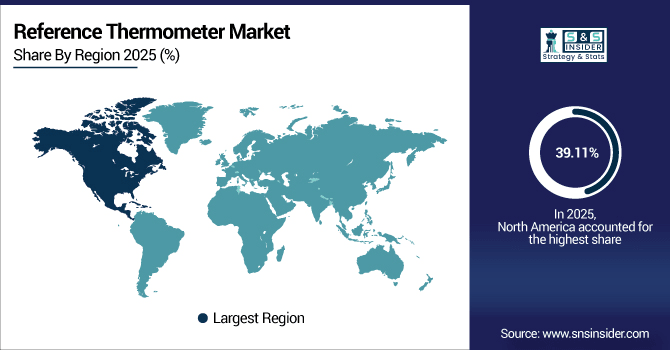
North America Reference Thermometer Market Insights
In 2025E North America dominated the Reference Thermometer Market and accounted for 39.11% of revenue share, this leadership is due to the advanced industrial automation, strict FDA regulations, and well-established calibration standards. The U.S. leads due to heavy adoption in pharmaceuticals and biotechnology. Strong presence of top calibration equipment manufacturers boosts innovation and supply. Adoption of IoT-integrated thermometers is rising in energy and healthcare applications.
Get Customized Report as Per Your Business Requirement - Enquiry Now
U.S. Reference Thermometer Market Insights
The U.S. dominates North America with high adoption across pharmaceuticals, healthcare, and food safety industries. Stringent compliance requirements from FDA and CDC enhance market demand. Key players like Fluke Calibration and AMETEK lead with innovation.
Asia-pacific Reference Thermometer Market Insights
Asia-pacific is expected to witness the fastest growth in the Reference Thermometer Market over 2026-2033, with a projected CAGR of 6.86 due to rapid industrialization and rising healthcare investments across countries like India, Japan, and South Korea. Strong demand in pharmaceuticals, biotechnology, and food industries drives adoption. Increasing calibration laboratories further strengthen market growth. Digital and infrared thermometer technologies are gaining traction for regulatory compliance.
China Reference Thermometer Market Insights
China is a dominant contributor within Asia-Pacific, fueled by its large pharmaceutical manufacturing base and strict quality control standards. Government initiatives supporting healthcare modernization and drug safety boost thermometer adoption.
Europe Reference Thermometer Market Insights
Europe is a mature market supported by strong calibration infrastructure and strict EU regulatory standards. Germany, the U.K., and France are major contributors. Demand is fueled by pharmaceutical R&D, energy efficiency, and food safety compliance.
Germany Reference Thermometer Market Insights
Germany plays a leading role in the European market, with strong focus on precision engineering and calibration. Industrial manufacturing and pharmaceuticals create major demand. The country’s advanced laboratories support high adoption of digital thermometers.
Latin America (LATAM) and Middle East & Africa (MEA) Reference Thermometer Market Insights
The Reference Thermometer Market is experiencing moderate growth in the Latin America (LATAM) and Middle East & Africa (MEA) regions, due to the modernization in healthcare, energy, and food industries. Brazil, Mexico, and GCC nations are key contributors, supported by expanding pharmaceutical production and imports. While limited calibration facilities, higher costs, and low awareness pose challenges, foreign investments are improving adoption. Advanced infrastructure in GCC countries and growing calibration laboratories across LATAM strengthen demand. Rising healthcare and industrial R&D investments promise long-term regional market opportunities.
Reference Thermometer Market Competitive Landscape:
Fluke Calibration is a global leader in precision measurement instruments, including reference thermometers. The company focuses on accuracy, reliability, and compliance with international calibration standards. Its products are widely adopted in pharmaceuticals, energy, and industrial automation. Continuous innovation and IoT integration enhance its market strength.
-
In August 2025, Fluke launched the 5530A Basic Multi-Product Calibrator, a cost-effective addition to its 55XX series, and introduced a Null Meter option for the 8588A Reference Multimeter to enhance precision and automation.
AMETEK’s Jofra division specializes in high-accuracy temperature calibration instruments, including reference thermometers. Known for advanced digital solutions, it serves industries like oil & gas, pharmaceuticals, and power. The brand emphasizes portable, user-friendly designs for field calibration. Strong global presence boosts its market competitiveness.
-
In July 2025, AMETEK STC introduced the JOFRA RTC-168 Reference Temperature Calibrator, focusing on sanitary sensors for pharmaceutical and food industries. It offers both wet-bath and dry-block calibration from −30°C to 165°C, with improved uniformity and accuracy.
WIKA is a major player in temperature measurement and calibration, offering robust reference thermometer solutions. Its platinum resistance thermometers are widely used in critical industries. The company leverages German engineering excellence to ensure reliability. Global partnerships and R&D investments strengthen its market influence.
-
In March 2024, WIKA introduced the TC59-E eTEFRACTO-PAD tubeskin thermocouple assembly, offering a more accurate removable thermocouple sensor with flexible installation and improved maintenance.
Reference Thermometer Companies are:
-
AMETEK (Jofra)
-
WIKA
-
Isotech
-
Anton Paar
-
Labfacility
-
Accurate Sensors Technologies (AST)
-
OMEGA Engineering
-
Dostmann electronic GmbH
-
Endress+Hauser
-
Yokogawa Electric Corporation
-
KROHNE Messtechnik
-
Keysight Technologies
-
Testo SE & Co. KGaA
-
Rototherm Group
-
Sensortherm GmbH
-
PremaTech Instruments
-
Calmet
-
JUMO GmbH & Co. KG
| Report Attributes | Details |
|---|---|
| Market Size in 2025 | USD 1.92 Billion |
| Market Size by 2033 | USD 3.13 Billion |
| CAGR | CAGR of 6.34% From 2026 to 2033 |
| Base Year | 2025E |
| Forecast Period | 2026-2033 |
| Historical Data | 2022-2024 |
| Report Scope & Coverage | Market Size, Segments Analysis, Competitive Landscape, Regional Analysis, DROC & SWOT Analysis, Forecast Outlook |
| Key Segments | • By Product (Digital Reference Thermometers, Glass Thermometers, Platinum Resistance Thermometers, Thermocouples, Infrared Thermometers) • By Application (Calibration Laboratories, Pharmaceutical and Biotechnology, Food and Beverage Industry, Healthcare and Clinical Laboratories, Oil and Gas, Energy and Power Generation) • By Measurement Technique (Contact Thermometers, Non-Contact Thermometers) • By Calibration Type (Fixed Point Calibration, Comparison Calibration, Standard Calibration ) |
| Regional Analysis/Coverage | North America (US, Canada), Europe (Germany, UK, France, Italy, Spain, Russia, Poland, Rest of Europe), Asia Pacific (China, India, Japan, South Korea, Australia, ASEAN Countries, Rest of Asia Pacific), Middle East & Africa (UAE, Saudi Arabia, Qatar, South Africa, Rest of Middle East & Africa), Latin America (Brazil, Argentina, Mexico, Colombia, Rest of Latin America). |
| Company Profiles | Fluke Calibration, AMETEK (Jofra), WIKA, Isotech, Anton Paar, ThermoProbe, Labfacility, Accurate Sensors Technologies (AST), OMEGA Engineering, Dostmann electronic GmbH, Endress+Hauser, Yokogawa Electric Corporation, KROHNE Messtechnik, Keysight Technologies, Testo SE & Co. KGaA, Rototherm Group, Sensortherm GmbH, PremaTech Instruments, Calmet, JUMO GmbH & Co. KG |
Frequently Asked Questions
The market was valued at USD 1.92 Billion in 2025E and is projected to reach USD 3.13 Billion by 2033.
Growth is driven by rising demand for precision calibration, stricter regulatory compliance, technological advancements, and growing adoption in healthcare, pharmaceuticals, and industrial applications.
The Platinum Resistance Thermometers segment dominated during the projected period.
North America dominated the Reference Thermometer Market in 2025E.
The Reference Thermometer Market is expected to grow at a CAGR of 6.34% during 2026–2033.
Get in Touch
