Respiratory Protective Equipment Market Report Scope & Overview:
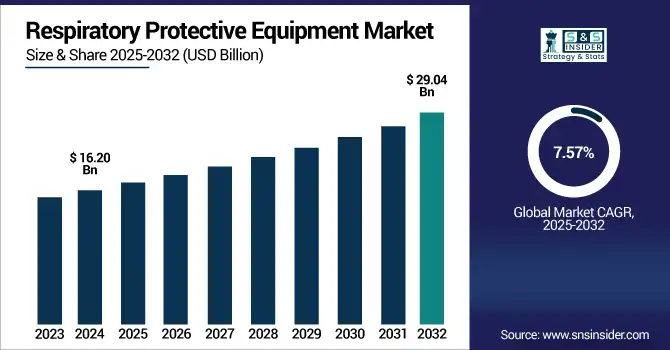
The Respiratory Protective Equipment Market size was valued at USD 16.20 billion in 2024 and is expected to reach USD 29.04 billion by 2032, growing at a CAGR of 7.57% over the forecast period of 2025-2032.
To Get more information on Respiratory Protective Equipment- Request Free Sample Report
The Respiratory Protective Equipment (RPE) Market is steadily growing with heightened expectations of working and occupational lung safety, while industrialization and workplace safety regulations are also on the rise. Healthcare, manufacturing, construction, mining, and chemical processing are key industries that use RPE for constant worker exposure to levels of airborne contaminants, gases, vapors, and particulate matter. It consists of various products like air-purifying respirators (APRs), powered air-purifying respirators (PAPRs), and supplied air respirators (SARs), based on the workplace risk.
Some of the respiratory protective equipment market trends include increasing adoption of lightweight, reusable, and smart respirators, integration of advanced filtration technologies, and real-time monitoring capabilities. Also, the growing trend towards sustainability and eco-friendly material selection, along with ergonomic product design, has propelled manufacturers to innovate. Hence, the respiratory protective equipment market is undergoing a fast-track dynamic shift due to the regulatory compliance obligation and the initiative taken towards employee health by the organizations, which is the primary concern for any organization. The global respiratory protective equipment market growth is poised to rise in the growth with the continued support of safety technology development and the recognition of chronic inhalational risk in the long term.
In June 2025, Avon Technologies received a USD 13.0 million contract from the UK Ministry of Defence to supply FM50 CBRN respirators to the Armed Forces of Ukraine. These advanced masks offer full-face protection against chemical, biological, radiological, and nuclear threats. Delivery is scheduled for September 2026. Avon’s CEO stated the deal reinforces the UK’s defense support for international allies.
Respiratory Protective Equipment Market Dynamics:
Drivers
-
Regulatory Enforcement and Workplace Safety Standards Driving Respiratory Protective Equipment Demand
As such, initiatives drive up workplace safety standards, hence the RPE demand. OSHA’s Respiratory Protection Standard (29CFR1910.134) requires an entire respiratory protection program, including medical evaluations, fit testing, training, and maintenance for all workplaces with airborne contaminants in the U.S. Identify 5 million U.S. workers from 1.3 million establishments needing the use of respirators for protection regularly. A total of 2,481 OSHA violations related to respiratory protection made this one of the ten most-cited standards, indicating high enforcement action. Additionally, by requiring respirator performance to be NIOSH approved, employers should only certify respirator protective devices. The resulting regulatory requirements in sectors such as construction, mining, manufacturing, oil and gas, and healthcare establish a stable, recurring demand for compliant RPE.
In February 2025, J. J. Keller reported that OSHA’s top respiratory protection violations in 2024 included missing medical evaluations, lack of written programs, and failure to conduct annual fit testing. These issues accounted for hundreds of citations, highlighting widespread non-compliance with the 1910.134 standard.
Restraint
-
High Equipment Costs Hinder Adoption of Advanced Respiratory Protective Gear Among SMEs
Powered, high-tech respiratory protective equipment, including PAPRs and smart respirators, generally has high upfront costs, equal to approximately USD 500-USD 2,500 per unit. For a lot of SME and budget-sensitive sectors, these prices are high compared with simpler solutions. In addition to the purchase price, expenses changeable batteries, filter cartridges, and servicing devices all increase costs. User training and infrastructure upgrades are additional requisites imposed by complex systems, increasing the total cost of ownership further. Over 38% of small businesses accept high initial investment as the main obstacle to adoption. This has resulted in many cost-sensitive organizations continuing to select lower-cost choices that, no matter how ineffectively, do provide some level of protection, and thus limiting the reach of advanced RPE technology.
Respiratory Protective Equipment Market Segmentation Analysis:
By Product
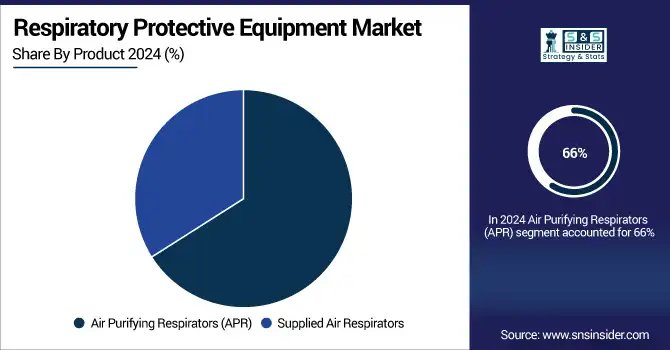
The Air Purifying Respirators (APR) segment dominated the market and accounted for 66% of the respiratory protective equipment market share. This is particularly true for businesses in manufacturing, mining, health care, and many other industries where APRs are favored by their cost, portability, and ease-of-use. These respirators clean the ambient air that passes through them by filtering contaminants, including dust, fume, vapors, and other airborne particles. These days, the APRs market is assisted by workplace safety regulations, increasing awareness with respect to respiratory health, and increasing consumer emphasis on personal protection products in developing regions. Along with their availability at higher levels in both disposable and reusable formats, this provides multi-use versatility in both industrial and non-industrial applications.
Supplied Air Respirators (SAR) are witnessing the fastest growth in the market due to their ability to offer a higher level of protection in high-risk environments. Unlike APRs, SARs provide fresh air from a different location, so they are typically used in dangerous or low-oxygen environments like chemical plants, pharmaceutical plants, and confined spaces. Growth is mainly driven by an increase in demand for advanced respiratory protection solutions in the presence of highly toxic environments, particularly in developed economies with strict safety regulations and standards in industrial setups. Another major factor is the growing consumption of Self-Contained Breathing Apparatus (SCBA) for oil & gas, petrochemical, and mining industries, as personnel may regularly be exposed to hazardous gases. Ongoing technology trends like built-in communication systems and a great utility comfort level are other growing popularity drivers.
By End Use
The healthcare sector held the dominant share of the respiratory protective equipment market in 2024, with approximately 24% share. Such leadership is spurred by the continued need for strict infection control in the field, frequent exposure to airborne pathogens, and occupational health and safety requirements for the sector. In a host of environments like operating rooms, labs, and patient care units where air quality needs strict management, respirators play an essential role in preventing the movement of pathogens or contaminating substances in or out of areas. Another factor that has helped keep demand steady is the ongoing growth of hospitals, diagnostic labs, and specialty clinics, particularly in emerging economies.
The construction industry is the fastest-growing segment in the respiratory protective equipment market, fueled by stricter safety regulations and increasing awareness of respiratory hazards on job sites. High-quality respirators are key as millions of workers are working around harmful particulates, especially dust, asbestos, silica, and vapours of chemicals. More demand has even come from steps by governments and industry bodies that are enforcing compliance with worker protection standards. In addition, the increasing infrastructure development across the globe, particularly in high-growth regions including Asia-Pacific and Latin America, is fuelling demand for personal protective equipment. Additionally, construction companies are focusing on ensuring the safety of employees, which will lead to increased productivity and lower costs in the long run due to deteriorating health, which in turn is expected to propel the growth of the segment.
Respiratory Protective Equipment Market Regional Outlook:
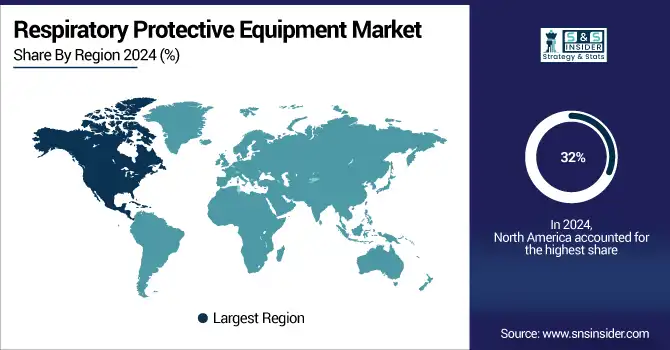
In 2024, North America emerged as the leading region in the Respiratory Protective Equipment (RPE) market, capturing a 32% share. A major feature of this dominance is how OSHA, NIOSH, and other workplace safety regulators require respirator use across industries. Occupational hazards, high awareness about occupational hazards among the healthcare, manufacturing, construction, and oil & gas industries has largely propelled product demand. PAPR and smart masks can be considered as advanced versions of an actively ventilated respirator, and the U.S. is heavily invested in them. In addition, the region has a dominating presence of key RPE manufacturers and a robust distribution network. North America continues to lead the way due to its continuous focus on worker health and safety.
In the U.S., Respiratory Protective Equipment was valued at USD 3.84 billion in 2024 and is anticipated to attain a market size of USD 6.62 billion by 2032, growing at a CAGR of 7.06% from 2025 to 2032. Even so, growth is powered by stringent OSHA regulations and increasing healthcare and industrial demand and adoption of technologically advanced PPE devices, including PAPRs and smart respirators.
Asia-Pacific is currently the fastest-growing region in the global RPE market, driven by ongoing industrialization, growing manufacturing activities, and increasing awareness of occupational health. Increasing sectors such as mining, construction, and pharmaceuticals in China, India, South Korea, Indonesia, and other countries of- Asia-Pacific region are inciting the volume requirement of respiratory protective equipment. New laws coming from the government, largely based on pressures to protect workers who operate in industries that are covered by many pollution control efforts, are forcing conformity in gear that will protect workers. International players and local manufacturers are creating more competition and innovation. With workplace safety becoming a greater focus, the market in the Asia-Pacific is expected to see continued double-digit growth for the next several years.
China dominates the Asia-Pacific RPE market due to its extensive industrial base across sectors like manufacturing, construction, and mining. Demand has been robust due to strengthened enforcement of occupational safety regulations coupled with growing awareness of the protection of workers. China, too, has extensive local production capabilities, combined with heavy investments in advanced safety technologies, solidifying its regional dominance.
Europe accounts for a significant share of the respiratory protective equipment market, due to its mature industrial base and stringent safety regulations under European Union directives. Countries such as Germany, the UK, and France have had a proactive safety culture for some time and require adherence to occupational health standards. Advanced respirators witness high adoption in chemical processing, pharmaceuticals public health sector in the region. European manufacturers are also spearheading innovations in environment-friendly and intelligent RPE technologies to fulfil safety as well as sustainability objectives. Furthermore, increasing global air quality and industrial emissions concerns are leading companies to provide high-efficiency protective gear to workers. In general, Europe is a steady presence in the market primarily thanks to regulation and modernization by industries for innovations.
Get Customized Report as per Your Business Requirement - Enquiry Now
Key Players in the Respiratory Protective Equipment Market are:
Respiratory Protective Equipment Companies are 3M, Alpha Pro Tech Limited, Ansell Ltd., Honeywell International Inc., Avon Rubber plc, MSA Safety Incorporated, Delta Plus Group, Bullard, DuPont, Kimberly-Clark Corporation
Recent Development:
-
In March 2025, Ansell expanded its PPE portfolio by integrating Kimtech and KleenGuard brands, following the acquisition of Kimberly-Clark’s PPE division. Its North American and European teams began handling these product lines, with Latin America and Asia-Pacific set to follow in June 2025. Ansell also launched the RightCycle recycling program and APEX cleanroom services as part of the expansion.
-
In January 2025, in response to severe wildfires in Los Angeles, 3M partnered with Direct Relief to donate 5 million N95 respirators. The masks are pre-positioned for rapid distribution through clinics and nonprofits like the YMCA, helping protect first responders and residents from smoke exposure.
-
In April 2025, MSA Safety unveiled major upgrades to its G1 SCBA platform at FDIC 2025, introducing the new G1 SCBA XR Edition with enhanced regulator and removable soft goods for easier cleaning. The updates are fully backward-compatible with existing units. MSA also debuted the Globe G‑XTREME PRO turnout jacket and showcased connected technologies like FireGrid and the lightweight Cairns 1836 helmet.
| Report Attributes | Details |
|---|---|
| Market Size in 2024 | USD 16.20 Billion |
| Market Size by 2032 | USD 29.04 Billion |
| CAGR | CAGR of 7.57% From 2025 to 2032 |
| Base Year | 2024 |
| Forecast Period | 2025-2032 |
| Historical Data | 2021-2023 |
| Report Scope & Coverage | Market Size, Segments Analysis, Competitive Landscape, Regional Analysis, DROC & SWOT Analysis, Forecast Outlook |
| Key Segments | • By Product (Air Purifying Respirators (APR), Unpowered Air-Purifying Respirators, Disposable Filtering Half Mask Respirator, Half Mask Respirator, Full Face Mask Respirator, Powered Air-Purifying Respirators (PAPR), Half Mask Respirator, Full Face Mask Respirator, Helmets, Hoods, Visors, Escape Respirators, Supplied Air Respirators, Self-contained Breathing Apparatus, Full Face Masks, Airline Respirators) • By End Use (Oil & Gas, Fire Services, Petrochemical/chemical, Industrial, Pharmaceutical, Construction, Healthcare, Mining, Others) |
| Regional Analysis/Coverage | North America (US, Canada, Mexico), Europe (Germany, France, UK, Italy, Spain, Poland, Turkey, Rest of Europe), Asia Pacific (China, India, Japan, South Korea, Singapore, Australia, Rest of Asia Pacific), Middle East & Africa (UAE, Saudi Arabia, Qatar, South Africa, Rest of Middle East & Africa), Latin America (Brazil, Argentina, Rest of Latin America) |
| Company Profiles | 3M, Alpha Pro Tech Limited, Ansell Ltd., Honeywell International Inc., Avon Rubber plc, MSA Safety Incorporated, Delta Plus Group, Bullard, DuPont, Kimberly-Clark Corporation |
Frequently Asked Questions
Ans: The North America region dominated the Respiratory Protective Equipment market in 2024.
Ans: The “Air Purifying Respirators (APR)” segment dominated the Respiratory Protective Equipment market.
Ans: Regulatory Enforcement and Workplace Safety Standards Driving Respiratory Protective Equipment Demand
Ans: The Respiratory Protective Equipment market was USD 16.20 billion in 2024 and is expected to reach USD 29.04 billion by 2032.
Ans: The Respiratory Protective Equipment market is expected to grow at a CAGR of 7.57% from 2025-2032.
Get in Touch
