Revenue Assurance Market Report Scope & Overview:
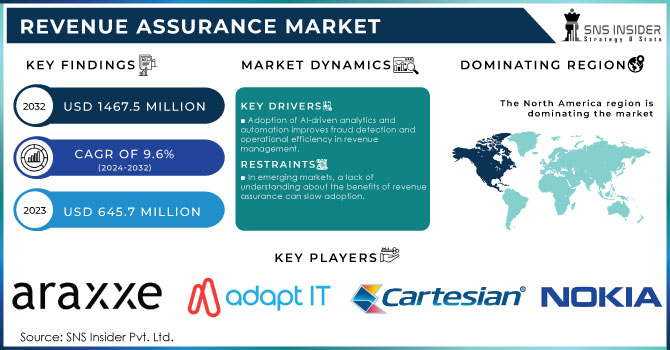
The Revenue Assurance Market Size was valued at USD 645.7 million in 2023 and is expected to reach USD 1467.5 million by 2032, growing at a CAGR of 9.6% from 2024-2032.
Get More Information on Revenue Assurance Market - Request Sample Report
The revenue assurance market focuses on solutions and services that help businesses, primarily in the telecom industry, optimize and ensure accuracy in their revenue streams by identifying and correcting errors in billing, transactions, and data handling. The increasing complexity of business operations due to digital transformation, particularly in telecommunications, creates a higher demand for revenue assurance solutions to manage new digital services, complex billing processes, and hybrid ecosystems. Additionally, the rise of 5G technology, the Internet of Things (IoT), and cloud-based services has added new revenue streams, increasing the need for systems that can track and assure the accuracy of these revenues.
Another factor is the growing adoption of automation and AI-powered analytics in revenue assurance. These advanced tools improve the ability to detect fraud, prevent revenue leakages, and enhance operational efficiency, encouraging more companies to invest in these solutions. Furthermore, stringent regulatory requirements around billing and revenue management, particularly in financial and telecom sectors, are pushing companies to implement robust revenue assurance measures to avoid compliance issues and financial losses.
Emerging markets in Asia-Pacific and Latin America are also contributing to the sector’s growth, as telecom providers in these regions rapidly expand their infrastructure and service offerings, demanding more advanced revenue assurance systems. Finally, the increase in fraudulent activities in the digital space, combined with the need for real-time monitoring and transparency in transactions, has led to a surge in demand for revenue assurance solutions across various industries beyond telecom, such as banking, insurance, and utilities.
Market Dynamics
Drivers
-
Rapid infrastructure development in Asia-Pacific and Latin America boosts demand for revenue assurance tools.
-
New revenue streams from 5G, IoT, and cloud services demand better revenue assurance systems.
-
Adoption of AI-driven analytics and automation improves fraud detection and operational efficiency in revenue management.
In the revenue assurance market, the adoption of AI-driven analytics and automation plays a crucial role in improving fraud detection and operational efficiency. Traditional revenue assurance methods often involve manual processes and are time-consuming, leaving room for errors and delays in identifying revenue leakages or fraudulent activities. AI-powered analytics, on the other hand, can quickly process large volumes of data in real time, identifying patterns and anomalies that might indicate fraud, billing errors, or inefficiencies in revenue processes.
For instance, in the telecom industry, AI can track millions of transactions simultaneously, flagging irregularities that humans may miss. This not only enhances the ability to detect and prevent fraud but also allows for predictive analytics, helping companies address potential revenue issues before they become significant problems. Moreover, automation streamlines repetitive and complex tasks, reducing human intervention and the possibility of errors. By automating processes like data reconciliation, error correction, and compliance checks, companies improve operational efficiency, lower costs, and ensure faster response times. This technology-driven approach provides more accuracy and reliability in managing revenue streams, making AI and automation key drivers in the evolving Revenue Assurance landscape.
The rise of 5G, IoT, and cloud services introduces new, complex revenue streams, particularly in industries like telecom, that require more advanced revenue assurance systems. As these technologies enable high-speed connectivity, billions of devices, and seamless cloud integration, service providers must manage intricate billing structures, data flows, and service packages. Traditional revenue assurance methods may struggle to handle the complexity of these new services, leading to revenue leakages or errors. With 5G and IoT, real-time monitoring and accurate tracking of numerous micro-transactions become essential.
Restraints
-
In emerging markets, a lack of understanding about the benefits of revenue assurance can slow adoption.
-
Legacy systems in telecom and other industries may face difficulties integrating with modern revenue assurance solutions, leading to delays and inefficiencies.
-
With the increasing use of AI and cloud services, concerns over data security and privacy can hinder market growth.
As the revenue assurance market increasingly adopts AI and cloud-based solutions, concerns over data security and privacy are growing. AI-driven analytics rely on large volumes of sensitive data, including financial transactions, customer details, and billing information. Storing and processing this data in cloud environments raises the risk of cyberattacks, breaches, or unauthorized access, which can compromise confidential information.
For companies, particularly in industries like telecom and finance, the fear of exposing critical customer data may slow the adoption of cloud-based revenue assurance solutions. Additionally, as data privacy regulations such as GDPR become stricter, businesses must ensure compliance, which can be challenging and expensive. In the future, companies offering revenue assurance services will need to prioritize robust security measures—such as encryption, secure data handling practices, and regulatory compliance frameworks—to alleviate these concerns.
In the revenue assurance market, one major challenge is the integration of modern revenue assurance solutions with legacy systems, especially in industries like telecom. Many telecom companies still rely on outdated infrastructure and software designed for simpler billing and revenue management processes. As these systems were not built to handle the complexities of 5G, IoT, and cloud-based services, integrating new, advanced revenue assurance technologies becomes difficult. This leads to delays, inefficiencies, and potential revenue leakages during the transition. For instance, modern solutions utilizing AI, automation, and real-time analytics are crucial for detecting revenue discrepancies swiftly, but they often struggle to sync with older systems. According to industry reports, nearly 70% of telecom operators cite system integration challenges as a key barrier to adopting new revenue assurance technologies.
Segment Analysis
By Component
In 2023, the software segment dominated the market and captured the largest revenue share of 64.3%, driven by the availability of highly flexible and innovative revenue assurance software. This software employs a distinctive process-driven methodology that significantly enhances service providers' business and financial performance by effectively identifying revenue leakages within their networks. It enables traffic monitoring to detect irregularities that may indicate misuse of services, providing a flexible and user-friendly environment for managing critical events, and allowing for the automatic suspension of specific services when particular conditions are fulfilled.
Meanwhile, the service segment is projected to grow at the fastest CAGR of 14.6% during the forecast period. This segment includes planning and consulting, operations and maintenance, system integration, and managed services. Various industries worldwide are increasingly adopting both revenue assurance software and services to mitigate the impact of revenue leakages. The rising need for organizations to understand the potential consequences of revenue loss is driving this growth.
By Deployment
In 2023, the cloud segment dominated the market with the largest revenue share at 52.9% and is projected to grow at the fastest CAGR during the forecast period. The transition from on-premise to cloud solutions is anticipated to generate a variety of opportunities in the market in the coming years. Cloud technology allows operators to benefit from high speed, agility, and improved management of revenue and fraud. For example, WeDo Technologies focuses on providing components for revenue assurance and fraud management, continually investing in its cloud-based solutions to help telecom operators safeguard their revenues and reduce fraud.
Moreover, the on-premise segment is anticipated to experience significant growth over the forecast period, primarily due to the exceptional security it offers. With on-premise deployments, organizations can store critical data without third-party access. While cloud solutions have gained popularity, on-premise components may still effectively meet the business needs of many organizations.
By End-Use
In 2023, the telecom segment held the largest revenue share of 38.4% and is projected to grow at the fastest CAGR during the forecast period. This growth is driven by the rising incidence of telecom fraud, a major contributor to revenue leakages in the industry. According to the Fraud Loss Survey by the Communications Fraud Control Association (CFCA), telecom operators lose approximately $29.2 billion annually, which equates to 1.27% of global telecom revenues, due to various forms of fraud. In addition to fraud, revenue leakage also arises from communication gaps in planning, inadequate system coordination, inefficient processes, the introduction of new products, and improperly managed call detail records and tariffs.
The BFSI sector is projected to see strong growth throughout the forecast period. Revenue leakage can occur across nearly all areas of a bank, affecting both commercial and retail customers and contributing to income loss. The implementation of revenue assurance initiatives has shown significant success in the banking industry, creating numerous opportunities for market growth.
Regional Analysis
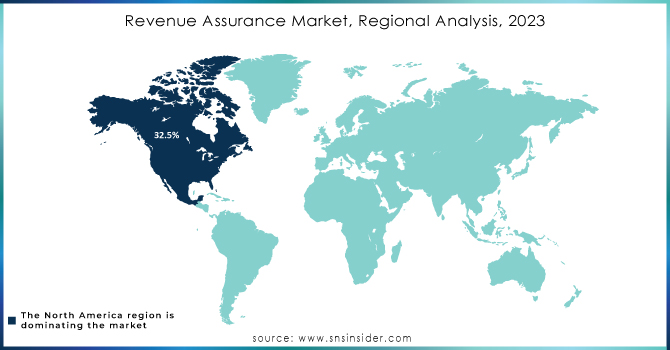
North America led the market in 2023 and captured the largest revenue share at 32.5%. This dominance is primarily due to the favorable business environment in the U.S. and robust consumer support, which drive innovation and technology investment. The region has seen increasing empowerment and visibility of revenue assurance initiatives, fueled by a strong telecom sector and heightened awareness of how revenue leakages impact overall profitability for organizations.
The Asia Pacific region is projected to grow at the fastest CAGR of 17.3% during the forecast period. This growth is primarily driven by the rising demand for cloud-based services from small and mid-sized companies. The region is experiencing rapid digital transformation, which is expected to lead to substantial investments in new and advanced technologies. Additionally, the flourishing telecom sector in the Asia Pacific is further supporting market expansion.
Need any customization research on Revenue Assurance Market - Enquiry Now
KEY PLAYERS:
-
Amdocs - (Revenue Assurance Platform, Intelligent Revenue Management)
-
Hewlett Packard Enterprise (HPE) - (HPE Revenue Assurance, HPE Revenue Optimization)
-
Araxxe - (Araxxe Revenue Assurance, Araxxe Fraud Detection)
-
Adapt IT - (Revenue Assurance Suite, Fraud Detection Platform)
-
Cartesian - (Revenue Assurance Platform, Fraud Management Solution)
-
Digital Route - (Revenue Assurance Suite, Fraud Detection Platform)
-
eClerx - (Revenue Assurance Services, Fraud Detection Services)
-
Itron - (Revenue Assurance Solutions, Meter Data Management)
-
Nokia - (Revenue Assurance Solutions, Network Performance Management)
-
Profit Insight - (Revenue Assurance Software, Fraud Detection Software)
-
Sagacity Solutions - (Revenue Assurance Platform, Fraud Detection Platform)
-
Sandvine - (Revenue Assurance Solutions, Policy and Charging Control)
-
Sigos - (Revenue Assurance Software, Fraud Detection Software)
-
Subex - (Revenue Assurance Suite, Fraud Detection Suite)
-
Synthesis Systems - (Revenue Assurance Software, Fraud Detection Software)
-
Tata Consultancy Services (TCS) - (Revenue Assurance Services, Fraud Detection Services)
-
Teoco - (Revenue Assurance Solutions, Network Performance Management)
-
TransUnion - (Fraud Detection Services, Credit Reporting)
-
WeDo - (Revenue Assurance Platform, Fraud Detection Platform)
-
Xintec - (Revenue Assurance Software, Fraud Detection Software)
Recent Developments:
-
In Nov 23, Subex Technologies announced a partnership with a leading European telecom operator to implement its ROC Revenue Assurance platform, focusing on fraud detection and revenue optimization.
-
In Oct 23, Amdocs launched a new AI-powered revenue assurance solution that uses machine learning to identify and prevent revenue leakage.
-
In July 2023, Amdocs made a significant announcement regarding the acquisition of TEOCO's service assurance business. This strategic move was aimed at enhancing Amdocs' ability to offer service providers a comprehensive end-to-end service orchestration solution. The goal is to ensure the quality of services and maximize the monetization of cutting-edge dynamic customer experiences.
| Report Attributes | Details |
| Market Size in 2023 |
US$ 645.7 Million |
| Market Size by 2031 |
US$ 1467.5 Million |
| CAGR |
CAGR of 9.6% From 2024 to 2032 |
| Base Year |
2023 |
| Forecast Period |
2024-2031 |
| Historical Data |
2020-2022 |
| Report Scope & Coverage |
Market Size, Segments Analysis, Competitive Landscape, Regional Analysis, DROC & SWOT Analysis, Forecast Outlook |
| Key Segments |
• By Component (Software, Services) |
| Regional Analysis/Coverage | North America (US, Canada, Mexico), Europe (Eastern Europe [Poland, Romania, Hungary, Turkey, Rest of Eastern Europe] Western Europe] Germany, France, UK, Italy, Spain, Netherlands, Switzerland, Austria, Rest of Western Europe]), Asia Pacific (China, India, Japan, South Korea, Vietnam, Singapore, Australia, Rest of Asia Pacific), Middle East & Africa (Middle East [UAE, Egypt, Saudi Arabia, Qatar, Rest of Middle East], Africa [Nigeria, South Africa, Rest of Africa], Latin America (Brazil, Argentina, Colombia, Rest of Latin America) |
| Company Profiles | Amdocs, Hewlett Packard Enterprise (HPE), Araxxe, Adapt IT, Cartesian, Digital Route, eClerx, Itron, Nokia, Profit Insight |
| Key Drivers |
• New revenue streams from 5G, IoT, and cloud services demand better revenue assurance systems. |
| Key Restraints |
• Legacy systems in telecom and other industries may face difficulties integrating with modern revenue assurance solutions, leading to delays and inefficiencies. |
Frequently Asked Questions
Ans. The primary growth tactics of Revenue Assurance market participants include merger and acquisition, business expansion, and product launch.
Ans: The expected CAGR of the Revenue Assurance Market during the forecast period is 9.6%.
Ans: - Market progress is dependent on human-led services.
Ans: Revenue Assurance Market was valued at USD 645.7 million in 2023 and is expected to reach USD 1467.5 million by 2032, growing at a CAGR of 9.6% from 2024-2032.
North America led the market in 2023 and captured the largest revenue share at 32.5%. This dominance is primarily due to the favorable business environment in the U.S. and robust consumer support, which drive innovation and technology investment.
Get in Touch
