Content Services Platforms Market Size & Overview:
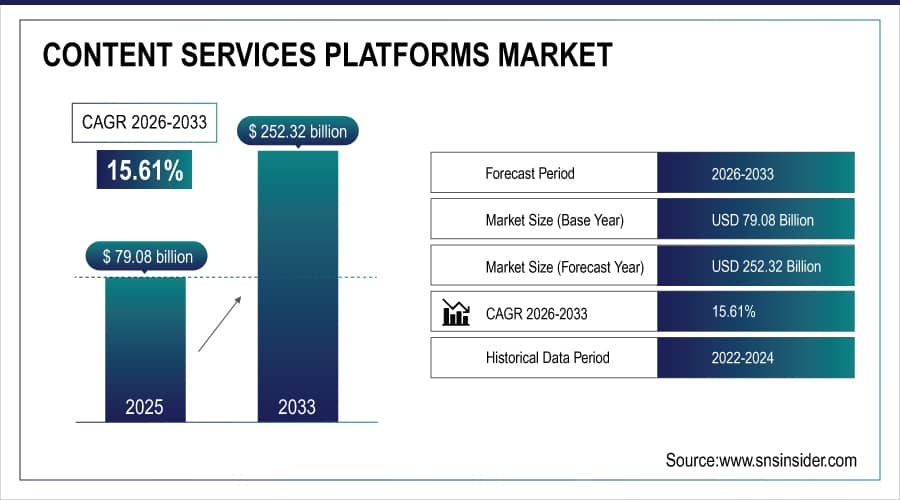
Content Services Platforms Market was valued at USD 79.08 billion in 2025E and is expected to reach USD 252.32 billion by 2033, growing at a CAGR of 15.61% from 2026-2033.
To Get More Information On Content Services Platforms Market - Request Free Sample Report
Rapid enterprise-wide digital transformation, rising demand for secure content management, and the shift toward cloud-based platforms are significantly accelerating growth in the Content Services Platforms Market. Increasing regulatory compliance needs, expanding remote and hybrid work environments, and the adoption of AI-driven automation for content classification and workflow optimization further support market expansion. Growing volumes of unstructured data and the need for seamless collaboration also strengthen long-term growth momentum.
Content Services Platforms Market Size and Forecast
-
Market Size in 2025E: USD 79.08 Billion
-
Market Size by 2033: USD 252.32 Billion
-
CAGR: 15.61% from 2026 to 2033
-
Base Year: 2025E
-
Forecast Period: 2026–2033
-
Historical Data: 2022–2024
Content Services Platforms Market Trends
-
Rising demand for digital transformation and streamlined document management is driving the content services platforms (CSP) market.
-
Growing adoption of cloud-based solutions is enhancing collaboration, scalability, and remote access.
-
Expansion of AI, automation, and analytics integration is improving content processing, workflow efficiency, and decision-making.
-
Increasing need for regulatory compliance, data security, and information governance is shaping adoption trends.
-
Focus on omnichannel content delivery and personalized customer engagement is boosting market growth.
-
Rising investments in enterprise content management and knowledge management solutions are fueling adoption.
-
Collaborations between software vendors, IT service providers, and enterprises are accelerating innovation and deployment globally.
Content Services Platforms Market Growth Drivers:
-
Increasing demand for digital transformation initiatives across enterprises is fueling the adoption of advanced content services platforms globally
Organizations are rapidly shifting toward digital workflows to enhance operational efficiency, collaboration, and content accessibility. Content services platforms (CSPs) provide centralized document management, automated processes, and secure cloud storage, enabling seamless information sharing across departments. The growing emphasis on remote work, hybrid environments, and compliance requirements is further driving CSP adoption. Enterprises are leveraging these platforms to streamline content lifecycle management, reduce manual tasks, and enhance productivity. Additionally, AI and analytics integration within CSPs enables intelligent content classification and decision-making, making these platforms essential for modern business operations and digital transformation strategies.
Content Services Platforms Market Restraints:
-
Complexity of integrating content services platforms with existing enterprise systems slows down market growth
Many enterprises rely on legacy systems and multiple disconnected tools for document management, collaboration, and workflow automation. Integrating CSPs with these existing applications can be technically challenging, requiring extensive planning, development, and testing. Compatibility issues, data migration risks, and potential downtime can disrupt ongoing operations. Moreover, employees may resist adapting to new systems without adequate training and change management. The perceived complexity and potential operational disruptions reduce the speed of CSP adoption, particularly in organizations with rigid IT infrastructure, diverse application ecosystems, or limited in-house technical expertise, thereby restraining overall market growth.
Content Services Platforms Market Opportunities:
-
Expanding adoption of AI, machine learning, and automation in content services platforms offers significant growth potential
The integration of AI and ML technologies into CSPs enables intelligent content categorization, predictive analytics, and automated workflows. Organizations can extract valuable insights from unstructured data, improve decision-making, and enhance operational efficiency. Automation reduces manual intervention in repetitive tasks such as document routing, approvals, and compliance reporting, freeing employees to focus on strategic initiatives. Growing demand for cognitive content services in sectors like healthcare, finance, and legal presents an opportunity for CSP vendors to differentiate their offerings. Investments in AI-driven CSP solutions are expected to drive market expansion and create new revenue streams globally.
Content Services Platforms Market Segment Analysis
By Component, Solutions segment dominated the Market, while Services are expected to register the highest CAGR
Solutions segment held the largest revenue share of over 62.5% in 2025 and is expected to continue its dominance during the forecast period. This category covers a wide range of capabilities, such as workflow automation, document management, records management, content collaboration and integration with other enterprise systems to help organizations effectively manage their content and document workflows.
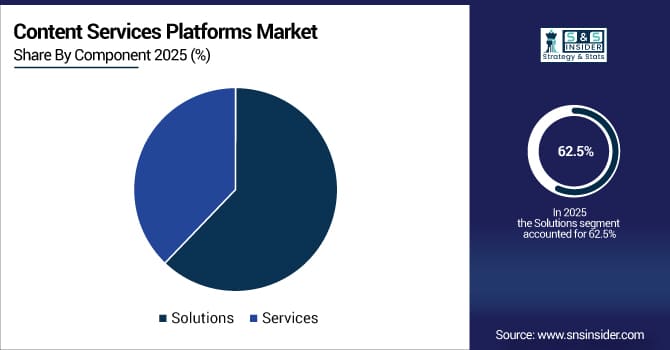
On the other hand, the services segment is anticipated to show highest CAGR during the forecast period. This growth of the content services platform segment is being driven by the increasing adoption of document and records management, workflow and case management, data capture, information security and governance (ISG) as well as content reporting and analytics. They offer flexible digital workflow solutions that reduces content sprawl and information silos, enhances security and accessibility, creates an improved experience for customers and employees, and increases productivity through more efficient means of sharing content.
By Deployment, Cloud segment led the Market, with On-Premise expected to grow at the fastest CAGR
In 2025, the cloud segment held a significant revenue share of over 54.7% and is anticipated to maintain its leading position during the forecast period. Such as automation, stacked content libraries, image & video+ capabilities, email updates and link monitoring are some of the features driving an uptick in adoption. Content services platforms, especially those offered as cloud-based solutions have proven substantial benefits for all types of business like big, small, enterprise or SME. Given the continuous evolution in technology, it can be expected that cloud solutions will continue to retain the lead position amongst content management with organisations being able to utilise these cloud solutions for dynamic and flexible content and digital asset management.
On-premise segment, however, is expected to witness highest growth rate during the forecast period. On-premise ecosystems demand a significantly higher investment cost upfront versus the cloud, but they don't carry incremental costs associated with ongoing usage over time. The growth of this segment can be attributed to factors such as lower cost in the long run and increase demand to mitigate cyberattack and data loss risks.
By End-Use, IT & Telecommunications segment led the Market, Government & Public Sector is projected to grow at the highest CAGR
The IT and telecommunications segment dominated the market and represented the largest revenue share of over 27.3% in 2025, and this dominance is projected to continue throughout the forecast period. This expanding data within IT and telecommunications businesses actually pushes the requirement of content services platform in this space. Content service providers and solution providers big enough as Microsoft and IBM provides industry telecom specific solutions to improve operational and BSS efficiencies, deliver unified communications solutions to empower the telecom workforce with a consistent experience from anywhere using any device accelerating next-generation network functions/solutions implementation, improving their quality of servicer on also in-depth customer insights related to experiences.
Conversely, the government and public sector is expected to grow at a higher compound annual growth rate during this period, due to growing requirement for efficient document & information management. This sector consists of government agencies, public institutions as well as other organizations, and involves the use and processing of large-scale amounts of information and documentation; from citizens records to financial and legal documents. The increasing need to digitize and store massive amounts of public data poses a major challenge for governmental agencies, creating multibillion-dollar growth opportunities over the next several years.
Content Services Platforms Market Regional Analysis
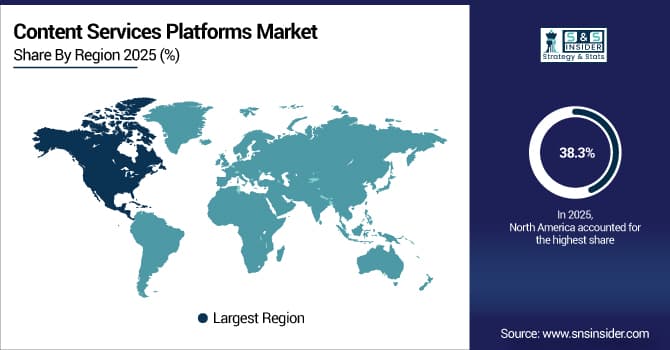
North America Content Services Platforms Market Insights
North America held the largest market share, surpassing 38.3% in 2025, and is expected to sustain this leading position throughout the forecast period. The rapid adoption of content services platforms in the region significantly drives market growth. Additionally, the prominent presence of major players such as Microsoft (U.S.), Hyland Software, Inc. (U.S.), IBM (U.S.), and Open Text Corporation (Canada) further supports market expansion. Numerous industries, including financial services, healthcare, manufacturing, and government, have widely implemented content services platforms as organizations increasingly acknowledge the essential role of effective content management in boosting productivity and ensuring compliance.
Get Customized Report as Per Your Business Requirement - Enquiry Now
Asia Pacific Content Services Platforms Market Insights
In contrast, the Asia Pacific region is projected to experience the highest compound annual growth rate (CAGR) during the forecast period. Factors such as growing digitization, improved IT infrastructure, a substantial skilled workforce, and the rapid growth of sectors like BFSI, IT and telecommunications, and government in countries like India, China, and Japan are fueling the content services platforms market in this area. Many organizations in the Asia Pacific region are actively engaging in digital transformation initiatives to improve efficiency, productivity, and customer experience.
Europe Content Services Platforms Market Insights
The Europe Content Services Platforms Market is expanding steadily due to strong digital transformation initiatives, strict data protection regulations such as GDPR, and a rising preference for cloud-based content management solutions. Enterprises are increasingly adopting AI-enabled platforms to streamline workflows, enhance compliance, and improve collaboration across distributed teams. Growing volumes of enterprise data, alongside demand for secure and automated content governance, further contribute to the market’s upward trajectory across the region.
Middle East & Africa and Latin America Content Services Platforms Market Insights
The Middle East & Africa and Latin America Content Services Platforms Market is growing as organizations accelerate digital modernization, adopt cloud-based solutions, and strengthen content governance. Increasing demand for secure document management, workflow automation, and compliance support is boosting adoption across sectors such as BFSI, telecom, and government. Expanding mobile usage, rising investments in enterprise IT, and the need for efficient collaboration tools further drive market momentum across both regions.
Content Services Platforms Market Competitive Landscape:
Hyland Software, Inc.
Hyland Software is a global leader in enterprise content management (ECM), providing cloud-native, AI-powered solutions across OnBase, Alfresco, Nuxeo, and Perceptive platforms. The company focuses on document management, workflow automation, content intelligence, and knowledge discovery, helping organizations modernize operations, improve productivity, and enhance decision-making. Hyland emphasizes generative-AI integration and unified content services to streamline enterprise information governance and optimize digital workplace experiences.
-
2025: Hyland announced major enhancements across its Content Innovation Cloud AI-powered content intelligence, automation, and cloud-native services for OnBase, Alfresco, Nuxeo enabling generative AI, document processing, knowledge discovery, and unified content management.
-
2024: At CommunityLIVE 2024, Hyland unveiled a new Content Innovation Cloud vision to unify content-management platforms under a cloud/AI-enabled architecture, aiming to modernize enterprise content services.
Box, Inc.
Box, Inc. provides cloud-based content management and collaboration solutions, helping organizations securely store, manage, and automate unstructured data. The company emphasizes AI-driven content intelligence, workflow automation, and compliance, enabling enterprises to optimize content lifecycle management. Box integrates with enterprise systems and cloud platforms to support metadata-driven processes, generative-AI workflows, and advanced content analytics for improved productivity, governance, and seamless collaboration across teams.
-
2025: Box signed a multi-year strategic collaboration with AWS to bring agentic AI-powered enterprise content management, integrating Box Content Cloud with AWS AI and compliance capabilities.
-
2024: Box released AI-powered Intelligent Content Management innovations: “Box AI Studio” and “Box Apps,” enabling enterprises to build custom workflows, metadata-driven processes, and advanced unstructured-content handling.
Adobe Inc.
Adobe is a global leader in digital media and content services, delivering cloud-based tools for document management, creative workflows, and enterprise content intelligence. Adobe leverages generative AI across Acrobat, Document Cloud, and Experience Cloud to provide conversational document queries, content personalization, analytics, and AI-driven automation. Its solutions enhance productivity, enable enterprise-scale content governance, and empower organizations to deliver data-driven, personalized digital experiences across multiple channels.
-
2024: Adobe introduced a generative-AI AI Assistant (beta) in Acrobat/Reader, enabling conversational queries, summaries, and intelligent navigation of PDFs and corporate documents, evolving Document Cloud content-services capabilities.
-
2024: At Adobe Experience Cloud, the company unveiled new tools (Content Analytics, Journey Optimizer enhancements) to personalize and measure AI-generated content across channels, leveraging content management, analytics, and CMS integration.
Microsoft Corporation
Microsoft provides cloud-based productivity and collaboration solutions through Microsoft 365, SharePoint, and Viva platforms, integrating content services, document management, intranet solutions, and AI-enabled workflow automation. The company focuses on secure, modern content services, governance, and collaborative intranet experiences. Microsoft continuously evolves its offerings to enhance document lifecycle management, enable intelligent content discovery, and provide scalable, enterprise-grade solutions for modern workplaces.
-
2025: Microsoft rolled out new SharePoint / Viva Connections updates including an “Editorial card” web-part for pages/news and improved document-library forms refining content-services, intranet, and collaboration capabilities.
-
2025: Microsoft announced the retirement of SharePoint Add‑Ins and updates to the content-connectivity model, signaling a shift toward modernized, more secure, and better-governed SharePoint-based content services.
Key Players
The major key players are
-
Microsoft Corporation
-
IBM Corporation
-
OpenText Corporation
-
Box, Inc.
-
Adobe Inc.
-
Alfresco Software, Inc.
-
Laserfiche
-
DocuWare GmbH
-
Nuxeo (a part of Hyland)
-
Conga
-
KnowledgeLake
-
ZyLAB Technologies
-
DocuSign
-
Google Workspace (formerly G Suite)
-
Evernote Corporation
-
SaaS Technology (Trello, Asana, etc.)
Get in Touch
