RF Power Amplifier Market Report Scope & Overview:
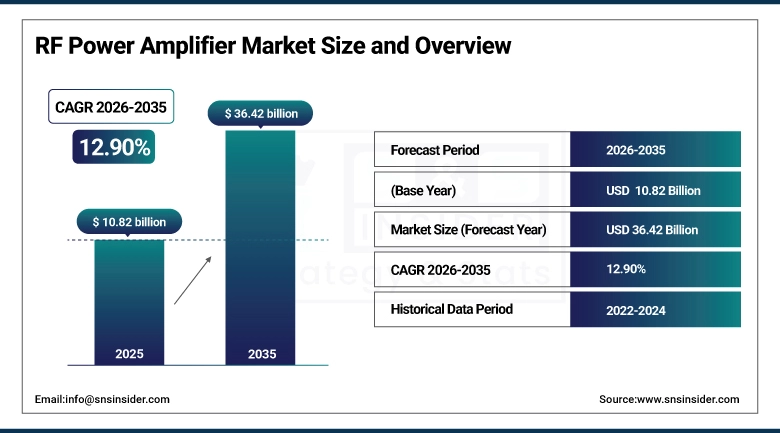
The RF Power Amplifier Market Size was valued at USD 10.82 Billion in 2025 and is projected to reach USD 36.42 Billion by 2035, growing at a CAGR of 12.90% during 2026–2035.
The growth of RF Power Amplifier Market is majorly driven by the rapid growth of 5G networks, rise in demand for high-speed wireless communication, and an increase in adoption of connected devices and IoT technologies. Then, the further increase of efficiency and better performance through the advances in the technology of the semiconductor materials such as GaN and LDMOS. Further, their increasing applications in aerospace, defence, automotive radar and satellite communication is also propelling demand. The demand for energy-efficient, small, and high-frequency devices also aids the growth of the market in both commercial and industrial spaces.
RF Power Amplifier Market Size and Forecast:
-
Market Size in 2025: USD 10.82 Billion
-
Market Size by 2035: USD 36.42 Billion
-
CAGR: 12.90% during 2026–2035
-
Base Year: 2025
-
Forecast Period: 2026–2035
-
Historical Data: 2022–2024
To Get more information on RF Power Amplifier Market - Request Free Sample Report
RF Power Amplifier Market Key Trends:
-
5G deployment, IoT expansion, and high-speed data demand are driving the fastest-growing application segment.
-
GaN technology is gaining popularity due to higher efficiency and power density, while LDMOS remains widely used in telecom infrastructure.
-
Increasing focus on energy-efficient and thermally optimized amplifiers to meet sustainability and performance requirements.
-
Expansion of RF power amplifiers in satellite communication, aerospace, and defense applications.
-
High dependence on semiconductor supply chains, particularly in Asia, posing geopolitical and supply risks.
-
Rising demand for compact, lightweight amplifiers for mobile devices and wearable technologies.
-
Specialized RF amplifiers are increasingly required for automotive radar and military systems, where high reliability and precision are critical.
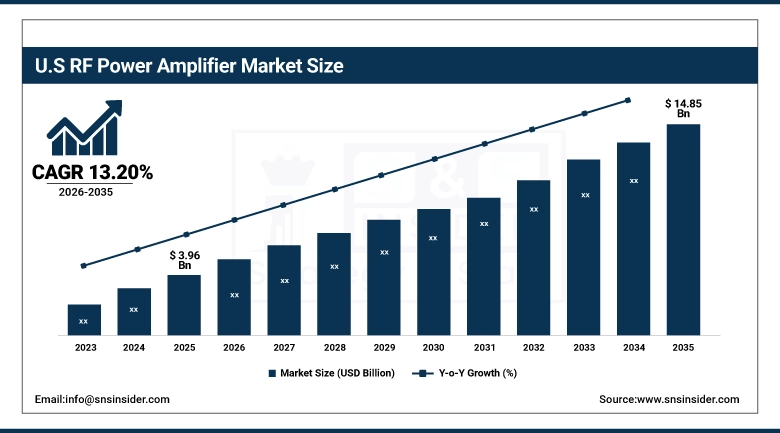
U.S. RF Power Amplifier Market Size Outlook:
The U.S. RF Power Amplifier Market size was valued at USD 3.96 Billion in 2025 and is projected to reach USD 14.85 Billion by 2035, growing at a CAGR of 13.20% during 2026–2035.Growth in the U.S. RF Power Amplifier market is driven by rapid 5G deployment, strong defense and aerospace investments, increasing demand for high-speed connectivity, and advancements in GaN technology, along with rising adoption of IoT devices and next-generation wireless infrastructure.
RF Power Amplifier Market Key Drivers:
-
Rising demand for high-speed wireless communication and rapid 5G network deployment are driving the growth of the RF power amplifier market.
With the growing popularity of Internet of Things (IoT) devices, ever more connected technologies, and smart infrastructure, demand for effective RF amplification is being further enhanced. Also, new materials like GaN and LDMOS semiconductors are paving the way to higher performance, efficiency, and power density. Significant growth in aerospace & defense, satellite communication and automotive radar system applications is another factor driving the growth of the market.
RF Power Amplifier Market Key Restraints:
-
High manufacturing costs and thermal management challenges are restraining the growth of the RF power amplifier market.
The solution would still be costly to mass-produce since high-frequency and high-power amplifiers are complex to design, and therefore, difficult to produce at a mass scale, especially for smaller players. The reliance on semiconductor supply chains, mostly in Asia, poses geopolitical and supply disruption risks. Moreover, power efficiency problems and heat dissipation paradoxes in small form factor systems demand additional cooling capabilities, and thus add costs to the complete system.
RF Power Amplifier Market Key Opportunities:
-
Expanding adoption of 5G, satellite communication, and next-generation wireless technologies is creating significant opportunities for the RF power amplifier market.
Increasing automotive radar applications driven by demand for electric vehicles as well as autonomous driving systems and advanced driver-assistance systems create fresh opportunities for RF amplifiers. Increased investments to modernize arms, launch new projects in space exploration, and develop IoT ecosystems are also spurring innovation. In addition, energy saving and miniaturized radio frequency (RF) solution developments provide a growth opportunity in consumer electronics and industrial applications.
RF Power Amplifier Market Segments:
-
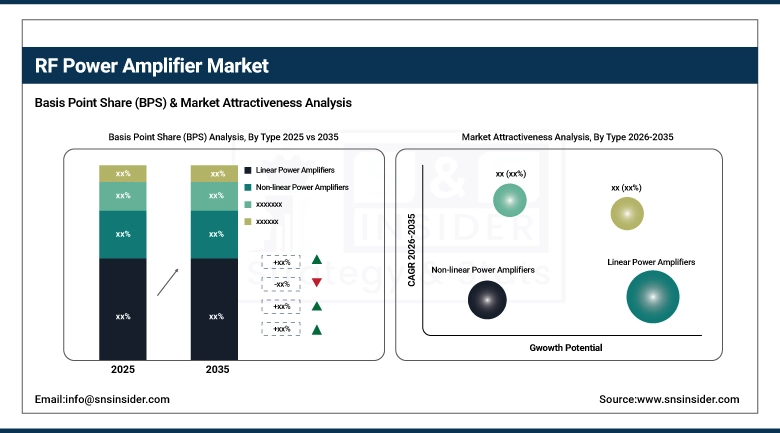
By Type: In 2025, Linear Power Amplifiers dominated with 46% share; Doherty Power Amplifiers fastest growing segment during 2026–2035
-
By Technology: In 2025, LDMOS dominated with 48% share; Gallium Nitride (GaN) fastest growing segment during 2026–2035
-
By Application: In 2025, Telecommunication dominated with 51% share; Automotive fastest growing segment during 2026–2035
-
By End User: In 2025, Telecom Infrastructure dominated with 49% share; Consumer Electronics fastest growing segment during 2026–2035
By Type, Linear Power Amplifiers Dominate While Doherty Amplifiers Grow Rapidly:
For many years linear power amplifiers were the norm in the market as they are able to deliver the highest level of signal fidelity while also generating the lowest distortion essential to any communication system. They are a leading standard just because of their wide usage as the broadcast, telecom and test equipment.
The fastest-growing segment of the global Power Amplifier market is the Doherty type which Is the mostly used type of power amplifier and tracks 5G and 4G modern networks due to its high efficiency in a variable load environment. They are fast gaining acceptance as they can cut down the energy use while at the same time handling the performance.
By Technology, LDMOS Dominate While GaN Grow Rapidly:
Amongst the RF power amplifier market, LDMOS continues to capture the majority of the market share due to its cost-effectiveness, efficiency and its widespread adoption in telecom base stations. Given its maturity and reliability, it tends to be used at large scale in wireless infrastructure.
The segment that has been growing the fastest is Gallium Nitride (GaN) because it has a higher power density, efficiency, and a higher frequency operating capabilities than other alternatives. Niche high performance applications adopting GaN technology in 5G, aerospace, and defense segments more recently as well.
By Application Telecommunication Dominate While Automotive Grow Rapidly:
Market by Application On the bases of application, RF power amplifier market has been segmented into Telecommunication application led the RF power amplifier market as they are widely utilized in base station, mobile networks, and 5G infrastructure. Consolidation of wireless communication networks as well as the growth in data traffic, are creating robust requirements for high-performance RF amplifier solutions.
Automotive is another rapidly growing segment as demand for advanced driver-assistance systems (ADAS), automotive radar, and connected vehicle technologies for all motor vehicle types is increasing. The transition process to electric and autonomous cars only contributes to the growth of demand for RF power amplifiers within this segment.
By End User, Telecom Infrastructure Dominate While Consumer Electronics Grow Rapidly:
The largest share of the market was attributed to telecom infrastructure, with the largest share of RF amplifiers being deployed in base stations and other network equipment. This segment continues to lead due to the expansion of 4G and 5G networks.
Consumer electronic–leading growth segment with rising demand for smartphone, wearable devices, and connected gadgets Trends towards smaller but multifunctional and energy efficient RF components in modern electronic devices is driving the growth of this segment.
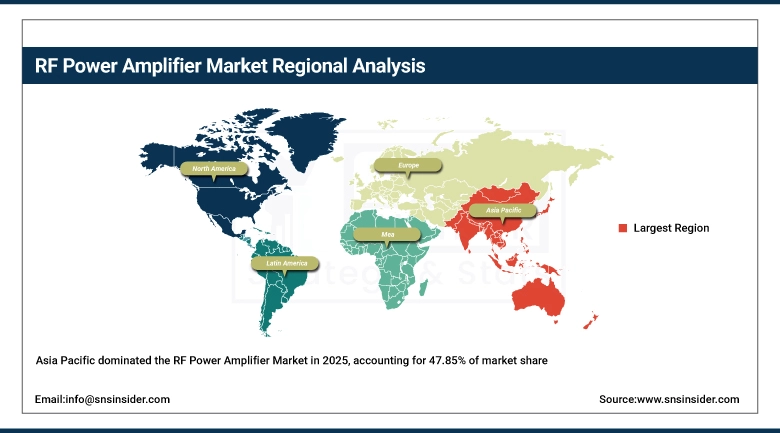
RF Power Amplifier Market Regional Analysis:
Asia-Pacific RF Power Amplifier Market Insights:
The RF power amplifier market shares high share in Asia-pacific region in compare to other region, with share of 47.85%, also fastest growth at CAGR of 13.8% Rapid expansion of telecom infrastructure, increasing ownership of smartphones and large-scale semiconductor manufacturing in countries such as China, Japan, South Korea, and India, contribute significantly. The region is also witnessing affordable production, the rise of 5G deployments, and key electronics manufacturers, which has helped it become the largest and best-placed regional market.
Get Customized Report as per Your Business Requirement - Enquiry Now
North America RF Power Amplifier Market Insights:
North America holds the largest market share, which due to heavy investments in 5G network infrastructure and due to aerospace and defense industries. Market growth is reinforced by the availability of major semiconductor players, advanced research and development (R&D) capabilities, and their early adoption of next-generation communication technologies. Owing to continuous development in wireless technologies along with the need for high-frequency RF, the U.S. dominates the region.
Europe RF Power Amplifier Market Insights:
RF power amplifier market in the Europe region is also estimated to hold a large part owing to the high adoption of RF power amplifier in Automotive electronics, Industrial automation, and Defense applications. And there are those who go as far as Germany, the UK, and France, investing in high-tech communication technologies and automotive radars. Also, the region focuses on energy-efficient and sustainable RF solutions, which is expected to aid steady growth in the market.
Latin America RF Power Amplifier Market Insights:
Latin America is an emerging market with a developing telecom infrastructure, increasing smartphone penetration, and growing investments in digital density. The market growth in countries like Brazil and Mexico is also boosted with the expansion of 4G/5G networks and the rising demand for consumer electronics.
Middle East & Africa (MEA) RF Power Amplifier Market Insights:
Middle East & Africa Market is emerging and growing gradually on account of rising investments in Telecom Infrastructure, Smart City Projects, and Defence Modernization. UAE, Saudi Arabia and South Africa is driving growth propelled by increasing digitalisation, expanding wireless networks and government initiatives to advance technology.
RF Power Amplifier Market Competitive Landscape:
Qualcomm Inc. is an American company known for wireless communication technologies and semiconductor solutions including RF front-end components and power amplifiers. Barefoot solution provides the benefit of its rich portfolio of RF solutions embedded into mobile chipsets, therefore providing them with the next level of performance to work in the domain of smartphones, IOT devices, and 5G infrastructure. Qualcomm specializes in soon-to-be-prevented envelope tracking and integrated RF to be used in future computing devices in order to improve power efficiency and signal performance. Qualcomm, known for its global influence and development in both 5G and wireless ecosystems, has been a major contributor in RF technology developments in the consumer electronics and telecom offerings.
-
In February 2025, Qualcomm introduced next-generation RF front-end solutions designed to enhance 5G Advanced performance and improve power efficiency in flagship smartphones.
Toshiba Corporation is a multinational company based in Japan that deals in electronic components such as RF power amplifiers and semiconductor devices. The company provides high-frequency and high-power RF solutions for radio frequency (RF) applications essentially used in industrial, broadcast, and communication applications. LDMOS and GaN based RF technologies, Toshiba delivers optimal efficiency, reliability, and performance to your RF design. Building on this network, it leverages its legacy of RF technology and innovation to remain a leader in the global RF power amplifier market in both telecom and industrial segments, underpinned by strong competence in power devices and semiconductor innovation.
-
In October 2024, Toshiba expanded its RF power amplifier portfolio with new high-efficiency GaN devices aimed at telecom base stations and industrial applications.
RF Power Amplifier Companies are:
-
Qualcomm Inc.
-
Toshiba Corporation
-
Broadcom Pte. Ltd
-
Mitsubishi Corporation
-
Skyworks Solutions Inc.
-
Murata Manufacturing Co. Ltd
-
Analog Devices Inc.
-
NXP Semiconductors N.V.
-
Analogic Corporation
-
OPHIR RF
-
CML Microsystems Plc
-
Qorvo Inc.
-
MACOM Technology Solutions
-
STMicroelectronics
-
Texas Instruments
-
Cree, Inc. (Wolfspeed)
-
Nokia Corporation
-
Rohde & Schwarz
| Report Attributes | Details |
|---|---|
| Market Size in 2025 | USD 10.82 Billion |
| Market Size by 2035 | USD 36.42 Billion |
| CAGR | CAGR of 12.90% From 2026 to 2035 |
| Base Year | 2025 |
| Forecast Period | 2026-2035 |
| Historical Data | 2022-2024 |
| Report Scope & Coverage | Market Size, Segments Analysis, Competitive Landscape, Regional Analysis, DROC & SWOT Analysis, Forecast Outlook |
| Key Segments | • By Type: (Linear Power Amplifiers, Non-linear Power Amplifiers, Doherty Power Amplifiers) • By Technology: (Gallium Nitride (GaN), LDMOS, Gallium Arsenide (GaAs)) • By Application: (Telecommunication, Aerospace & Defense, Automotive) • By End User: (Consumer Electronics, Telecom Infrastructure, Industrial) |
| Regional Analysis/Coverage | North America (US, Canada), Europe (Germany, UK, France, Italy, Spain, Russia, Poland, Rest of Europe), Asia Pacific (China, India, Japan, South Korea, Australia, ASEAN Countries, Rest of Asia Pacific), Middle East & Africa (UAE, Saudi Arabia, Qatar, South Africa, Rest of Middle East & Africa), Latin America (Brazil, Argentina, Mexico, Colombia, Rest of Latin America). |
| Company Profiles | Qualcomm Inc, Toshiba Corporation, Infineon Technologies, Broadcom Pte. Ltd, Mitsubishi Corporation, Skyworks Solutions Inc., Murata Manufacturing Co. Ltd, Analog Devices Inc, NXP Semiconductors NV, ETL Systems Ltd, Analogic Corporation, OPHIR RF, CML Microsystems Plc, Qorvo Inc, MACOM Technology Solutions, STMicroelectronics, Texas Instruments, Cree, Inc. (Wolfspeed), Nokia Corporation, Rohde & Schwarz. |
Frequently Asked Questions
The RF Power Amplifier Market is expected to grow at a CAGR of 12.9% during 2026–2035.
The RF Power Amplifier Market size was valued at USD 10.82 Billion in 2025 and is projected to reach USD 36.42 Billion by 2035.
The key drivers of the RF Power Amplifier Market include rapid 5G deployment, increasing demand for high-speed wireless communication, growing adoption of IoT devices, advancements in GaN and LDMOS technologies, and rising applications in aerospace, defense, and automotive radar systems.
The Telecommunication segment dominated the RF Power Amplifier Market during the projected period.
Asia-Pacific dominated the RF Power Amplifier Market in 2025.
Get in Touch
