Robotaxi Market Report Scope & Overview
Get More Information on Robotaxi Market - Request Sample Report
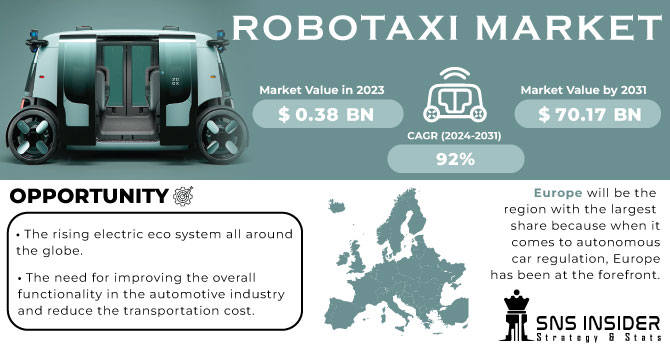
The Robotaxi Market Size was valued at USD 0.38 billion in 2023 and is expected to reach USD 134.74 billion by 2032 and grow at a CAGR of 92% over the forecast period 2024-2032.
Robotaxis are autonomous vehicles designed to navigate the roads without a human behind the wheel. They rely on a complex combination of technology to make it happen. Sensors like cameras, lidar and radar work together to gather information about the environment.
This data is then fed into powerful computer systems that utilize machine learning algorithms to interpret the information and make real-time decisions about how to navigate safely. Just like hailing a regular taxi, you can use a smartphone app to summon a robotaxi which will arrive to pick you up at your designated location. Safety is paramount for robotaxi developers. To minimize the risk of accidents, these vehicles are equipped with top-of-the-line safety features and built-in redundancies in critical systems. The goal is to make robotaxis even safer than cars driven by humans. Another potential benefit is their efficiency. Without a driver needing breaks, robotaxis could operate 24/7, leading to lower operational costs compared to traditional taxis. Thus, if powered by electricity, widespread adoption of robotaxis could contribute to reducing emissions through optimized routing and potentially less traffic congestion.
Several critical factors are driving the robotaxi market, boosting demand, and shaping development: reduction in urban congestion and pollution. Robotaxis are an electric, autonomously operated vehicle, therefore holding promise in terms of solutions towards the developing road congestion problem within cities and contributions toward sustainability goals as emissions are reduced. Of the urban mobility initiatives in major cities around the world, about 45% now use autonomous, shared electric vehicles to make the environment cleaner. A second demand driver is the rapid advancements that are being witnessed in the autonomous driving technology, particularly Level 4 and Level 5 automation. This allows the vehicle to operate in most conditions without any human control. For these technologies, not only is a robotaxi becoming more economically viable, but it can also provide safe and dependable public transport while saving the labor costs from human drivers. In fact, along with changes in consumer preference, the trend towards shared mobility solutions is also gaining momentum. The younger generations prefer comfort over the car-owning value; so far, nearly 40% of the people residing in an urban area favor shared, on-demand transportation services like a robotaxi.
A prime opportunity comes in the form of expanding on smart city initiatives, for the representation of robotaxi as a foundational aspect in improving urban mobility and congestion. As the more cities spend in terms of infrastructure for autonomous transportation, robotaxi will easily be integrated into the infrastructures of existing transit networks to ensure efficient and environmentally friendly solutions. With the majority of smart city initiatives launched around the globe having at least a partial aspect dedicated to enhancing public transportation with autonomous technologies, this presents much space for market growth. And then, of course, there is the all-encompassing trend toward Mobility-as-a-Service, shared, flexible alternatives in transportation; robotaxis perfectly square with that proposal, providing door-to-door travel without the hassle of the need to own and maintain vehicles. Trends in consumer attitudes away from ownership to usage, especially by younger generations and the urban population, mean that robotaxi services have a mammoth potential. In addition, penetration with other tech companies and old school automakers into scaling operations and producing more sophisticated AI systems will give robotaxi service providers the ability to enhance the capabilities of their fleets, establish safety and expand into new territories.
Robotaxi Market Dynamics:
KEY DRIVERS:
-
The rising technological advancement across industries.
-
The benefits associated with the robotaxis.
Algorithms based on AI and machine learning are essential to autonomous driving systems. Robotaxis' ability to understand and react to complicated traffic events has improved thanks to developments in AI, such as deep learning and neural networks. These algorithms are employed for decision-making, path planning, and object detection. Robotaxis rely on high-definition maps that provide precise details about the road, lane lines, traffic signs, and other infrastructure. These maps provide the car a more accurate grasp of its surroundings when paired with real-time sensor data.
RESTRAINTS:
-
The safety issues and the trust factor among the citizens.
OPPORTUNITIES:
-
The rising electric eco system all around the globe.
-
The need for improving the overall functionality in the automotive industry and reduce the transportation cost.
Robotaxis have the potential to reduce consumer transportation costs by removing the need for human drivers and streamlining routes. This may lower the cost of transportation and increase its availability to more people. Robotaxi services can be a convenient and flexible addition to current public transit alternatives, providing "last-mile" connection. Overall mobility in urban areas may be improved by this. The creation and use of robotaxis opens possibilities for the economy in sectors including manufacturing, software development, vehicle maintenance, and data analytics. Additionally, it may result in careers in vehicle operation and customer service.
CHALLENGES:
-
The infrastructural issues in emerging and undeveloped nations.
IMPACT OF RUSSIA-UKRAINE WAR
The war in Russia-Ukraine has disrupted the development and deployment of robotaxis. The global auto industry, a crucial supplier for robotaxi components like sensors and semiconductors, has been significantly impacted. Disruptions in supply chains due to sanctions and factory shutdowns in Russia have led to a shortage of these critical parts, hindering robotaxi production and delaying timelines. The war has exacerbated the already existing chip shortage, further minimizing resources needed for the complex computer systems that power robotaxis. This translates to higher costs for robotaxi companies and potentially slower innovation. The economic uncertainty caused by the war also declines the investor’s confidence, making it harder for robotaxi startups to secure funding.
IMPACT OF ECONOMIC SLOWDOWN
An economic slowdown can impact the future growth of the Robotaxi Market. The economic downturns typically lead to limited consumer spending. Robotaxi rides, while convenient, are often seen as a premium service compared to traditional taxis or public transportation. With reduced discretionary income, potential customers might be less inclined to try out or regularly use robotaxis. This translates to a potential decline in ridership, impacting revenue streams for companies developing and operating these autonomous vehicles. The economic slowdowns can restrain the investments. Companies may find it harder to secure funding during an economic slump, hindering the pace of innovation and delaying the widespread adoption of robotaxis. Robotaxis are packed with expensive sensors, computing power, and other advanced technology. An economic downturn could lead to a rise in the cost of these components, further pressuring companies and potentially delaying the cost reductions needed to make robotaxis a more mainstream transportation option.
Robotaxi Market Segmentation Overview:
By Application Type:
-
Goods Transportation
-
Passenger Transportation
Passenger Transportation is the dominating sub-segment in the Robotaxi Market by application type holding around 85-90% of market share. The primary focus of robotaxi development is on revolutionizing personal transportation. Passenger services offer a clear path to monetization through ride-hailing models similar to existing services like Uber and Lyft. This focus translates to greater investment and faster development in passenger robotaxis compared to goods transportation.
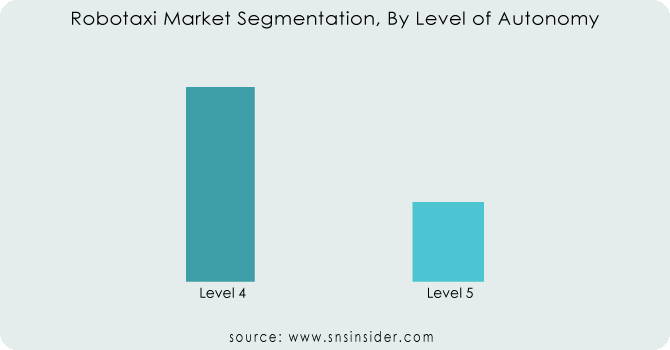
By Level of Autonomy:
-
Level 4
-
Level 5
Level 4 is the dominating sub-segment in the Robotaxi Market by level of autonomy holding around 70-80% of market share. Level 4 autonomy allows for self-driving operation in controlled environments with pre-defined geographies. This offers a practical starting point for robotaxi deployment as it mitigates risk and allows for gradual testing and improvement in real-world scenarios.
Get Customized Report as per Your Business Requirement - Request For Customized Report
By Vehicle Type:
-
Cars
-
Shuttles/Vans
Cars is the dominating sub-segment in the Robotaxi Market by vehicle type. Cars offer a familiar form factor and cater to individual transportation needs, making them a natural fit for initial robotaxi deployments. Shuttles and vans, while potentially offering higher passenger capacity, are still in earlier development stages and require further adaptation for widespread adoption.
By Propulsion:
-
Electric
-
Fuel Cell
-
Car Rental
-
Station Based
Electric is the dominating sub-segment in the Robotaxi Market by propulsion holding around 80-85% of market share. Electric vehicles align well with the environmentally friendly vision of robotaxis. Additionally, government incentives for electric vehicles and growing concerns about emissions make electric robotaxis an attractive proposition.
By Component Type:
-
Camera
-
Radar
-
LiDAR
-
Ultrasonic Sensors
Cameras is the dominating sub-segment in the Robotaxi Market by component type. Cameras provide a wealth of visual data about the environment, essential for tasks like object recognition and lane detection. They are also relatively mature and cost-effective compared to some other sensor types.
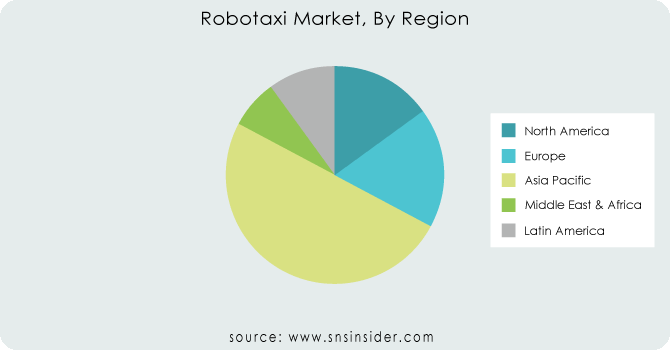
Robotaxi Market Regional Analysis
The Asia Pacific is the dominating region in the Robotaxi Market Holding 55-60% of market share. This dominance can be attributed by strong government support in countries like China, fueling research and development; a massive, tech-savvy population creating a ready market; and existing smart city infrastructure that eases integration.
North America is the second highest region in this market leveraging its position as a technological hub with companies like Google and Uber driving innovation. The well-established ride-hailing market provides a natural platform for integrating robotaxis.
The Europe is the fastest growing regio due to stringent safety regulations, Europe's emphasis on safety fosters robust safety features in their robotaxis. The public-private partnerships accelerate growth in this region.
KEY PLAYERS
The major key players are Tesla, Waymo, Aptiv, Uber Technologies, Cruise, Lyft, Baidu, Zoox, AutoX and other key players.
RECENT DEVELOPMENTS
-
In May 2023: Didi Chuxing, a Chinese ride-hailing company, has partnered with car manufacturer GAC AION to mass-produce self-driving electric robotaxis. These vehicles are expected to join Didi's ride-sharing network by 2025, offering a seamless experience for passengers.
-
In May 2023: Waymo LLC and Uber Technologies Inc. have formed a partnership to integrate Waymo's self-driving technology into Uber's ride-hailing platform. This collaboration signifies a potential advancement in the accessibility of autonomous vehicles for consumers.
-
In Jan. 2023: In a new development for driverless vehicles, EasyMile and Keolis are piloting two fully autonomous shuttles with remote supervision at France's National Sports Shooting Centre. This project aims to validate the economic and operational feasibility of driverless shuttles.
| Report Attributes | Details |
| Market Size in 2023 | USD 0.38 Billion |
| Market Size by 2032 | USD 134.74 Billion |
| CAGR | CAGR of 92% From 2024 to 2032 |
| Base Year | 2023 |
| Forecast Period | 2024-2032 |
| Historical Data | 2020-2022 |
| Report Scope & Coverage | Market Size, Segments Analysis, Competitive Landscape, Regional Analysis, DROC & SWOT Analysis, Forecast Outlook |
| Key Segments | • By Application Type: (Goods Transportation, Passenger Transportation) • By Level of Autonomy: (Level 4, Level 5) • By Vehicle Type: (Cars, Shuttles/Vans) • By Propulsion: (Electric, Fuel Cell, Car Rental, Station Based) • By Component Type: (Camera, Radar, LiDAR, Ultrasonic Sensors) |
| Regional Analysis/Coverage | North America (US, Canada, Mexico), Europe (Eastern Europe [Poland, Romania, Hungary, Turkey, Rest of Eastern Europe] Western Europe] Germany, France, UK, Italy, Spain, Netherlands, Switzerland, Austria, Rest of Western Europe]), Asia Pacific (China, India, Japan, South Korea, Vietnam, Singapore, Australia, Rest of Asia Pacific), Middle East & Africa (Middle East [UAE, Egypt, Saudi Arabia, Qatar, Rest of Middle East], Africa [Nigeria, South Africa, Rest of Africa], Latin America (Brazil, Argentina, Colombia, Rest of Latin America) |
| Company Profiles | Tesla, Waymo, Aptiv, Uber Technologies, Cruise, Lyft, Baidu, Zoox, AutoX |
| Key Drivers | The rising technological advancement across industries. |
| RESTRAINTS | The safety issues and the trust factor among the citizens. |
Frequently Asked Questions
Ans: The safety issues and the trust factor among the citizens.
Ans: The market is studied in three segments i.e., By propulsion type, by application and by Component type.
Ans : Europe will be the region which will have the highest share.
Ans: The CAGR growth rate recorded was 92%
Ans: The Robotaxi Market size was valued at USD 0.38 billion in 2023 and is expected to reach USD 134.74 billion by 2032 and grow at a CAGR of 92% over the forecast period 2024-2032..
Get in Touch
