Safety Light Curtains Market Report Scope and Overview:
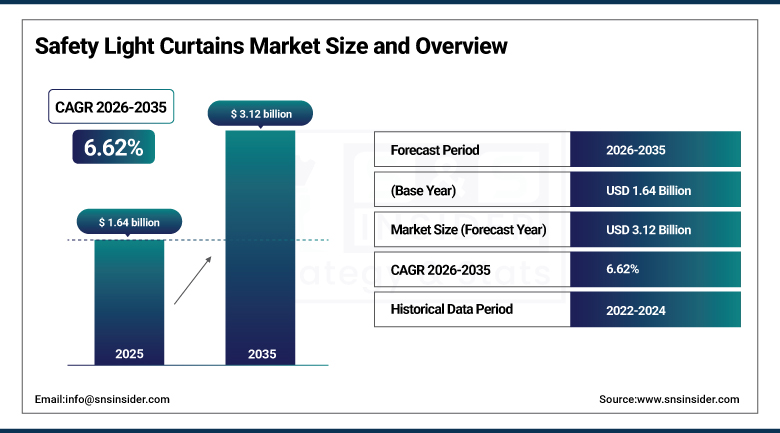
The Safety Light Curtains Market size was valued at USD 1.64 Billion in 2025 and is expected to reach USD 3.12 Billion by 2035, growing at a CAGR of 6.62% over the forecast period of 2026-2035.
The global Safety Light Curtain market is anticipated to witness healthy growth during the forecast period owing to rising industrial automation accompanied by tightening workplace safety regulations. The significant factors, such as advancing technologies in smart manufacturing and increasing demand for machine guarding solutions with reliable operational efficiency, help the global machine guarding system market grow widely over numerous sectors. The light curtain is being integrated in automotive, electronics, food processing, healthcare, etc. industries to boost safety, minimize down time, and maintain compliance such as safety standards. The continuous upsurge in investments in automated production lines along with the expansion of manufacturing infrastructure around the globe is also bolstering the sales of these non-contact safety devices.
Over 70% of global manufacturing companies have adopted some form of machine safety protocol as part of their compliance strategy.
Facilities using Safety Light Curtains Market report a 60% reduction in machinery-related injuries over a three-year implementation period.
Safety Light Curtains Market Size and Growth Projection:
-
Market Size in 2025: USD 1.64 Billion
-
Market Size by 2035: USD 3.12 Billion
-
CAGR (2026–2035): 6.62%
-
Base Year: 2025
-
Forecast Period: 2026–2035
-
Historical Data: 2022–2024
To Get More Information On Safety Light Curtains Market - Request Free Sample Report
Safety Light Curtains Market Trends Highlights:
-
New muting module enhances safety and productivity with SICK DMM4 light curtain, allowing smooth material flow without stopping machines and reducing false stops and workflow interruptions
-
Improved human‑material differentiation enables uninterrupted production flow while maintaining operator safety
-
Field‑ready and easy to install, the muting module is slimmer, rugged, and plug‑and‑play, reducing wiring and commissioning time
-
Compliance and high safety levels with PLe/SIL3 functions and ISO standards support safe guarding in complex industrial environments
-
Software-driven configuration using SICK Safety Designer allows flexible setup of muting parameters, diagnostics, smart restart interlocks, and mode switching
-
Safety light curtain product evolution with SICK C4000 family offers integrated diagnostics, human‑material differentiation, configurable resolution, and enhanced productivity features for industrial safety guarding
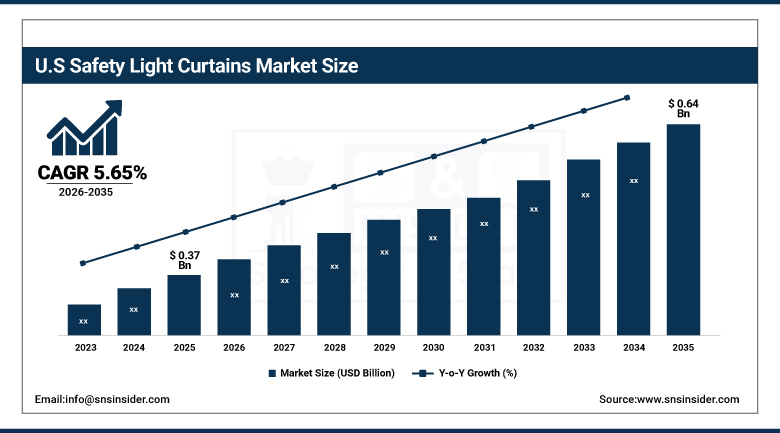
U.S. Safety Light Curtains Market Size Outlook
The U.S. Safety Light Curtains Market size was USD 0.37 billion in 2025 and is expected to reach USD 0.64 billion by 2035, growing at a CAGR of 5.65% over the forecast period of 2026–2035.In the U.S. market, continuous growth is observed, mainly due to increasing workplace safety regulations introduced by OSHA and other regulatory authorities. Furthermore, robust industrial automation, increased utilization of robots, and advanced manufacturing facilities further drive the product demand. The continued incorporation of safety sensors in automotive and electronic production lines will also bolster steady growth in the U.S. industrial sector. The penetration of large players, as well as the initiative of various industries in complying with safety regulations is driving the growth of safety light curtains in the country.
The U.S. had over 310,000 operational industrial robots by 2024, ranking it among the top five globally.
Nearly 64% of U.S. manufacturing plants reported using automated systems and safety sensors in 2023.
Safety Light Curtains Market Drivers:
-
Increase in industrial automation in various industries is resulting in significant adoption of machine safety solutions such as Safety Light Curtains Market.
Increasing adoption of Industry 4.0 is leading to rapid advancements in factory automation, thereby driving demand for reliable safety solutions in the industry. Safety Light Curtains Market are another safety product that finds implementation in most manufacturing environments that require presence detection for human safety, such as automated and robotic workstations. This makes them invaluable in industries such as automotive, electronics, and packaging, where they help decrease downtime and increase the safety of workers without creating physical barriers. With industries striving to achieve higher throughput and effective machine guarding, the non-contact safety technologies including light curtains are increasing in demand.
-
Studies show that Safety Light Curtains Market can reduce injury rates by up to 70% in automated assembly environments.
-
As of 2024, over 55% of global manufacturers have adopted Industry 4.0 technologies, including smart safety systems.
Safety Light Curtains Market Restraints:
-
Developing regions still have a lack of knowledge and technical expertise which reduces the potential for adoption and implementation efficiency.
This is even more so in developing regions where industries might have inadequate information regarding the capabilities and benefits of advanced safety technologies such as light curtains. Where interest exists, a lack of qualified personnel able to install, calibrate and maintain these systems may result in improper deployment or the systems languishing underutilised. This chasm in technical knowledge, along with infrequent enforcement of safety standards, impedes the pace of adoption. Moreover, the misunderstandings regarding the reliability and performance of photoelectric safety devices also limit the market penetration in these geographies.
Safety Light Curtains Market Opportunities:
-
The integration of IoT and Industry 4.0 technologies is creating new frontiers for smart safety system solutions such as light curtains.
As smart manufacturing continues to become a reality, Safety Light Curtains Market are now being integrated alongside real-time data analytics, predictive maintenance and cloud platform. Its integration leads to predictive fault detection, remote diagnostics and a high level of safety analytics, enabling optimization and reduced downtime for manufacturers. Smart light curtains with the capability of communication through the industrial protocols (e.g., Ethernet/IP, PROFINET) are entering and creating huge opportunity in advanced manufacturing environments that are looking for integrated safety and performance monitoring.
-
Over 60% of manufacturers in developed economies have adopted some form of smart manufacturing technologies as of 2024.
-
By 2025, more than 70% of new industrial safety devices are expected to support IIoT connectivity and real-time data sharing.
Safety Light Curtains Market Segment Analysis:
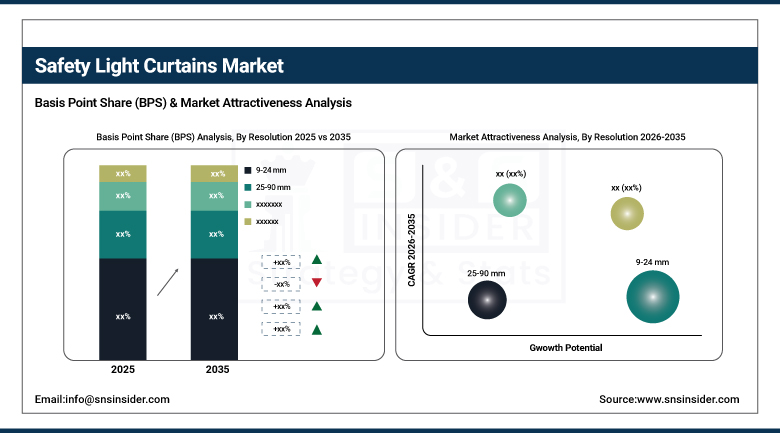
By Resolution
9–24 mm segment in 2025 accounted for the highest revenue share around 45.06% and is expected to grow at a CAGR of around 5.3% during the forecast period. It is a result in its highest sensitivity detection for fingers and hands protection in small industrial machines. Mass semi-conductor manufacture and electronics assembly lines are good examples of where these curtains are most commonly used because of the high degree of accuracy required. They are a preferred solution in a variety of sectors due to their compliance to international safety standards and their ability to operate in space-constricted aisles.
25–90 mm segment of the optical lenses is expected to grow with the fastest CAGR of approximately 7.98% during the forecast time period of 2026 to 2035 Reaching at this growth through the needs for heavy-duty and body protection, particularly across automotive and packaging industries. For instance, companies such as Keyence Corporation are augmenting their mid-resolution safety curtain offerings with powerful and scalable mid-range solutions that address the cost consideration alongside the long-range detection capability thereby triggering their uptake in low- to medium-risk environments.
By Component
Light Emitting Diodes (LEDs) garnered the highest revenue share due to their (LEDs) efficiency, life, and sense of heat generation at 34.55% in 2025. This is critical for high-performance safety systems like these, which need to maintain operational integrity in demanding industrial environments. LEDs play an integral role in emitting light beams for presence detection, especially for repetitive, high speed processes. Their low maintenance and continually reliable performance serves as the benchmark for safety light curtain systems.
Photoelectric Cell is expected to experience the highest CAGR growth rate, 7.98% during the period of 2026 to 2035. Their rise is propelled by development in smart sensor and integration into automatic safety measures. As a leader in the field of industrial Safety technologies, Rockwell Automation is developing intelligent photoelectric cell-based curtains with greater diagnostics, fail safes and a network oriented configurability, making it perfect for the modern connected factories.
By End User
The Automotive segment market revenue in 2025 captured the largest revenue share by 24.54%. The machines responsible for maneuvering, assembly, and welding require precise and dependable safety systems to minimize downtime and protect human safety. These safety light curtains prevent accidents, and they also reduce machine downtime. Omron Corporation has customized light curtain systems as per the safety needs of automotive manufacturing environments.
The Semiconductors & Electronics segment is expected to witness a significant growth rate of nearly 9.16% from, 2026 to 2035. This is propelled by the rising investments in cleanroom automation and microelectronics with demand for compact high-resolution safety curtains. These systems are vital for safeguarding workers who perform workflows that are in close proximity to each other as they rely on precision and sensitivity. Panasonic Industry expedited penetration of safety curtain solutions into high speed electronics production line without sacrificing safety for productivity.
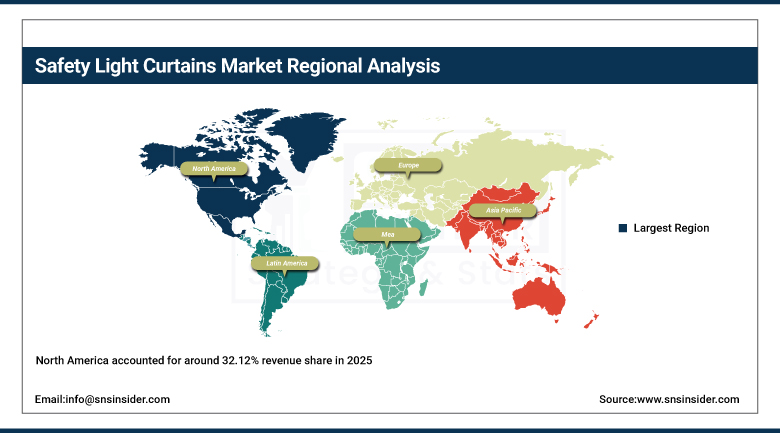
Safety Light Curtains Market Regional Analysis:
North America Safety Light Curtains Market Trends:
North America accounted for around 32.12% revenue share in 2025, with the U.S. holding the largest market share. The region is characterized by developed industrial automation infrastructure, stringent regulatory mandates, and high technology penetration. It is also well positioned as it boasts of one of the key players and manufacturing facilities.
The U.S. dominates the North American Safety Light Curtains Market market due to strong industrial automation adoption, presence of major manufacturing hubs, strict workplace safety regulations, and significant investments by key players like Rockwell Automation and Banner Engineering in advanced safety solutions.
Get Customized Report as Per Your Business Requirement - Enquiry Now
Asia-Pacific Safety Light Curtains Market Trends:
Asia Pacific region will maintain its position as the fastest growing CAGR, approximately 8.61% between 2026 and 2035. Such factors include increased industrialization, supportive government policies from various countries to encourage smart manufacturing and growth of automotive and electronics industries. The high lead with which countries such as China, Japan, and India has been investing in plant safety systems, increasing the speed of development.
China dominates the Asia Pacific Safety Light Curtains Market market due to rapid industrialization, large-scale manufacturing, government initiatives supporting factory automation, and growing demand for worker safety. Major local and global players are expanding operations, strengthening China’s leadership in industrial safety technologies.
Europe Safety Light Curtains Market Trends:
Europe is considered to be one of the sales regions for Safety Light Curtains Market in the market, due to stringent regulations regarding workplace safety, high adoption of Industry 4.0, and large automotive & electronics manufacturing. Germany, France, and Italy are prominent in the adoption of advanced safety systems, while major companies keep continuing investment in automation technologies to improve production quality and protect workers from various hazards.
Germany leads the European Safety Light Curtains Market market due to its advanced manufacturing sector, strong focus on automation, and strict safety regulations. The presence of key players like Sick AG and Pilz GmbH further strengthens its dominance in industrial safety solutions.
Latin America and Middle East & Africa Safety Light Curtains Market Trends:
Middle East & Africa is chiefly held by the UAE, largely attributed to the increasing industrial automation and substantial government support regarding manufacturing in this country. Brazil is the market leader in Latin America, fueled by the strength of its automotive sector, growing industrial base and increasing focus on industrial safety and automation standards.
Safety Light Curtains Market Competitive Landscape:
Omron Corporation, established in 1933 and headquartered in Kyoto, Japan, is a leading automation and safety solutions company. Specializing in industrial automation, sensors, and safety light curtains, Omron delivers innovative, reliable technologies that enhance workplace safety and operational efficiency across global manufacturing sectors.
-
In June 2024, Omron updated their F3SG‑SR/PG Safety Light Curtain Series, enhancing IoT-ready features with easier maintenance, intelligent status monitoring, and faster backup/restore settings—ideal for flexible, global production environments
Keyence Corporation, established in 1974 and headquartered in Osaka, Japan, is a global leader in automation sensors, vision systems, barcode readers, and safety light curtains. Known for cutting-edge technology and rapid innovation, Keyence provides high-precision solutions that improve productivity, quality control, and safety in manufacturing and industrial operations worldwide.
-
In May 2025, Keyence updated the SL‑V Series Safety Light Curtain, introducing a slim, edge‑to‑edge model with integrated state‑indicator LEDs and optional built‑in safety controller for simplified wiring and enhanced reliability.
Key Safety Light Curtains Companies are:
-
Sick AG
-
Keyence Corporation
-
Omron Corporation
-
Banner Engineering Corp.
-
Panasonic Industry Co., Ltd.
-
Pilz GmbH & Co. KG
-
Leuze electronic GmbH + Co. KG
-
Eaton Corporation
-
ABB Ltd.
-
Honeywell International Inc.
-
Siemens AG
-
IDEC Corporation
-
Fortress Interlocks Ltd.
-
Datalogic S.p.A.
-
Pepperl+Fuchs GmbH
-
Turck GmbH & Co. KG
-
Carlo Gavazzi Holding AG
| Report Attributes | Details |
|---|---|
| Market Size in 2025 | USD 1.64 Billion |
| Market Size by 2035 | USD 3.12 Billion |
| CAGR | CAGR of 6.62% From 2026 to 2035 |
| Base Year | 2025 |
| Forecast Period | 2026-2035 |
| Historical Data | 2022-2024 |
| Report Scope & Coverage | Market Size, Segments Analysis, Competitive Landscape, Regional Analysis, DROC & SWOT Analysis, Forecast Outlook |
| Key Segments | • By Resolution (9-24 mm, 25-90 mm, More than 90 mm), • By Component (Light Emitting Diodes, Photoelectric Cells, Control Units, Displays, Enclosures), • By End User (Food & beverages, Automotive, Semiconductors & Electronics, Healthcare, Others). |
| Regional Analysis/Coverage | North America (US, Canada), Europe (Germany, UK, France, Italy, Spain, Russia, Poland, Rest of Europe), Asia Pacific (China, India, Japan, South Korea, Australia, ASEAN Countries, Rest of Asia Pacific), Middle East & Africa (UAE, Saudi Arabia, Qatar, South Africa, Rest of Middle East & Africa), Latin America (Brazil, Argentina, Mexico, Colombia, Rest of Latin America). |
| Company Profiles | Sick AG, Keyence Corporation, Rockwell Automation, Inc., Omron Corporation, Banner Engineering Corp., Panasonic Industry Co., Ltd., Pilz GmbH & Co. KG, Leuze electronic GmbH + Co. KG, Schneider Electric SE, Eaton Corporation, ABB Ltd., Honeywell International Inc., Siemens AG, IDEC Corporation, Fortress Interlocks Ltd., Datalogic S.p.A., Pepperl+Fuchs GmbH, Turck GmbH & Co. KG, Carlo Gavazzi Holding AG, Turck Banner Engineering. |
Frequently Asked Questions
Ans: North America dominated the Safety Light Curtains Market in 2025.
Ans: Light Emitting Diodes segment dominated the Safety Light Curtains Market.
Ans: Rising industrial automation, strict safety regulations, and demand for non-contact machine guarding systems are driving Safety Light Curtains Market growth.
Ans: The Safety Light Curtains Market size was valued at USD 1.64 Billion in 2025 and is expected to reach USD 3.12 Billion by 2035
Ans: The Safety Light Curtains Market is expected to grow at a CAGR of 6.62 % from 2026-2035.
Get in Touch
