image

Smart Manufacturing Market Report Scope & Overview:

Smart Manufacturing Market Revenue Analysis

To get more information on Smart Manufacturing Market - Request Free Sample Report

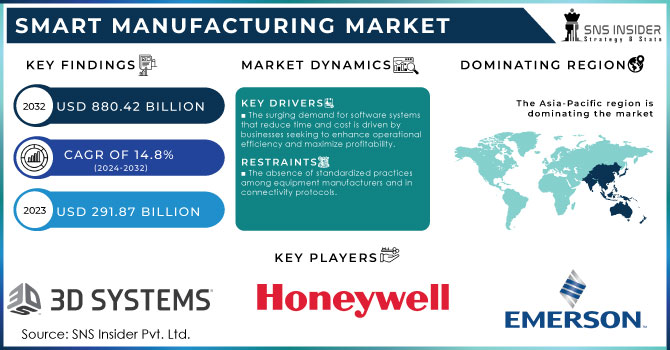
The Smart Manufacturing Market Size was esteemed at USD 291.87 billion in 2023 and is supposed to arrive at USD 880.42 billion by 2032 and develop at a CAGR of 14.8% over the forecast period 2024-2032.

Smart manufacturing enhances efficiency and productivity through automation, real-time data analytics, and integrated solutions. Predictive maintenance keeps IoT-connected machines and equipment running seamlessly, and automated workflows ensure that everything is running at maximum capacity. Advanced smart solutions and data analytics provide agility and responsiveness manage market changes better and allow for personalized production. Smart and integrated solutions ensure that processes and operations are streamlined, and energy is used sparingly, which directly benefits sustainability and the green credentials of the factory. Finally, quality control is maintained through linking supply chain and manufacturing operations ensuring that industry standards are always met.

The budget proposes committing to sustainable development with the funding of the promotion and spreading of electric vehicles and their charging infrastructure across the nation. The initiative will benefit the country by reducing carbon emissions and creating a market for green mobility.

The two most common industries of industry 4.0 are information technology and automobile industry. Consequently, in the market, the automotive industry has assisted the manufacturers to easily create an automated assembly line. An automated assembly line helps the manufacturer not only to automate vehicle parts but also to automate in making the whole car.

In Siemens and Boeing (2023): Partnered to develop and implement a revolutionary automated NDT system for inspecting airplane wings. This system utilizes robotics and advanced sensors to perform ultrasonic testing on wing structures, ensuring structural integrity and reducing inspection time by up to 50%. This collaboration exemplifies how leading manufacturers are embracing cutting-edge NDT technologies to streamline production processes and enhance aircraft safety.

According to one of the survey, “the use of 3D printing has seen a 10%-point increase from 2022-2023; however, only 28% of companies view it as a potential solution to their business challenges. While more respondents are adopting 3D printing, a significant portion 26% remains at the awareness stage. This may be due to the diverse applications of 3D printing, such as its extensive use in prototyping with polymers for testing product ideas.”

Every other industry has created an important market that industrial automation has made due to its various advantages and opportunities. Therefore, it does not matter in which industry the company or manufacturer is every individual wants to apply smart manufacturing to their own. Therefore, the information technology sector is not just a participant in the market, it is also a foundation for the market and is a qualified participant. Therefore, the Industrial market has been dispensed and since internet of things has been recently initialized and standardized. The anonymous entry-level industry, manufacture, and equity of the market have all been standardized by the internet of things. Furthermore, the information technology sector is implementing modern solutions including augmented reality, virtual reality, machine learning, artificial intelligence, and the several modern solutions of the market.

DRIVERS

The surging demand for software systems that reduce time and cost is driven by businesses seeking to enhance operational efficiency and maximize profitability.

The increasing demand for software systems that help to save time and cost is due to the fact that companies are more oriented towards enhancing operational efficiency and optimizing profitability. In such a competitive business environment, an increasing number of organizations are relentlessly striving to optimize their performance without compromising the quality. Software systems that help to automate some aspects of business operation, optimize resource allocation or improve project management are likely to be applied to. In such a way, businesses can count on faster response times and reduced labor costs, coming with the elimination of manual measures and reduced human error.

This demand led to the increased use of computers and, therefore, various applications, including word processors, accounting software, and other organizational programs. The use of different versions of these systems helps these companies manage their operations, optimize their workforce, maximize performance, and reduce costs. Systems focused on accounting, customers, inventories, employee information, and supplies, allow small and medium-sized companies to choose and personalize them, increasing or decreasing their capacity and enlarging the control.

The cloud-based, these systems also offer a high level of security and regular adjustments by the hosting company. The installation of these software systems into the current machinery and workflow also saves money. For example, inventory management systems help organizations in product storage or stock management, reducing stocking parts’ costs, and benefits of storage/waste: stockouts or overstock overall. At the same time, project management systems help teams communicate and work together better, spending less time on appropriate possible approvals.

The growing adoption of advanced technologies like big data, cloud computing, and 5G is driving smart manufacturing by enabling secure data management, faster machine communication, and real-time process monitoring.

The manufacturing sector has been witnessing a revolution in the recent period. Increased and immense adoption of high-level technologies like 5G, big data and cloud computing is behind the transformation. These technologies influence the sector through their provision of a favourable environment for smart manufacturing solutions. The effect of big data, cloud computing and 5G provides a mechanism which ensures that manufacturing processes are efficient, productive and flexible. A big data driving operation allows a manufacturer to handle an enormous amount of data.

Consequently, information obtained is used to affect improvements, predict failures and maintain quality products. This is a result of more informed decisions which are linked up and down the manufacturing process. As a result, the manufacturing process is enhanced, and innovation and creativity are fostered.

Useful and cost-effective storage base on which databases are stored is a great advantage to manufacturers. Provision of cloud software ensures manufacturers can access data from any source and location. It is essential for the manufacturing process, which is in use because it is linked up with a broad range of stakeholders and other involved parties like distributors. The cloud services used are also essential because they are linked and supplement security by safeguarding the whole of manufacturing processes from cyber-attacks. This is essential for manufacturing as the integration of these processes is essential to ensure efficiency.

RESTRAIN

The absence of standardized practices among equipment manufacturers and in connectivity protocols.

The absence of standardized practices among equipment manufacturers and in connectivity protocols is one of the significant challenges in the industry. Since there is no uniform standard companies follow, many products cannot be integrated due to compatibility issues, ultimately leading to slow process and ineffective work. Thus, one of the key barriers to technology adoption is avoiding investment and additional time expenditure on making various products compatible and understanding how they work with other items. Thus, the absence of standardization results in connectivity protocols produced by various companies not working properly as they cannot share data in an efficient manner. This issue is critical for both industrial automation, smart homes, and the Internet of Things. The sector cannot function effectively if appliances do not work together and product data cannot be shared. Similarly, standardization of connectivity can allow better automation of work machines, which can optimize production, minimize incorrect operations, and, ultimately, improve performance.

KEY MARKET SEGMENTATION

By Component

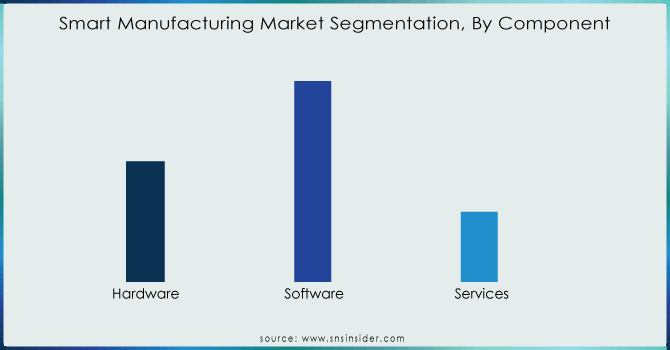
The software accounted for the largest revenue share of approx. 49.9% in 2023 and is expected to dominate the market over the forecast period. This is primarily due to the fact that the industry is moving towards complete automation and the software form the part of the backbone of the industry. The advanced software would enable the robots, drones, and other machinery to run without any intervention required from the human.

The hardware segment is anticipated to grow at the highest CAGR of 14.2% over the forecast period. The market is going to require high-level hardware that goes in harmony with advanced software. In order for the advanced software to be applicable, it requires modern and up to date hardware. The manufacturing plants would use the hardware that is low power consuming and is swift and can run the parts with light sensors.

Smart-Manufacturing-Market-Segmentation-By-Component

Need any customization research on Smart Manufacturing Market - Enquiry Now

By Technology

The Discrete control system segment captured the highest market share of 16.5% in 2023 and is expected to maintain its dominance over the forecast period. The discrete control system technology runs in the background and offers control and monitor facility to the administrator. The market provides the technological command and overview of every process in its basic and advanced level. The market is highly accessible anywhere due to this amalgamation of technology and industrial automation.

The 3D printing segment is expected to grow at a highest CAGR of 17.9% over the forecast period. The smart manufacturers can draw any small or larger part using 3D software and then, print it on the 3D printer. The 3D printing saves time and cost of a smart manufacturing plant as it is extremely easy to draw and print it then and there. The market is a considerable purchaser and investor in the 3D printing equipment and software.

By End-Use

The Automotive industry registered a largest revenue share approx. 24.6% in 2023 over the forecast period. Many automotive manufacturers are running at very minimal profits, so they turn towards smart manufacturing to reduce waste and cost and to increase their margins. The market also helps automotive companies maintain a high level of standardization of their products.

The Aerospace & defense industry segment is predicted to register a significant CAGR of 16.8% over the forecast period. This industry is investing heavily in smart manufacturing as precision in the product is key. For space research, multiple flights are needed for testing which can only be achieved by smart manufacturing rockets at a rapid pace. The defense industry invests significantly in industrial automation to be able to come up with modern defense mechanisms to mitigate any new threats.

REGIONAL ANALYSIS

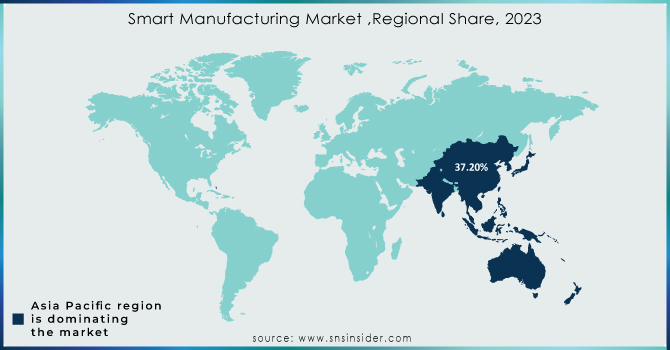
Asia Pacific region amounted to a leading market share of approx. 37.2% in 2023 and is projected to be the fastest-growing region over the forecast period. This can be attributed to vast opportunities across the developing countries such as India, China, and others that are on introduction of full automation.

North America is anticipated to grow at the highest CAGR over the forecast period due to the established dominant position of the region as a center for industrial automation, using of advanced technology and innovative manufacturing methods. Positive business climate, in particular in the US owing to the tax code reforms, substantial support packages for the manufacturing and infrastructure sector, and presence of the significant players in the high-tech space. Development of smart manufacturing in the industries is spurred due to the focus on the efficient exploitation of assets in the enterprises, necessity to follow prohibitive compliance with tougher conditions on workplace safety, and maintaining high standard of products quality.

Smart-Manufacturing-Market-Regional-Share-2023

KEY PLAYERS

The major key players are 3D System, Inc., ABB, Cisco System, Inc., Emerson Electric, General Electric, Honeywell International Inc., IBM, Mitsubishi Electric Corporation, Rockwell Automation, Inc., Schneider Electric, Siemens, Oracle, SAP, Stratasys, Yokogawa Electric Corporation and others.

RECENT DEVELOPMENT

In June 2023: Honeywell unveiled its latest innovation, the Honeywell Digital Prime solution a cloud-based digital twin designed to streamline the monitoring, management, and testing of process control changes and system modifications. This cost-effective tool empowers users to conduct frequent testing, leading to heightened precision in results and a notable reduction in the need for reactive maintenance.

In May 2023: Rockwell Automation Inc. collaborated with autonox Robotics, for the expansion and invention of robot mechanics. This partnership is expected to bring Kinetix motors and drives of Rockwell along with the autonox’s robot mechanics to achieve new manufacturing possibilities.

In April 2023: ABB is expected to invest USD 170 million in the U.S. market to create highly skilled jobs in manufacturing, innovation, and distribution operations. This investment is expected to create more demand for electrification and automation products.

Smart Manufacturing Market Report Scope:

Report Attributes Details
Market Size in 2023 US$ 291.87 Billion
Market Size by 2032 US$ 88.42 Billion
CAGR CAGR of 14.8% From 2024 to 2032
Base Year 2023
Forecast Period 2024-2032
Historical Data 2020-2022
Report Scope & Coverage Market Size, Segments Analysis, Competitive  Landscape, Regional Analysis, DROC & SWOT Analysis, Forecast Outlook
Key Segments • By Component (Hardware, Software, Services)
• By Technology (Machine Execution Systems, Programmable Logic Controller, Enterprise Resource Planning, SCADA, Discrete Control Systems, Human Machine Interface, Machine Vision, 3D Printing, Product Lifecycle Management, Plant Asset Management)
• By End-Use (Automotive, Aerospace & Defence, Chemicals & Materials, Healthcare, Industrial Equipment, Electronics, Food & Agriculture, Oil & Gas, Others)
Regional Analysis/Coverage North America (US, Canada, Mexico), Europe (Eastern Europe [Poland, Romania, Hungary, Turkey, Rest of Eastern Europe] Western Europe] Germany, France, UK, Italy, Spain, Netherlands, Switzerland, Austria, Rest of Western Europe]), Asia Pacific (China, India, Japan, South Korea, Vietnam, Singapore, Australia, Rest of Asia Pacific), Middle East & Africa (Middle East [UAE, Egypt, Saudi Arabia, Qatar, Rest of Middle East], Africa [Nigeria, South Africa, Rest of Africa], Latin America (Brazil, Argentina, Colombia, Rest of Latin America)
Company Profiles 3D System, Inc., ABB, Cisco System, Inc., Emerson Electric Co., General Electric, Honeywell International Inc., IBM, Mitsubishi Electric Corporation, Rockwell Automation, Schneider Electric, Siemens, Oracle, SAP, Stratasys, Yokogawa Electric Corporation 
Key Drivers


• The surging demand for software systems that reduce time and cost is driven by businesses seeking to enhance operational efficiency and maximize profitability.

• The growing adoption of advanced technologies like big data, cloud computing, and 5G is driving smart manufacturing by enabling secure data management, faster machine communication, and real-time process monitoring.

RESTRAINTS • The absence of standardized practices among equipment manufacturers and in connectivity protocols.

Frequently Asked Questions

Ans: The Smart Manufacturing Market is expected to grow at a CAGR of 14.8%.

Ans:  Smart Manufacturing Market size was USD 291.87 billion in 2023 and is expected to Reach USD 880.42 billion by 2032.

Ans: Discrete Control Systems is the dominating segment by technology in the Smart Manufacturing Market.

Ans: The surging demand for software systems that reduce time and cost is driven by businesses seeking to enhance operational efficiency and maximize profitability.

Ans:  Asia-Pacific is the dominating region in the Smart Manufacturing Market.

TABLE OF CONTENTS

1. Introduction

1.1 Market Definition

1.2 Scope

1.3 Research Assumptions

2. Industry Flowchart

3. Research Methodology

4. Market Dynamics

4.1 Drivers

4.2 Restraints

5. Porter’s 5 Forces Model

6. Pest Analysis

7. Smart Manufacturing Market Segmentation, By Component

7.1 Introduction

7.2 Hardware

7.3 Software

7.4 Services

8. Smart Manufacturing Market Segmentation, By Technology

8.1 Introduction

8.2 Machine Execution Systems

8.3 Programmable Logic Controller

8.4 Enterprise Resource Planning

8.5 SCADA

8.6 Discrete Control Systems

8.7 Human Machine Interface

8.8 Machine Vision

8.9 3D Printing

8.10 Product Lifecycle Management

8.11 Plant Asset Management

9. Smart Manufacturing Market Segmentation, By End-Use

9.1 Introduction

9.2 Automotive

9.3 Aerospace & Defence

9.4 Chemicals & Materials

9.5 Healthcare

9.6 Industrial Equipment

9.7 Electronics

9.8 Food & Agriculture

9.9 Oil & Gas

9.10 Others

10. Regional Analysis

10.1 Introduction

10.2 North America

10.2.1 Trend Analysis

10.2.2 North America Smart Manufacturing Market by Country

10.2.3 North America Smart Manufacturing Market, by Component

10.2.4 North America Smart Manufacturing Market, by Technology

10.2.5 North America Smart Manufacturing Market by End-User

10.2.6 USA

10.2.6.1 USA Smart Manufacturing Market, by Component

10.2.6.2 USA Smart Manufacturing Market, by Technology

10.2.6.3 USA Smart Manufacturing Market by End-User

10.2.7 Canada

10.2.7.1 Canada Smart Manufacturing Market, by Component

10.2.7.2 Canada Smart Manufacturing Market, by Technology

10.2.7.3 Canada Smart Manufacturing Market by End-User

10.2.8 Mexico

10.2.8.1 Mexico Smart Manufacturing Market, by Component

10.2.8.2 Mexico Smart Manufacturing Market, by Technology

10.2.8.3 Mexico Smart Manufacturing Market by End-User

10.3 Europe

10.3.1 Trend Analysis

10.3.2 Eastern Europe

10.3.2.1 Eastern Europe Smart Manufacturing Market by Country

10.3.2.2 Eastern Europe Smart Manufacturing Market, by Component

10.3.2.3 Eastern Europe Smart Manufacturing Market, by Technology

10.3.2.4 Eastern Europe Smart Manufacturing Market by End-User

10.3.2.5 Poland

10.3.2.5.1 Poland Smart Manufacturing Market, by Component

10.3.2.5.2 Poland Smart Manufacturing Market, by Technology

10.3.2.5.3 Poland Smart Manufacturing Market by End-User

10.3.2.6 Romania

10.3.2.6.1 Romania Smart Manufacturing Market, by Component

10.3.2.6.2 Romania Smart Manufacturing Market, by Technology

10.3.2.6.4 Romania Smart Manufacturing Market by End-User

10.3.2.7 Hungary

10.3.2.7.1 Hungary Smart Manufacturing Market, by Component

10.3.2.7.2 Hungary Smart Manufacturing Market, by Technology

10.3.2.7.3 Hungary Smart Manufacturing Market by End-User

10.3.2.8 Turkey

10.3.2.8.1 Turkey Smart Manufacturing Market, by Component

10.3.2.8.2 Turkey Smart Manufacturing Market, by Technology

10.3.2.8.3 Turkey Smart Manufacturing Market by End-User

10.3.2.9 Rest of Eastern Europe

10.3.2.9.1 Rest of Eastern Europe Smart Manufacturing Market, by Component

10.3.2.9.2 Rest of Eastern Europe Smart Manufacturing Market, by Technology

10.3.2.9.3 Rest of Eastern Europe Smart Manufacturing Market by End-User

10.3.3 Western Europe

10.3.3.1 Western Europe Smart Manufacturing Market by Country

10.3.3.2 Western Europe Smart Manufacturing Market, by Component

10.3.3.3 Western Europe Smart Manufacturing Market, by Technology

10.3.3.4 Western Europe Smart Manufacturing Market by End-User

10.3.3.5 Germany

10.3.3.5.1 Germany Smart Manufacturing Market, by Component

10.3.3.5.2 Germany Smart Manufacturing Market, by Technology

10.3.3.5.3 Germany Smart Manufacturing Market by End-User

10.3.3.6 France

10.3.3.6.1 France Smart Manufacturing Market, by Component

10.3.3.6.2 France Smart Manufacturing Market, by Technology

10.3.3.6.3 France Smart Manufacturing Market by End-User

10.3.3.7 UK

10.3.3.7.1 UK Smart Manufacturing Market, by Component

10.3.3.7.2 UK Smart Manufacturing Market, by Technology

10.3.3.7.3 UK Smart Manufacturing Market by End-User

10.3.3.8 Italy

10.3.3.8.1 Italy Smart Manufacturing Market, by Component

10.3.3.8.2 Italy Smart Manufacturing Market, by Technology

10.3.3.8.3 Italy Smart Manufacturing Market by End-User

10.3.3.9 Spain

10.3.3.9.1 Spain Smart Manufacturing Market, by Component

10.3.3.9.2 Spain Smart Manufacturing Market, by Technology

10.3.3.9.3 Spain Smart Manufacturing Market by End-User

10.3.3.10 Netherlands

10.3.3.10.1 Netherlands Smart Manufacturing Market, by Component

10.3.3.10.2 Netherlands Smart Manufacturing Market, by Technology

10.3.3.10.3 Netherlands Smart Manufacturing Market by End-User

10.3.3.11 Switzerland

10.3.3.11.1 Switzerland Smart Manufacturing Market, by Component

10.3.3.11.2 Switzerland Smart Manufacturing Market, by Technology

10.3.3.11.3 Switzerland Smart Manufacturing Market by End-User

10.3.3.12 Austria

10.3.3.12.1 Austria Smart Manufacturing Market, by Component

10.3.3.12.2 Austria Smart Manufacturing Market, by Technology

10.3.3.12.3 Austria Smart Manufacturing Market by End-User

10.3.3.13 Rest of Western Europe

10.3.3.13.1 Rest of Western Europe Smart Manufacturing Market, by Component

10.3.3.13.2 Rest of Western Europe Smart Manufacturing Market, by Technology

10.3.3.13.3 Rest of Western Europe Smart Manufacturing Market by End-User

10.4 Asia-Pacific

10.4.1 Trend Analysis

10.4.2 Asia-Pacific Smart Manufacturing Market by Country

10.4.3 Asia-Pacific Smart Manufacturing Market, by Component

10.4.4 Asia-Pacific Smart Manufacturing Market, by Technology

10.4.5 Asia-Pacific Smart Manufacturing Market by End-User

10.4.6 China

10.4.6.1 China Smart Manufacturing Market, by Component

10.4.6.2 China Smart Manufacturing Market, by Technology

10.4.6.3 China Smart Manufacturing Market by End-User

10.4.7 India

10.4.7.1 India Smart Manufacturing Market, by Component

10.4.7.2 India Smart Manufacturing Market, by Technology

10.4.7.3 India Smart Manufacturing Market by End-User

10.4.8 Japan

10.4.8.1 Japan Smart Manufacturing Market, by Component

10.4.8.2 Japan Smart Manufacturing Market, by Technology

10.4.8.3 Japan Smart Manufacturing Market by End-User

10.4.9 South Korea

10.4.9.1 South Korea Smart Manufacturing Market, by Component

10.4.9.2 South Korea Smart Manufacturing Market, by Technology

10.4.9.3 South Korea Smart Manufacturing Market by End-User

10.4.10 Vietnam

10.4.10.1 Vietnam Smart Manufacturing Market, by Component

10.4.10.2 Vietnam Smart Manufacturing Market, by Technology

10.4.10.3 Vietnam Smart Manufacturing Market by End-User

10.4.11 Singapore

10.4.11.1 Singapore Smart Manufacturing Market, by Component

10.4.11.2 Singapore Smart Manufacturing Market, by Technology

10.4.11.3 Singapore Smart Manufacturing Market by End-User

10.4.12 Australia

10.4.12.1 Australia Smart Manufacturing Market, by Component

10.4.12.2 Australia Smart Manufacturing Market, by Technology

10.4.12.3 Australia Smart Manufacturing Market by End-User

10.4.13 Rest of Asia-Pacific

10.4.13.1 Rest of Asia-Pacific Smart Manufacturing Market, by Component

10.4.13.2 Rest of Asia-Pacific Smart Manufacturing Market, by Technology

10.4.13.3 Rest of Asia-Pacific Smart Manufacturing Market by End-User

10.5 Middle East & Africa

10.5.1 Trend Analysis

10.5.2 Middle East

10.5.2.1 Middle East Smart Manufacturing Market by Country

10.5.2.2 Middle East Smart Manufacturing Market, by Component

10.5.2.3 Middle East Smart Manufacturing Market, by Technology

10.5.2.4 Middle East Smart Manufacturing Market by End-User

10.5.2.5 UAE

10.5.2.5.1 UAE Smart Manufacturing Market, by Component

10.5.2.5.2 UAE Smart Manufacturing Market, by Technology

10.5.2.5.3 UAE Smart Manufacturing Market by End-User

10.5.2.6 Egypt

10.5.2.6.1 Egypt Smart Manufacturing Market, by Component

10.5.2.6.2 Egypt Smart Manufacturing Market, by Technology

10.5.2.6.3 Egypt Smart Manufacturing Market by End-User

10.5.2.7 Saudi Arabia

10.5.2.7.1 Saudi Arabia Smart Manufacturing Market, by Component

10.5.2.7.2 Saudi Arabia Smart Manufacturing Market, by Technology

10.5.2.7.3 Saudi Arabia Smart Manufacturing Market by End-User

10.5.2.8 Qatar

10.5.2.8.1 Qatar Smart Manufacturing Market, by Component

10.5.2.8.2 Qatar Smart Manufacturing Market, by Technology

10.5.2.8.3 Qatar Smart Manufacturing Market by End-User

10.5.2.9 Rest of Middle East

10.5.2.9.1 Rest of Middle East Smart Manufacturing Market, by Component

10.5.2.9.2 Rest of Middle East Smart Manufacturing Market, by Technology

10.5.2.9.3 Rest of Middle East Smart Manufacturing Market by End-User

10.5.3 Africa

10.5.3.1 Africa Smart Manufacturing Market by Country

10.5.3.2 Africa Smart Manufacturing Market, by Component

10.5.3.3 Africa Smart Manufacturing Market, by Technology

10.5.3.4 Africa Smart Manufacturing Market by End-User

10.5.3.5 Nigeria

10.5.3.5.1 Nigeria Smart Manufacturing Market, by Component

10.5.3.5.2 Nigeria Smart Manufacturing Market, by Technology

10.5.3.5.3 Nigeria Smart Manufacturing Market by End-User

10.5.3.6 South Africa

10.5.3.6.1 South Africa Smart Manufacturing Market, by Component

10.5.3.6.2 South Africa Smart Manufacturing Market, by Technology

10.5.3.6.3 South Africa Smart Manufacturing Market by End-User

10.5.3.7 Rest of Africa

10.5.3.7.1 Rest of Africa Smart Manufacturing Market, by Component

10.5.3.7.2 Rest of Africa Smart Manufacturing Market, by Technology

10.5.3.7.3 Rest of Africa Smart Manufacturing Market by End-User

10.6 Latin America

10.6.1 Trend Analysis

10.6.2 Latin America Smart Manufacturing Market by Country

10.6.3 Latin America Smart Manufacturing Market, by Component

10.6.4 Latin America Smart Manufacturing Market, by Technology

10.6.5 Latin America Smart Manufacturing Market by End-User

10.6.6 Brazil

10.6.6.1 Brazil Smart Manufacturing Market, by Component

10.6.6.2 Brazil Smart Manufacturing Market, by Technology

10.6.6.3 Brazil Smart Manufacturing Market by End-User

10.6.7 Argentina

10.6.7.1 Argentina Smart Manufacturing Market, by Component

10.6.7.2 Argentina Smart Manufacturing Market, by Technology

10.6.7.3 Argentina Smart Manufacturing Market by End-User

10.6.8 Colombia

10.6.8.1 Colombia Smart Manufacturing Market, by Component

10.6.8.2 Colombia Smart Manufacturing Market, by Technology

10.6.8.3 Colombia Smart Manufacturing Market by End-User

10.6.9 Rest of Latin America

10.6.9.1 Rest of Latin America Smart Manufacturing Market, by Component

10.6.9.2 Rest of Latin America Smart Manufacturing Market, by Technology

10.6.9.3 Rest of Latin America Smart Manufacturing Market by End-User

11. Company Profiles

11.1 3D System, Inc.

11.1.1 Company Overview

11.1.2 Financial

11.1.3 Products/ Services Offered

11.1.4 The SNS View

11.2 ABB, Cisco System, Inc.

11.2.1 Company Overview

11.2.2 Financial

11.2.3 Products/ Services Offered

11.2.4 The SNS View

11.3 Emerson Electric Co.

11.3.1 Company Overview

11.3.2 Financial

11.3.3 Products/ Services Offered

11.3.4 The SNS View

11.4 General Electric

11.4.1 Company Overview

11.4.2 Financial

11.4.3 Products/ Services Offered

11.4.4 The SNS View

11.5 Honeywell International Inc.

11.5.1 Company Overview

11.5.2 Financial

11.5.3 Products/ Services Offered

11.5.4 The SNS View

11.6 IBM

11.6.1 Company Overview

11.6.2 Financial

11.6.3 Products/ Services Offered

11.6.4 The SNS View

11.7 Mitsubishi Electric Corporation

11.7.1 Company Overview

11.7.2 Financial

11.7.3 Products/ Services Offered

11.7.4 The SNS View

11.8 Rockwell Automation

11.8.1 Company Overview

11.8.2 Financial

11.8.3 Products/ Services Offered

11.8.4 The SNS View

11.9 Schneider Electric

11.9.1 Company Overview

11.9.2 Financial

11.9.3 Products/ Services Offered

11.9.4 The SNS View

11.10 Siemens

11.10.1 Company Overview

11.10.2 Financial

11.10.3 Products/ Services Offered

11.10.4 The SNS View

12. Competitive Landscape

12.1 Competitive Benchmarking

12.2 Market Share Analysis

12.3 Recent Developments

12.3.1 Industry News

12.3.2 Company News

12.3.3 Mergers & Acquisitions

13. Use Case and Best Practices

14. Conclusion

An accurate research report requires proper strategizing as well as implementation. There are multiple factors involved in the completion of good and accurate research report and selecting the best methodology to compete the research is the toughest part. Since the research reports we provide play a crucial role in any company’s decision-making process, therefore we at SNS Insider always believe that we should choose the best method which gives us results closer to reality. This allows us to reach at a stage wherein we can provide our clients best and accurate investment to output ratio.

Each report that we prepare takes a timeframe of 350-400 business hours for production. Starting from the selection of titles through a couple of in-depth brain storming session to the final QC process before uploading our titles on our website we dedicate around 350 working hours. The titles are selected based on their current market cap and the foreseen CAGR and growth.


The 5 steps process:

Step 1: Secondary Research:

Secondary Research or Desk Research is as the name suggests is a research process wherein, we collect data through the readily available information. In this process we use various paid and unpaid databases which our team has access to and gather data through the same. This includes examining of listed companies’ annual reports, Journals, SEC filling etc. Apart from this our team has access to various associations across the globe across different industries. Lastly, we have exchange relationships with various university as well as individual libraries.

Secondary Research

Step 2: Primary Research

When we talk about primary research, it is a type of study in which the researchers collect relevant data samples directly, rather than relying on previously collected data.  This type of research is focused on gaining content specific facts that can be sued to solve specific problems. Since the collected data is fresh and first hand therefore it makes the study more accurate and genuine.

We at SNS Insider have divided Primary Research into 2 parts.

Part 1 wherein we interview the KOLs of major players as well as the upcoming ones across various geographic regions. This allows us to have their view over the market scenario and acts as an important tool to come closer to the accurate market numbers. As many as 45 paid and unpaid primary interviews are taken from both the demand and supply side of the industry to make sure we land at an accurate judgement and analysis of the market.

This step involves the triangulation of data wherein our team analyses the interview transcripts, online survey responses and observation of on filed participants. The below mentioned chart should give a better understanding of the part 1 of the primary interview.

Primary Research

Part 2: In this part of primary research the data collected via secondary research and the part 1 of the primary research is validated with the interviews from individual consultants and subject matter experts.

Consultants are those set of people who have at least 12 years of experience and expertise within the industry whereas Subject Matter Experts are those with at least 15 years of experience behind their back within the same space. The data with the help of two main processes i.e., FGDs (Focused Group Discussions) and IDs (Individual Discussions). This gives us a 3rd party nonbiased primary view of the market scenario making it a more dependable one while collation of the data pointers.

Step 3: Data Bank Validation

Once all the information is collected via primary and secondary sources, we run that information for data validation. At our intelligence centre our research heads track a lot of information related to the market which includes the quarterly reports, the daily stock prices, and other relevant information. Our data bank server gets updated every fortnight and that is how the information which we collected using our primary and secondary information is revalidated in real time.

Data Bank Validation

Step 4: QA/QC Process

After all the data collection and validation our team does a final level of quality check and quality assurance to get rid of any unwanted or undesired mistakes. This might include but not limited to getting rid of the any typos, duplication of numbers or missing of any important information. The people involved in this process include technical content writers, research heads and graphics people. Once this process is completed the title gets uploader on our platform for our clients to read it.

Step 5: Final QC/QA Process:

This is the last process and comes when the client has ordered the study. In this process a final QA/QC is done before the study is emailed to the client. Since we believe in giving our clients a good experience of our research studies, therefore, to make sure that we do not lack at our end in any way humanly possible we do a final round of quality check and then dispatch the study to the client.

Key Segments

By Component

  • Hardware

  • Software

  • Services

By Technology

  • Machine Execution Systems

  • Programmable Logic Controller

  • Enterprise Resource Planning

  • SCADA

  • Discrete Control Systems

  • Human Machine Interface

  • Machine Vision

  • 3D Printing

  • Product Lifecycle Management

  • Plant Asset Management

By End-Use

  • Automotive

  • Aerospace & Defence

  • Chemicals & Materials

  • Healthcare

  • Industrial Equipment

  • Electronics

  • Food & Agriculture

  • Oil & Gas

  • Others

Request for Segment Customization as per your Business Requirement: Segment Customization Request

Regional Coverage

North America

  • US

  • Canada

  • Mexico

Europe

  • Eastern Europe

    • Poland

    • Romania

    • Hungary

    • Turkey

    • Rest of Eastern Europe

  • Western Europe

    • Germany

    • France

    • UK

    • Italy

    • Spain

    • Netherlands

    • Switzerland

    • Austria

    • Rest of Western Europe

Asia Pacific

  • China

  • India

  • Japan

  • South Korea

  • Vietnam

  • Singapore

  • Australia

  • Rest of Asia Pacific

Middle East & Africa

  • Middle East

    • UAE

    • Egypt

    • Saudi Arabia

    • Qatar

    • Rest of the Middle East

  • Africa

    • Nigeria

    • South Africa

    • Rest of Africa

Latin America

  • Brazil

  • Argentina

  • Colombia

  • Rest of Latin America

Request for Country Level Research Report: Country Level Customization Request

Available Customization

With the given market data, SNS Insider offers customization as per the company’s specific needs. The following customization options are available for the report:

  • Product Analysis

  • Criss-Cross segment analysis (e.g. Product X Application)

  • Product Matrix which gives a detailed comparison of product portfolio of each company

  • Geographic Analysis

  • Additional countries in any of the regions

  • Company Information

  • Detailed analysis and profiling of additional market players (Up to five)


  •            5000 (33% Discount)


  •            8950 (40% Discount)


  •            3050 (23% Discount)

Start a Conversation

Hi! Click one of our member below to chat on Phone