Self-Sampling Blood Collection Storage Device Market Report Scope & Overview:
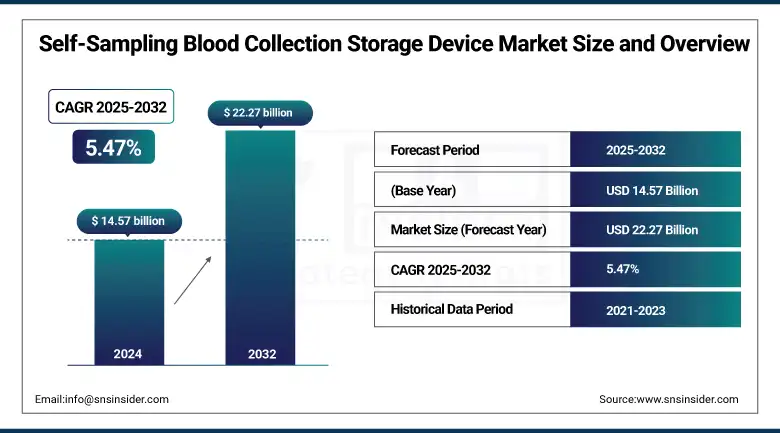
The self-sampling blood collection storage device market size was valued at USD 14.57 billion in 2024 and is expected to reach USD 22.27 billion by 2032, growing at a CAGR of 5.47% over 2025-2032.
The self-sampling blood collection storage device market has significant momentum, increasing acceptance of decentralized diagnostics, consumer demand for home-based testing, and growing research and development on microsampling technologies. This market is being served by an explosive increase in chronic disease burden and infectious epidemics, which has refocused attention on remote healthcare delivery. Companies such as Tasso Inc., Neoteryx, and Seventh Sense Biosystems are developing less-invasive products such as capillary blood collection kits and DBS systems that are making collection more convenient while also being more clinically accurate.
To Get more information On Self-Sampling Blood Collection Storage Device Market - Request Free Sample Report
In June 2024, Drawbridge Health extended its OneDraw system to all participants in a clinical trial for self-sampling and cloud-based reporting to its platform, increasing the platform’s clinical scalability.
Regulatory agencies, including the U.S. FDA and European CE, are creating fast tracks for remote diagnostics, expediting product certification. Moreover, growth in telehealth and direct-to-consumer diagnostics is boosting the self-sampling blood collection storage device market, increasing the number of U.S. users of at-home collection kits after 2020, which was approximately 60%. Overall, R&D expenditure in the sector is increasing and is being stimulated by grants and public-private financings, with more than USD 600 million of venture capital invested globally from 2020-2024. Increasing self-sampling blood collection storage devices market share is also estimated to be driven by growing distribution solutions such as e-commerce and pharmacy retail chains.
In April 2024, Capitainer AB released a new CE-marked device for volumetric urine sampling, enhancing options for sample collection in the self-sampling blood collection storage device market, in line with the latest governing self-sampling blood collection storage device market trends for non-invasive tests.
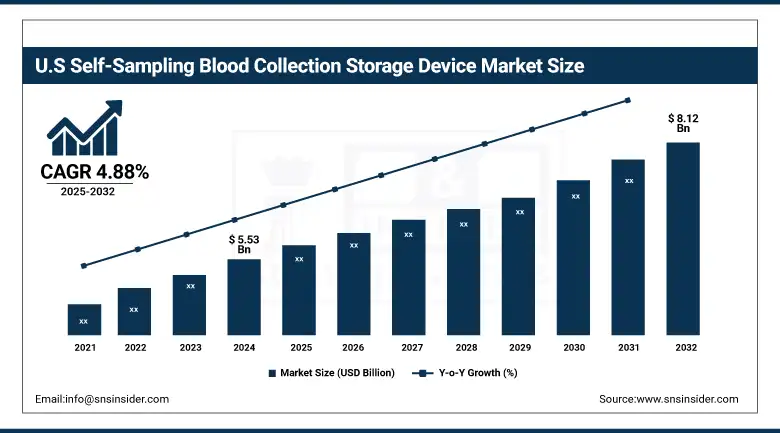
The U.S. self-sampling blood collection storage device market size was valued at USD 5.53 billion in 2024 and is expected to reach USD 8.12 billion by 2032, growing at a CAGR of 4.88% over 2025-2032. The U.S. held over 41% of the global share in 2024, led by the availability of DTC (direct-to-consumer) diagnostic kits and FDA-approved self-sampling devices for the purpose of COVID-19 as well as genetic diagnosis. In Canada, we are also seeing greater adoption with the increased availability of telehealth services. Among the big players that have started to allow consumers to take their samples are Everlywell and Labcorp, allowing the U.S. to lead as the U.S. has a tech-enabled diagnostics infrastructure that helps facilitate diagnostics, said Maarleveld.
Market Dynamics:
Drivers:
-
Increasing Consumer Demand for Convenience, Rise in Telehealth Services, and Advancements in Minimally Invasive Sample Collection Technologies
Rising incidences of chronic diseases and growing awareness levels for diagnostics have been propelling consumers towards home testing services. For instance, as per the Health Consumer Report 2023, more than 68% of the population living in developed regions are likely to opt for remote diagnostics, which involves normal blood testing. Regulatory backing is also a driver of growth FDA’s 510(k) clearance of home use blood collection devices and supportive CE marking resulted in faster product launches. Supply chain advancements and the rise of e-commerce have also broadened this access to these kits.
Companies such as Loop Medical and Owen Mumford are investing heavily in user-centric device and digital health system integrations. In addition, global R&D investments reached over USD 700 million for 2021-2024, signifying a significant commitment to the development of sample stability, microfluidics, and automation technologies. Growing acceptance of decentralised clinical trials is also helping drive the trend, as self-sampling kits dramatically alleviate the logistical challenge of patient enrolment. The trajectory of the self-sampling blood collection storage device market is now being directed towards digital integration and AI-enabled analytics that permit real-time diagnostics and extended clinical applications.
Restraints:
-
Variability in Sample Quality, Lack of Standardization, and Regulatory Inconsistencies Across Regions are the Major Hindrances of the Market
One of the most straightforward challenges is preserving the integrity of the samples. Studies in the Journal of Clinical Pathology (2023) reported that there is a 15-20% variation in the accuracy of tests as a result of incorrect home treatment or collection methods. Moreover, few trained staff in areas far from the lab or in rural areas may be problematic for user compliance or sample quality. There are also regulatory restrictions: some areas fast-track self-testing kits while others require extensive validation to the point that there is no uptake. However, there are several countries, such as Japan and India, which have their at-home diagnostic approval frameworks yet to be fleshed out.
On the supply side, there are challenges with scaling microfluidic component manufacturing and chip shortages that will affect device availability in 2022–2023. And reimbursement from insurers is also spotty, with only about 45% of payers globally reimbursing home collection kits by 2024. Concerns over data privacy for cloud-based diagnostics and paucities of electronic health record (EHR) interoperability also limit broader clinical integration. As the self-sampling blood collection storage device market share grows, surmounting these systemic and operational challenges is necessary for long-term self-sampling blood collection storage device market growth.
Segmentation Analysis:
By Product Type
Capillary blood collection devices were the largest product segment in 2024, accounting for 42% of the market share on account of convenient design, home-use tests, and the capacity to maintain the dried blood spot tested. They've since become the established standard for finger-prick testing in chronic disease management and infectious disease testing.
However, saliva collection devices are experiencing the fastest growth, against a background of rising demand for painless, non-invasive sampling processes, in particular for genetic testing, drug screening, and wellness testing. Their nature of being child-friendly, geriatric-friendly, and needle-phobic-friendly renders them increasingly appealing for direct-to-consumer applications. Rising integration with clinical genomics testing systems, coupled with regulatory approvals, is also supplementing the market growth.
By Sample Type
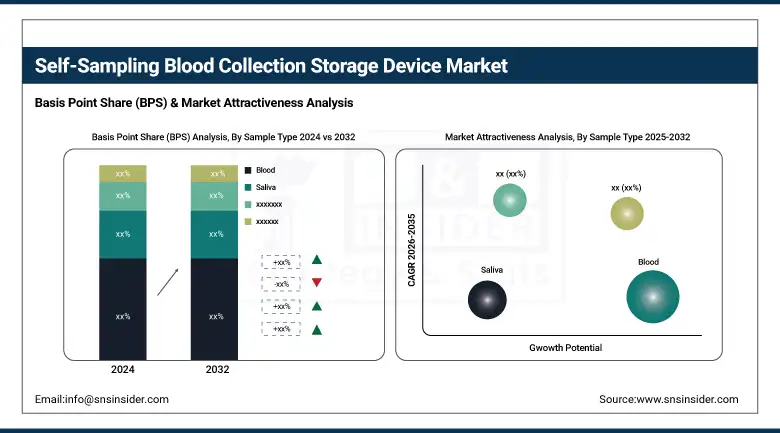
Demand for blood samples was the greatest in 2024, contributing to over 58% of the market, owing to the availability of maximum biomarker information, and was the most widely utilized sample for the diagnosis of infectious diseases, metabolic disorders, and chronic disorders. The increase in at-home blood chemistry testing, aided by user-friendly finger-prick kits, is further cementing blood’s reign as the way to go for self-sampling.
Meanwhile, Saliva was the fastest-growing sample type, driven mainly by its increasing use in DNA-based health and ancestry testing, the detection of COVID-19 infection, and hormonal testing. Its non-invasive and self-collection features have been spurring consumer adoption, particularly in wellness and lifestyle monitoring, as well as simplifying logistics for remote labs and telehealth platforms.
By Application
In 2024, the infectious disease testing held the largest share of the market, among applications, that is around a 35% share, due to the ongoing need for remote COVID-19 testing, HIV screening, and hepatitis testing. Increased adherence and early diagnosis are due to the possibility of performing tests at home, without the need for clinical consultation.
Meanwhile, genetic testing is the most rapidly emerging application, powered by soaring demand for personalized medicine, preventive healthcare, and family lineage discovery. The increasing availability of direct-to-consumer companies that offer subscription-based genomic testing has made it convenient and affordable for consumers, driving the expansion. Growing collaborations between biotech companies and self-sampling device producers are also driving the accessibility of genetic testing through home sample kits.
By Distribution Channel
Among the distribution channel segments, online retailers were the leading contributor in 2024, contributing more than 40% of the market, as there was an increase in digitalization of healthcare access and a rise in inclination of consumers toward home delivery of diagnostic kits. E-commerce platforms are a convenient outlet for both direct-to-consumer sales and subscription services, offering users privacy, speed, and immediate access to diagnostic tools.
The fastest growing channel is direct-to-patient sales. Diagnostic firms are going directly to consumers with customized test kits via brand-owned websites and, increasingly, mobile apps, cutting out traditional middlemen. This model enhances margins, increases customer engagement, and helps facilitate integrations with telehealth ecosystems and remote monitoring programs.
By End User
The home-based care settings led the end user segment in 2024, accounting for about 38% of the market revenue share, as people are preferring home-based testing solutions of late due to changed buying behaviour post-pandemic. The ease of use, low clinical overhead, and time savings have resulted in a significant transition from the traditional clinical setting toward in-home diagnostics. The segment of pharmaceutical & biotechnology companies is expected to grow at the highest CAGR. These companies are quickly adopting self-sampling kits for use in decentralized clinical trials, real-world data collection, and biomarker studies. Remote sample collection’s adaptability helps increase patient recruitment and retention in trials, as well as facilitate more rapid, scalable sample collection workflows for R&D and drug development.
Regional Analysis:
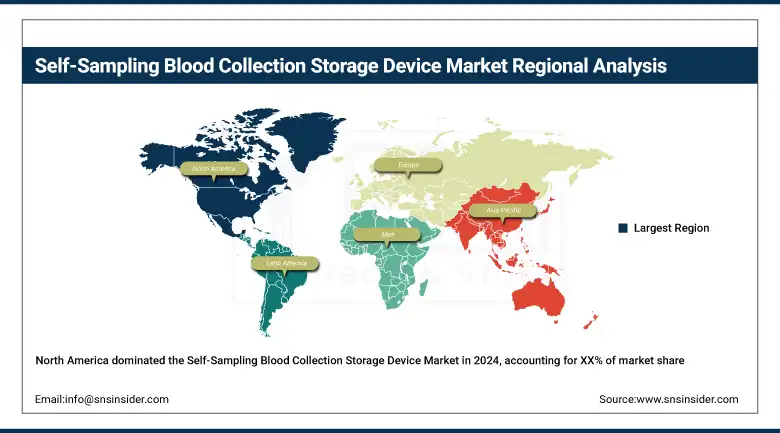
North America held the largest share of the self-sampling blood collection and storage device market in 2024, owing to high levels of uptake of home healthcare technologies, robust insurance policies, and an increased aging population with chronic diseases.
Get Customized Report as per Your Business Requirement - Enquiry Now
Europe was the second-largest regional market in 2024, on account of increasing investments in personalized medicine and government efforts for promoting easy access to early disease diagnostics. The UK led the regional share because of robust NHS backing for home testing and diagnostic startup collaborations. The British market represents close to 26% of the European market. Germany and France also reported significant use of the saliva and blood testing kits in outpatient settings.
With improving access to healthcare, increasing consumer awareness, and increasing prevalence of urban home care diagnostics, the Asia Pacific is the fastest-growing region. China was the leading country with more than 33% share in 2024, driven by the uptake of smart health devices and government-driven digital health initiatives. India and Japan are new-growing markets where rural diagnostic penetration has been growing with the help of government-led initiatives (such as Ayushman Bharat). The growing prevalence of the large elderly population leveraging technology in Japan is supporting the need for user-friendly blood collection devices for chronic care.
Key Players:
Leading self-sampling blood collection storage device companies in the market include Neoteryx, DBS System SA, Tasso Inc., Seventh Sense Biosystems, Capitainer AB, Spot On Sciences, Drawbridge Health, Weavr Health, Microdrop, PanoHealth, LAMEDITECH, Trajan Scientific and Medical, YourBio Health, Rhinostics, Hemex Health, Loop Medical SA, Owen Mumford Ltd., HemoLink, Babson Diagnostics, and Everlywell.
Recent Developments:
In February 2025, Tasso Inc. partnered with ARUP Laboratories to operationalize high-quality at-home blood testing services for clinical research.
In November 2024, Capitainer AB launched its SEP10 sampling card, a CE-marked device that collects separated blood, creating a plasma-like sample without centrifugation.
| Report Attributes | Details |
|---|---|
| Market Size in 2024 | USD 14.57 billion |
| Market Size by 2032 | USD 22.27 billion |
| CAGR | CAGR of 5.47% From 2025 to 2032 |
| Base Year | 2024 |
| Forecast Period | 2025-2032 |
| Historical Data | 2021-2023 |
| Report Scope & Coverage | Market Size, Segments Analysis, Competitive Landscape, Regional Analysis, DROC & SWOT Analysis, Forecast Outlook |
| Key Segments | • By Product Type (Capillary Blood Collection Devices, Venous Blood Collection Devices, Saliva Collection Devices, Urine Collection Devices, Others [hybrid multi-fluid collection kits, lancets, and integrated storage systems]) • By Sample Type (Blood, Saliva, Urine, Others [sweat or breath samples]) • By Application (Genetic Testing, Infectious Disease Testing, Drug Testing, Blood Chemistry Testing, Health & Wellness Monitoring, Others [biomarker discovery, oncology testing, and fertility/menstrual cycle tracking]) • By Distribution Channel (Online Retailers, Pharmacies, Medical Equipment Distributors, Direct-to-Patient Sales) • By End User (Hospitals and Clinics, Home-Based Care Settings, Diagnostic Laboratories, Research Laboratories / Academic Institutes, Pharmaceutical & Biotechnology Companies) |
| Regional Analysis/Coverage | North America (U.S., Canada), Europe (Germany, France, UK, Italy, Spain, Russia, Poland, Rest of Europe), Asia Pacific (China, India, Japan, South Korea, Australia, ASEAN Countries, Rest of Asia Pacific), Middle East & Africa (UAE, Saudi Arabia, Qatar, Egypt, South Africa, Rest of Middle East & Africa), Latin America (Brazil, Argentina, Mexico, Colombia, Rest of Latin America) |
| Company Profiles | Neoteryx, DBS System SA, Tasso Inc., Seventh Sense Biosystems, Capitainer AB, Spot On Sciences, Drawbridge Health, Weavr Health, Microdrop, PanoHealth, LAMEDITECH, Trajan Scientific and Medical, YourBio Health, Rhinostics, Hemex Health, Loop Medical SA, Owen Mumford Ltd., HemoLink, Babson Diagnostics, and Everlywell. |
Frequently Asked Questions
Challenges include ensuring sample integrity during storage and transit, limited standardization, and low awareness in some developing regions.
Key players include Neoteryx, Tasso Inc., Drawbridge Health, Seventh Sense Biosystems, and diagnostics leaders like Roche, Abbott, and Becton Dickinson. These companies are investing in microsampling innovation, sample stability, and user-friendly devices.
North America and Europe are leading due to strong telehealth infrastructure, regulatory support, and high patient awareness. Asia-Pacific is the fastest-growing region, driven by expanding access to healthcare and digital diagnostics in countries like India and China.
Key trends include the integration of telehealth diagnostic tools, rising consumer preference for remote care, and increasing focus on personalized medicine. Demand is also growing for decentralized sample collection in drug development and chronic disease management.
The market was valued at over USD 14.57 billion in 2024 and is projected to grow significantly due to rising demand for home diagnostics and chronic disease monitoring.
Get in Touch
