Ticagrelor Market Report Scope & Overview:
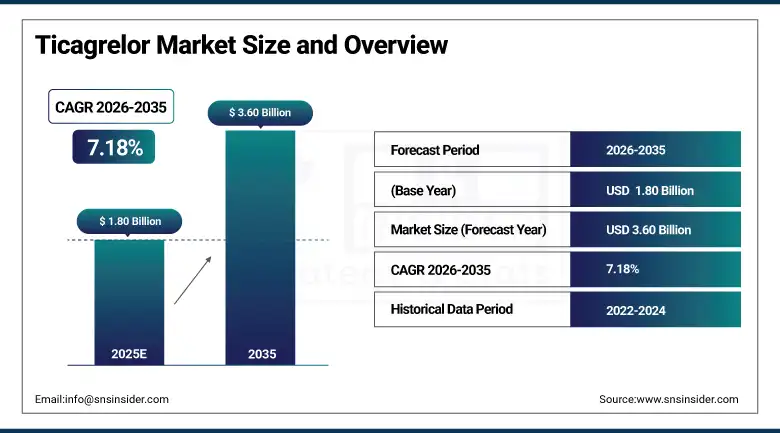
The Ticagrelor Market size was valued at USD 1.80 billion in 2025 and is expected to reach USD 3.60 billion by 2035, growing at a CAGR of 7.18% over the forecast period of 2026-2035.
Global ticagrelor market growth is primarily driven by the rising prevalence of cardiovascular diseases, particularly acute coronary syndrome (ACS) and myocardial infarction, which require effective antiplatelet therapy for prevention of recurrent cardiovascular events. Increasing adoption of advanced antiplatelet therapies in hospital settings, along with improved awareness of secondary prevention strategies for heart disease, continues to drive market expansion. Furthermore, the global rise in lifestyle-related risk factors such as obesity, diabetes, hypertension, and sedentary habits has significantly increased the incidence of coronary artery disease, thereby fueling the demand for effective platelet inhibition therapies like ticagrelor.
The growing adoption of ticagrelor in post-percutaneous coronary intervention (PCI) treatment protocols, as well as its inclusion in several international cardiology guidelines, has further strengthened its market presence. Increasing investments in cardiovascular drug development, along with the expansion of healthcare infrastructure in emerging economies, are creating favorable growth opportunities for the market. In addition, the expansion of digital healthcare platforms and telecardiology programs is helping improve early diagnosis and treatment adherence for cardiovascular patients, thereby supporting broader usage of antiplatelet medications.
In February 2025, several major cardiovascular treatment centers reported that ticagrelor-based dual antiplatelet therapy reduced the rate of recurrent cardiovascular events by nearly 22% among high-risk post-myocardial infarction patients, highlighting its growing importance in modern cardiac treatment protocols.
Ticagrelor Market Size and Forecast:
-
Market Size in 2025: USD 1.80 Billion
-
Market Size by 2035: USD 3.60 Billion
-
CAGR: 7.18% from 2026 to 2035
-
Base Year: 2025
-
Forecast Period: 2026–2035
-
Historical Data: 2022–2024
To Get more information On Ticagrelor Market - Request Free Sample Report
Ticagrelor Market Trends:
-
Increasing clinical preference for ticagrelor over traditional antiplatelet agents due to its superior platelet inhibition and reduced risk of cardiovascular mortality in high-risk patients.
-
Growing use of dual antiplatelet therapy (DAPT) combining ticagrelor with low-dose aspirin for patients suffering from acute coronary syndrome and those undergoing PCI procedures.
-
Rising focus on long-term secondary prevention of myocardial infarction and stroke among aging populations with chronic cardiovascular conditions.
-
Expansion of generic ticagrelor manufacturing in several regions, improving accessibility and affordability of antiplatelet medications.
-
Increased research efforts to evaluate ticagrelor’s benefits in peripheral arterial disease and other vascular complications.
-
Adoption of digital patient monitoring systems and telemedicine platforms supporting medication adherence among cardiac patients.
-
Growing healthcare expenditure in developing countries improving access to advanced cardiovascular therapies.
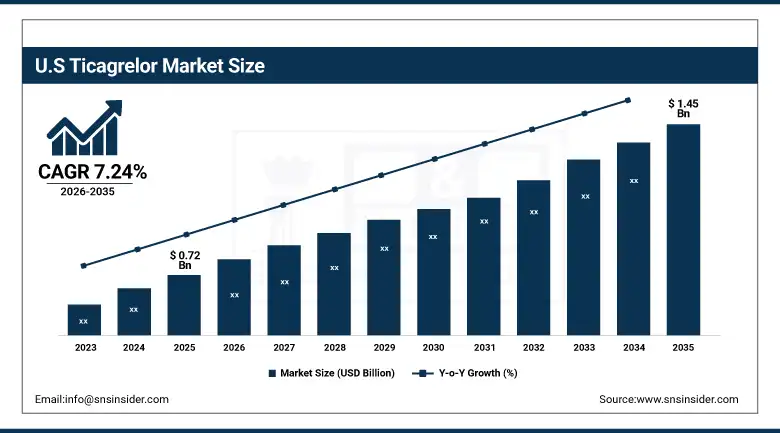
The U.S. Ticagrelor Market is estimated at USD 0.72 billion in 2025 and is expected to reach USD 1.45 billion by 2035, growing at a CAGR of 7.24% from 2026-2035. The United States dominates the global ticagrelor market due to its high prevalence of cardiovascular diseases, advanced healthcare infrastructure, and strong adoption of innovative antiplatelet medications. The presence of leading pharmaceutical companies, high cardiovascular treatment rates, and increasing awareness about preventive cardiac care contribute significantly to market expansion. Additionally, strong reimbursement frameworks and the widespread use of clinical guidelines recommending ticagrelor for acute coronary syndrome patients have further accelerated its adoption across hospitals and specialty cardiac centers in the country.
Ticagrelor Market Growth Drivers:
-
Rising Global Burden of Cardiovascular Diseases Driving Market Growth
The increasing global burden of cardiovascular diseases is one of the primary drivers supporting the growth of the ticagrelor market. Cardiovascular diseases remain the leading cause of death worldwide, accounting for millions of fatalities each year. Conditions such as acute coronary syndrome, myocardial infarction, and ischemic heart disease require effective antiplatelet therapy to prevent clot formation and reduce the risk of recurrent cardiovascular events. Ticagrelor has demonstrated strong clinical efficacy in preventing platelet aggregation and improving patient survival outcomes, making it a preferred therapy among cardiologists.
Furthermore, the growing number of percutaneous coronary intervention procedures worldwide has increased the demand for effective antiplatelet drugs to prevent stent thrombosis and improve post-procedure outcomes. As hospitals continue to expand their cardiology departments and adopt advanced treatment protocols, the demand for ticagrelor is expected to rise significantly.
For example, in April 2025, large hospital networks reported that the use of ticagrelor in dual antiplatelet therapy increased by nearly 28% in patients undergoing PCI procedures compared with the previous year.
Ticagrelor Market Restraints:
-
Bleeding Risk and High Treatment Costs Limiting Market Expansion
Despite its clinical benefits, certain challenges continue to restrict the growth of the ticagrelor market. One of the major concerns associated with ticagrelor therapy is the increased risk of bleeding complications, which can limit its use among certain patient populations such as elderly individuals or patients with existing bleeding disorders. Healthcare providers must carefully evaluate risk factors before prescribing the medication, which may limit its broader adoption in some clinical settings.
Additionally, the relatively higher cost of branded ticagrelor therapies compared with traditional antiplatelet medications may restrict accessibility in cost-sensitive healthcare markets. Limited insurance coverage and budget constraints in developing regions can also hinder widespread adoption of the drug, particularly in public healthcare systems.
Ticagrelor Market Opportunities:
-
Expansion of Generic Production and New Cardiovascular Applications Creating Market Opportunities
The expansion of generic ticagrelor production and increasing research into additional cardiovascular applications are expected to create significant opportunities for the global market. Several pharmaceutical manufacturers are focusing on developing cost-effective generic formulations that can improve accessibility in emerging markets. The availability of generic alternatives will likely accelerate the adoption of ticagrelor in regions where affordability remains a critical factor.
Moreover, ongoing clinical research exploring the effectiveness of ticagrelor in treating other vascular conditions such as peripheral arterial disease and stroke prevention is expected to expand its therapeutic applications. The integration of precision medicine approaches and personalized cardiovascular treatment plans may also increase the demand for advanced antiplatelet medications in the coming years.
For instance, in March 2025, clinical trials investigating ticagrelor therapy for high-risk peripheral arterial disease patients reported a significant reduction in thrombotic events, opening new avenues for future therapeutic use.
Ticagrelor Market Segment Analysis:
-
By dosage strength, the 90 mg tablets segment accounted for the largest share of 54.21% in 2025, while the 60 mg tablets segment is anticipated to exhibit the fastest growth with a CAGR of 7.64% during the forecast period.
-
By indication, the acute coronary syndrome segment held the highest market share of around 46.37% in 2025, whereas the myocardial infarction prevention segment is expected to grow at the highest CAGR of 7.82%.
-
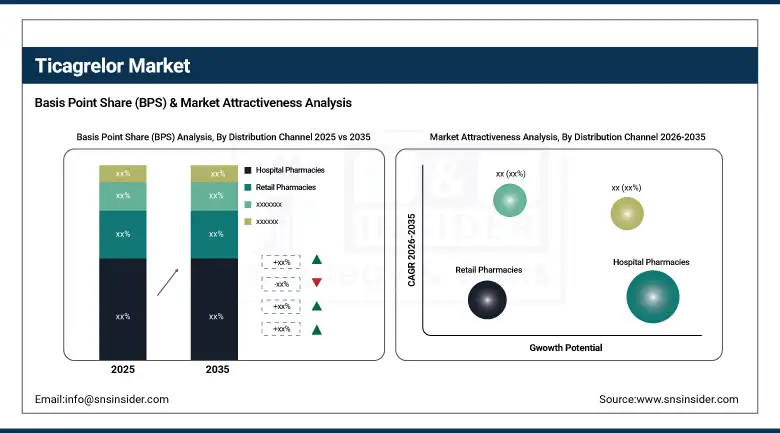
By distribution channel, hospital pharmacies dominated the market with a share of approximately 51.18% in 2025.
-
By end user, hospitals led the market with a share of nearly 55.63% in 2025, while specialty clinics are expected to grow at the fastest CAGR of 7.91%.
By Indication, Acute Coronary Syndrome Dominates, While Myocardial Infarction Prevention Shows Strong Growth
The acute coronary syndrome segment held the largest share of the ticagrelor market in 2025 due to the high prevalence of ACS cases worldwide and the widespread use of ticagrelor as a first-line antiplatelet therapy in emergency cardiac care. Patients suffering from unstable angina and myocardial infarction require immediate platelet inhibition therapy to prevent clot formation and reduce the risk of complications. Clinical guidelines recommending ticagrelor for ACS management have significantly strengthened its adoption across hospitals. Meanwhile, the myocardial infarction prevention segment is projected to grow at the fastest CAGR during the forecast period. Increasing focus on long-term secondary prevention strategies and improved post-MI patient management protocols are expected to boost the demand for ticagrelor in this segment.
By Dosage Strength, 90 mg Tablets Lead the Market
The 90 mg ticagrelor tablets segment accounted for the largest revenue share in 2025 as this dosage strength is commonly prescribed during the initial phase of treatment for acute coronary syndrome patients. The high efficacy of this dosage in rapidly inhibiting platelet aggregation makes it the preferred option for cardiologists treating patients with severe cardiovascular events. However, the 60 mg tablets segment is expected to grow steadily as it is widely used for long-term therapy and secondary prevention of cardiovascular events among patients who have previously experienced myocardial infarction.
By Distribution Channel, Hospital Pharmacies Dominate the Market
Hospital pharmacies held the largest share of the ticagrelor market due to the high volume of cardiovascular treatments performed in hospital settings. Patients diagnosed with acute coronary syndrome or undergoing PCI procedures typically receive ticagrelor prescriptions through hospital pharmacies during inpatient treatment. Retail pharmacies and online pharmacies are also witnessing steady growth as patients continue long-term antiplatelet therapy after discharge from hospitals. The expansion of e-pharmacy platforms is improving medication accessibility and convenience for patients managing chronic cardiovascular conditions.
By End User, Hospitals Lead While Specialty Clinics Show Rapid Growth
Hospitals accounted for the largest market share in 2025 as they serve as primary treatment centers for acute cardiac emergencies. The availability of advanced cardiology departments, intensive care units, and experienced healthcare professionals contributes to high prescription rates of ticagrelor within hospital settings. Specialty cardiac clinics are expected to grow at the fastest rate due to increasing outpatient cardiac care services and follow-up treatment programs designed to prevent recurrent cardiovascular events.
Ticagrelor Market Regional Highlights:
Asia Pacific Ticagrelor Market Insights:
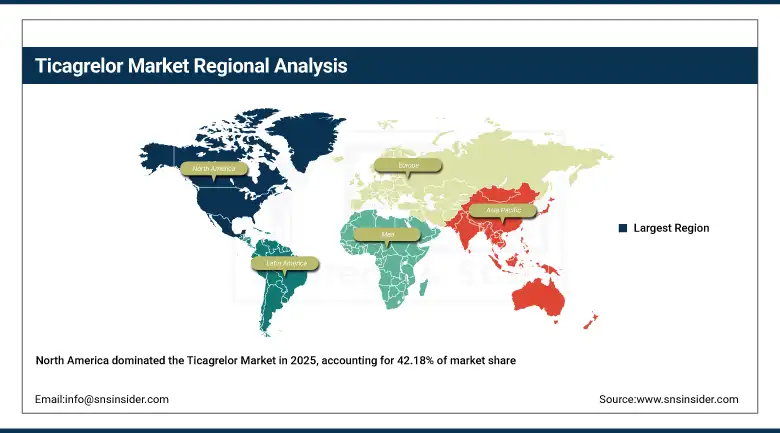
The Asia Pacific region is expected to register the fastest growth in the ticagrelor market, with a CAGR of 8.02% during the forecast period. The region’s growth is primarily driven by the rapidly increasing prevalence of cardiovascular diseases, growing aging populations, and expanding healthcare infrastructure. Countries such as China and India are witnessing a significant rise in heart disease cases due to lifestyle changes and urbanization, which has increased the demand for effective cardiovascular treatments. Additionally, government initiatives aimed at improving access to cardiovascular care, along with increasing investments in hospital infrastructure and cardiology services, are contributing to the rapid adoption of advanced antiplatelet medications in the region.
North America Ticagrelor Market Insights:
North America accounted for the largest revenue share of approximately 42.18% in 2025. The region benefits from highly developed healthcare infrastructure, strong adoption of advanced cardiovascular treatment protocols, and significant research activities related to cardiovascular drug development. The presence of leading pharmaceutical manufacturers and strong reimbursement systems further support market growth in the region
 .
.
Get Customized Report as per Your Business Requirement - Enquiry Now
Europe Ticagrelor Market Insights:
Europe represents the second-largest regional market for ticagrelor, supported by the region’s advanced healthcare systems and strong clinical adoption of evidence-based cardiovascular therapies. Increasing government investments in healthcare innovation and the presence of leading cardiovascular research institutes contribute significantly to market growth across European countries.
Latin America (LATAM) and Middle East & Africa (MEA) Ticagrelor Market Insights:
The markets in Latin America and the Middle East & Africa are expected to grow steadily due to improving healthcare infrastructure, increasing awareness of cardiovascular disease prevention, and expanding access to advanced cardiac medications. Governments and healthcare organizations in these regions are focusing on improving cardiac care services and expanding treatment availability for patients suffering from coronary artery diseases.
Ticagrelor Market Competitive Landscape:
The competitive landscape of the ticagrelor market is characterized by the presence of global pharmaceutical companies involved in cardiovascular drug development and manufacturing. Companies are focusing on expanding production capacities, developing generic formulations, and investing in clinical research to strengthen their market presence.
Ticagrelor Market Key Players:
-
AstraZeneca
-
Dr. Reddy’s Laboratories
-
Sun Pharmaceutical Industries
-
Cipla
-
Teva Pharmaceutical Industries
-
Lupin Limited
-
Cadila Pharmaceuticals
-
Aurobindo Pharma
-
Zydus Lifesciences
-
Hetero Drugs
-
Alkem Laboratories
-
Apotex Inc.
-
Mylan N.V.
-
Sandoz International
-
Glenmark Pharmaceuticals
-
Biocon Limited
-
Amneal Pharmaceuticals
-
Intas Pharmaceuticals
-
Abbott Laboratories
-
Pfizer Inc.
| Report Attributes | Details |
|---|---|
| Market Size in 2025 | USD 1.80 Billion |
| Market Size by 2035 | USD 3.60 Billion |
| CAGR | CAGR of 7.18% From 2026 to 2035 |
| Base Year | 2025 |
| Forecast Period | 2026-2035 |
| Historical Data | 2022-2024 |
| Report Scope & Coverage | Market Size, Segments Analysis, Competitive Landscape, Regional Analysis, DROC & SWOT Analysis, Forecast Outlook |
| Key Segments | • By Dosage Strength: 60 mg Tablets, 90 mg Tablets, Others (special strengths, combination formulations, investigational doses). • By Indication: Acute Coronary Syndrome (ACS), Myocardial Infarction (MI) Prevention, Percutaneous Coronary Intervention (PCI), Others (stroke prevention in high-risk cardiovascular patients, peripheral arterial disease). • By Distribution Channel: Hospital Pharmacies, Retail Pharmacies, Online Pharmacies, Others (specialty cardiac clinics, government tenders, institutional supply). • By End User: Hospitals, Specialty Clinics, Ambulatory Surgical Centers, Others (research organizations, rehabilitation centers). |
| Regional Analysis/Coverage | North America (U.S., Canada), Europe (Germany, France, UK, Italy, Spain, Russia, Poland, Rest of Europe), Asia Pacific (China, India, Japan, South Korea, Australia, ASEAN Countries, Rest of Asia Pacific), Middle East & Africa (UAE, Saudi Arabia, Qatar, Egypt, South Africa, Rest of Middle East & Africa), Latin America (Brazil, Argentina, Mexico, Colombia, Rest of Latin America) |
| Company Profiles | AstraZeneca, Dr. Reddy’s Laboratories, Sun Pharmaceutical Industries, Cipla, Teva Pharmaceutical Industries, Lupin Limited, Cadila Pharmaceuticals, Aurobindo Pharma, Zydus Lifesciences, Hetero Drugs, Alkem Laboratories, Apotex Inc., Mylan N.V., Sandoz International, Glenmark Pharmaceuticals, Biocon Limited, Amneal Pharmaceuticals, Intas Pharmaceuticals, Abbott Laboratories, Pfizer Inc. |
Frequently Asked Questions
The global ticagrelor market is expected to reach USD 3.60 billion by 2035, growing from USD 1.80 billion in 2025.
The market is projected to grow at a CAGR of 7.18% over the forecast period from 2026 to 2035.
Key drivers include the rising prevalence of cardiovascular diseases, increasing PCI procedures, growing use of dual antiplatelet therapy, and expanding healthcare infrastructure in emerging economies.
North America leads the global market due to advanced healthcare infrastructure, high cardiovascular treatment rates, and strong adoption of antiplatelet therapies.
The 90 mg tablets segment holds the largest market share, accounting for 54.21% in 2025, as it is widely used in the initial treatment of acute coronary syndrome patients.
Get in Touch
