Sensor Testing Market Report Scope & Overview:
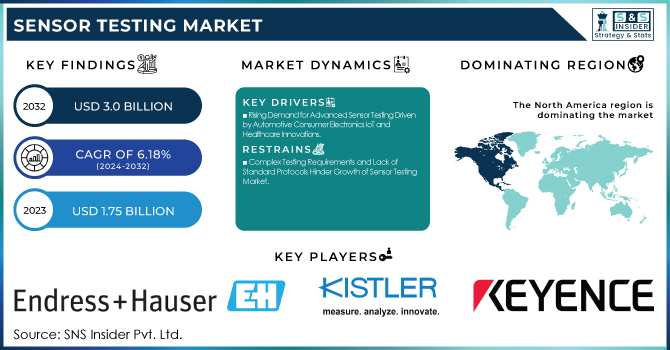
The Sensor Testing Market was valued at USD 1.75 billion in 2023 and is expected to reach USD 3 billion by 2032, growing at a CAGR of 6.18% over the forecast period 2024-2032. The increasing complexity of modern sensors, especially for use in autonomous vehicles, industrial automation, and IoT devices, rapidly fosters the adoption of advanced testing technologies in the Sensor Testing Market. Testing facilities are increasingly required by companies to take maximum advantage of their operational efficiency and to shorten the time to market for new sensor products. Using it, the major paradigm shift towards virtual testing, and simulation to reduce cost and time associated with validation processes is significantly increasing. Based on market segmentation, various industries have shown different levels of adoption of advanced sensor testing solutions, especially automotive, industrial, and consumer electronics.
Get E-PDF Sample Report on Sensor Testing Market - Request Sample Report
Market Dynamics
Key Drivers:
-
Rising Demand for Advanced Sensor Testing Driven by Automotive Consumer Electronics IoT and Healthcare Innovations
Some of the major factors propelling the growth of the sensor testing market size include the burgeoning requirement for advanced sensors in the automotive industry. Electric vehicles (EVs) and autonomous driving (AD) systems are driving demand for high-accuracy sensors for safety, navigation, and performance. Furthermore, the widespread incorporation of sensor technology in modern-day consumer electronics like smartphones and mobile devices also accelerates the growth of the market. Reliable testing is more in demand. The growth of IoT devices and smart home solutions is also increasing the need for reliable testing of sensors to ensure connectivity and functional efficiency. In addition, upcoming innovations associated with healthcare technology like wearable health monitors & diagnostic equipment are expected to increase the need for precise sensor testing to comply with tight regulatory requirements.
Restrain:
-
Complex Testing Requirements and Lack of Standard Protocols Hinder Growth of Sensor Testing Market
The complexity involved in testing has widely become one of the more significant restraints in the sensor testing market for advanced sensors utilized in modern applications, including autonomous vehicles, IoT devices, and industrial automation systems. These sensors also need very complex testing methodologies and equipment to perform accelerometer testing to be accurate, reliable, and safe. In addition, the fast evolution of sensor technologies (to miniaturize and integrate functions) does not facilitate the creation of standard testing protocols. This results in inconsistencies in testing results and slows sensor testing from being adopted broadly.
Opportunity:
-
Industrial Automation and Smart Cities Drive Demand for Advanced Sensor Testing Solutions Worldwide
One of the major application segments to grow the sensor testing market is industrial automation. With rising automation and robotics in industries to boost productivity and save regional operational costs globally, strong sensors are in demand for monitoring and control systems. This is especially significant in the manufacturing, logistics, and process sectors. In addition, an increase in the need for predictive maintenance and Industry 4.0 will open up opportunities for sensor testing solutions that provide better accuracy and real-time data analysis. Apart from this, some market opportunities are likely to arise for sensor testing in the field of infrastructure monitoring and environmental sensing applications in the Asia-Pacific region and smart city projects across the world.
Challenges:
-
Complex Sensor Networks and AI Integration Pose Challenges for Advanced Sensor Testing Solutions
The vertical growth of the sensor network for large industrial deployments and the horizontal growth of wireless and connected sensor systems are challenging the market for sensor testing. Testing frameworks and tools capable of providing assuring compatibility, interoperability, and security in such complex environments. Additionally, as AI and machine learning increasingly come into play for sensor data processing, testing to characterize the accuracy and performance of algorithms also requires high-accuracy test measurement.
Segment Analysis
By Offering
The hardware segment led the sensor testing market in 2023, contributing a dominant share of 64.7%. This dominance is due to the growing requirement for testing equipment including signal conditioners, data acquisition systems, and test chambers, which are crucial for the calibration and verification of the precision and reliability of sensors in various applications. These hardware solutions are extensively used across automotive, aerospace, and industrial sectors to test complex sensors deployed in safety-critical systems.
The software segment is projected to manifest the fastest CAGR between 2024 and 2032. Download Sample Report for Advanced Sensor Test Equipment Market But the recent growing adoption of advanced software solutions for data analysis, simulation, and automation is further helping in boosting the market expansion. With the growing complexity and interconnectivity of sensor networks, the need for smart testing platforms that provide online analytics and predictive maintenance features is becoming apparent. Additionally, the incorporation of artificial intelligence and machine learning algorithms in sensor testing software helps in improved accuracy and efficiency of testing, which will necessitate that the software be an integral part of today's sensor testing solutions.
By Sensor Type
Digital sensors accounted for a 65.1% share of the sensor testing market in 2023. Their key role in the success of numerous present-day applications such as consumer electronics, and automotive applications, from a3r to industrial automation has led to this dominance in number. They provide better accuracy, reproducibility as well as compatibility to seamlessly integrate with devices such as IoT and other smart systems, which facilitate real-time data processing and wireless communication.
Analog sensors are predicted to expand at the quickest CAGR from 2024-2032. They continue to grow in certain applications, where high sensitivity and a linear output are required for environmental monitoring, pressure sensing, and audio equipment. Analog sensors are also preferred in applications where cost is a critical parameter and where they can work in harsh environmental conditions where digital sensors cannot be deployed. Moreover, the implementation of analog-to-digital conversion technologies is improving the accessibility of analog sensors with digital technology which is one of the major factors propelling their demand for hybrid sensing solutions.
By Application
The automotive segment accounted for the largest share of 19.6% of the sensor testing market in 2023. This leadership happens at a time when there is a growing demand for ADAS, AV, and EV applications powered by high-precision sensors to provide safe navigation and optimized performance. The growing adoption of smart sensors for in-vehicle monitoring, collision avoidance, and adaptive cruise control drives even greater complexity and demands for sensor testing.
The industrial segment is anticipated to witness the highest growth rate during the forecast period 2024–2032. The sensor manufacturing market is gaining traction due to the increasing trend of relying on Industry 4.0 technology which in turn leads to automation and smart manufacturing systems based heavily on sensors for monitoring, control, and predictive maintenance. This is largely due to the industrial applications that necessitate sophisticated, long-lasting sensors because they are often placed in severe environments driving the need for more comprehensive sensor testing.
Regional Analysis
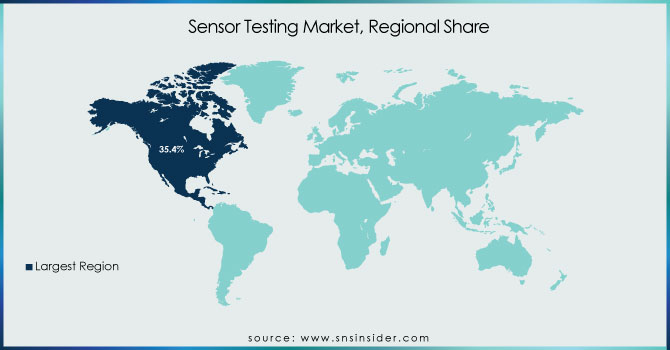
North America led the sensor testing market with a market share of 35.4% in 2023. The region's significant tenure with advanced automotive manufacturing, aerospace, and consumer electronics industries drives this leadership. Autonomous vehicles, especially in the United States where a lot of these are being developed, need to have their sensors tested under a wide range of conditions for safety and performance. Moreover, increasing usage of smart home devices as well as IoT solutions across North America are some factors accelerating the need for digital sensor testing. Tesla in broad terms over the years has tested various sensors widely for its Autopilot, and Apple validates sensors through a few advanced processes for its wearables and smartphones to name a few.
The Asia-Pacific region is projected to grow at the highest CAGR between 2024 to 2032. Rapid industrialization, along with a substantial increase in consumer electronics and electric vehicle production, particularly in China, Japan, and South Korea, has been acting as a growth factor for the market. The growing prominence of smart manufacturing and Industry 4.0 initiatives also contributes to the continued high demand for sophisticated sensor testing in industrial automation. For instance, China leads the production of electric vehicles through companies like BYD and NIO, while Japan's robotics industry supports vast sensor testing that benefits from the sort of precision only prosperous Western democracies can provide.
Get Customized Report as Per Your Business Requirement - Request For Customized Report
Key players
Some of the major players in the Sensor Testing Market are:
-
Endress+Hauser (Flow Measurement Devices, Level Measurement Instruments)
-
Kistler Group (High-Temperature Pressure Sensors, Piezoelectric Sensors)
-
Keyence (Photoelectric Sensors, Measuring Instruments)
-
Pepperl+Fuchs (Industrial Sensors, Explosion Protection Components)
-
Sick AG (Laser Scanners, Photoelectric Sensors)
-
Honeywell (Pressure Sensors, Temperature Sensors)
-
TE Connectivity (Humidity Sensors, Vibration Sensors)
-
Bosch Sensortec (Accelerometers, Gyroscopes)
-
STMicroelectronics (MEMS Sensors, Environmental Sensors)
-
Texas Instruments (Temperature Sensors, Proximity Sensors)
-
Omron Corporation (Proximity Sensors, Photoelectric Sensors)
-
Siemens (Pressure Transmitters, Flow Sensors)
-
ABB (Temperature Transmitters, Level Measurement Devices)
-
Yokogawa Electric (Flow Meters, Pressure Transmitters)
-
Rockwell Automation (Proximity Sensors, Photoelectric Sensors)
Recent Trends
-
In August 2024, SICK AG and Endress+Hauser signed a strategic partnership, with Endress+Hauser taking over global sales of SICK's process analyzers and gas flowmeters, and forming a joint venture to advance decarbonization technologies.
-
In June 2024, SICK launched the IMG inductive sensor, designed for reliable detection in challenging industrial environments, including extreme conditions like shocks and lubricants.
| Report Attributes | Details |
|---|---|
| Market Size in 2023 | USD 1.75 Billion |
| Market Size by 2032 | USD 3.0 Billion |
| CAGR | CAGR of 6.18% From 2024 to 2032 |
| Base Year | 2023 |
| Forecast Period | 2024-2032 |
| Historical Data | 2020-2022 |
| Report Scope & Coverage | Market Size, Segments Analysis, Competitive Landscape, Regional Analysis, DROC & SWOT Analysis, Forecast Outlook |
| Key Segments | • By Offering (Hardware, Software) • By Sensor Type (Analog Sensors, Digital Sensors) • By Application (Automotive, Consumer Electronics, Aerospace, Healthcare, Industrial, Others) |
| Regional Analysis/Coverage | North America (US, Canada, Mexico), Europe (Eastern Europe [Poland, Romania, Hungary, Turkey, Rest of Eastern Europe] Western Europe] Germany, France, UK, Italy, Spain, Netherlands, Switzerland, Austria, Rest of Western Europe]), Asia Pacific (China, India, Japan, South Korea, Vietnam, Singapore, Australia, Rest of Asia Pacific), Middle East & Africa (Middle East [UAE, Egypt, Saudi Arabia, Qatar, Rest of Middle East], Africa [Nigeria, South Africa, Rest of Africa], Latin America (Brazil, Argentina, Colombia, Rest of Latin America) |
| Company Profiles | Endress+Hauser, Kistler Group, Keyence, Pepperl+Fuchs, Sick AG, Honeywell, TE Connectivity, Bosch Sensortec, STMicroelectronics, Texas Instruments, Omron Corporation, Siemens, ABB, Yokogawa Electric, Rockwell Automation. |
Frequently Asked Questions
Ans: North America dominated the Sensor Testing Market in 2023.
Ans: The Automotive segment dominated the Sensor Testing Market in 2023.
Ans: The major growth factor of the Sensor Testing Market is the increasing demand for high-precision sensors in advanced automotive systems, industrial automation, and IoT applications.
Ans: Sensor Testing Market size was USD 1.75 billion in 2023 and is expected to Reach USD 3.0 billion by 2032.
Ans: The Sensor Testing Market is expected to grow at a CAGR of 6.18% during 2024-2032.
Get in Touch
