Autonomous Vehicles Market Size & Overview
Get More Information on Autonomous Vehicles Market - Request Sample Report
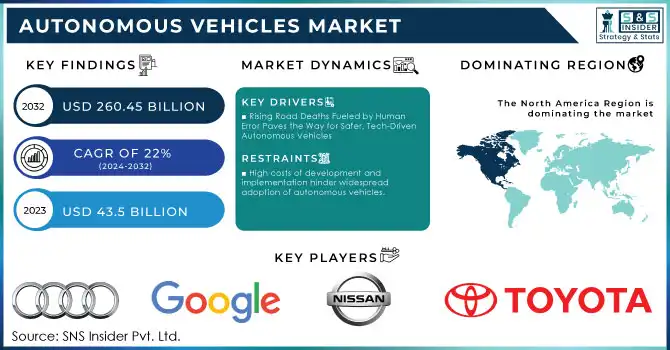
The Autonomous Vehicles Market Size was valued at USD 43.5 billion in 2023 and is expected to reach USD 260.45 billion by 2032 and grow at a CAGR of 22% over the forecast period 2024-2032.
Autonomous vehicles, also known as driverless cars, are revolutionizing transportation by using a combination of advanced technologies to navigate and operate without human input. These cars rely heavily on sensors to perceive their surroundings. Light detection and ranging (LiDAR), radio detection and ranging (RADAR) and cameras work together to create a real-time, three-dimensional map of the environment. This dynamic map allows the car's AI software to make decisions about steering, acceleration, and braking. With human error being a major cause of road accidents, self-driving cars have the potential to significantly improve road safety. Additionally, by optimizing driving patterns and reducing congestion, autonomous vehicles can contribute to a cleaner environment by lowering CO2 emissions. Furthermore, the widespread adoption of this technology is expected to boost the economic activity in various sectors like IT, technology, and electronics. The applications for autonomous vehicles extend far beyond personal transportation. They can be employed in industrial settings to manage fleets of vehicles, navigate construction zones, operate as public transportation shuttles, and even perform tasks in the agricultural industry.
MARKET DYNAMICS:
KEY DRIVERS:
-
Rising Road Deaths Fueled by Human Error Paves the Way for Safer, Tech-Driven Autonomous Vehicles
The roads are becoming increasingly dangerous, with the number of accidents reaching alarming highs. Human error is a major culprit, leading to mis-judgments and head-on crashes. Machine failure also plays a role, with faulty brakes or broken axles causing accidents. To address these concerns, governments are implementing stricter regulations. Autonomous vehicles offer a potential solution. Equipped with advanced driving assistance systems like navigation, lane management, and collision avoidance, these technologically advanced cars are interconnected with a central processing unit for smarter decision-making. This could significantly improve road safety compared to traditional vehicles.
-
Increased adoption of autonomous vehicles will create new jobs and boost industries like IT, technology, and electronics.
RESTRAINTS:
-
High costs of development and implementation hinder widespread adoption of autonomous vehicles.
-
Public concerns about safety and security of driverless vehicles need to be addressed for wider acceptance.
OPPORTUNITIES:
-
Autonomous vehicles, with their precise perception and reaction times, aim to drastically reduce accidents caused by human error.
Human error is a major reason for road accidents, and autonomous vehicles offer a promising solution. These self-driving cars are equipped with advanced technology that allows them to perceive their surroundings with incredible accuracy. Unlike human drivers who can be distracted or make mistakes in judgment, autonomous vehicles rely on a combination of sensors, cameras, and AI to create a real-time picture of the road. This precise perception translates into faster reaction times, enabling the car to make critical decisions about braking, steering, and acceleration in a fraction of a second. By eliminating human error from the equation, autonomous vehicles have the potential to revolutionize road safety and significantly reduce the number of accidents on our roads.
-
Self-driving cars offer mobility solutions for those unable to drive themselves, increasing independence for the elderly and disabled.
CHALLENGES:
-
The complex technology behind autonomous vehicles makes them expensive to produce, hindering widespread adoption.
-
Hackers targeting autonomous vehicles pose a major risk, requiring robust cybersecurity measures.
IMPACT OF RUSSIA-UKRAINE WAR
The war in Russia-Ukraine has impacted the Autonomous Vehicles (AV) market. Disruptions to the global supply chain, caused by sanctions and factory shutdowns, have limited access to crucial components like semiconductors, which are vital for the complex AI systems in autonomous vehicles. This shortage is expected to delay production timelines and potentially inflate costs by an estimated 10-15%. The war has diverted resources away from research and development in the AV sector, as both governments and private companies prioritize other critical areas. This slowdown could potentially push back the projected timeline for widespread adoption of autonomous vehicles by 1-2 years. These effects of the conflict are also impacting consumer confidence, with potential buyers hesitant to invest in new technology during a period of economic uncertainty. While the long-term impact of the war remains to be seen, it has undoubtedly created significant headwinds for the AV market in the short to medium term.
IMPACT OF ECONOMIC SLOWDOWN
An economic slowdown can disrupt the autonomous vehicle (AV) market. With limited budgets, consumer spending on high-tech vehicles like autonomous cars is likely to decrease. This could translate to a decline in sales of initial AV models, potentially falling short by 20%. Additionally, investor confidence might decreased, leading to reduced funding for AV development projects. This could delay the rollout of new technologies and features, impacting the overall timeline for widespread AV adoption. The slowdown might also affect job creation in the AV sector, as companies may re-evaluate staffing needs or postpone hiring plans. It could push AV companies to focus on cost-reduction strategies and develop more affordable AV models to cater to a budget-conscious market. This could lead to a faster shift towards ridesharing services utilizing autonomous vehicles, creating new business opportunities and potentially accelerating AV adoption in the long run.
KEY MARKET SEGMENTS:
By Level of Automation
-
Level 3
-
Level 4
-
Level 5
Level 3 is the dominating sub-segment in the Autonomous Vehicles Market by level of automation holding around 70-80% of market share due to its focus on advanced driver assistance systems (ADAS) that can handle specific driving tasks under certain conditions. Leading car manufacturers like Tesla and Mercedes-Benz are dominating this segment as they integrate ADAS features into their vehicles, offering a taste of autonomous driving while keeping the driver ultimately responsible.
By Application
-
Civil
-
Robo Taxi
-
Ride Share
-
Ride Hail
-
Self-Driving Truck
-
Self-Driving Bus
Robo-Taxis is the dominating sub-segment in the Autonomous Vehicles Market by application holding around 30% of market share due to its potential to disrupt the traditional taxi industry. Companies like Waymo and Cruise are leading the charge in developing robo-taxis, offering a convenient and potentially safer alternative to human-driven taxis.
By Component
-
Hardware
-
Software and Services
Hardware is the dominating sub-segment in the Autonomous Vehicles Market by component due to the established tech companies and automotive suppliers like NVIDIA, Bosch, and Continental. These companies are developing the critical hardware components like LiDAR, radar, and cameras that are essential for autonomous vehicles to perceive their surroundings.
REGIONAL ANALYSES
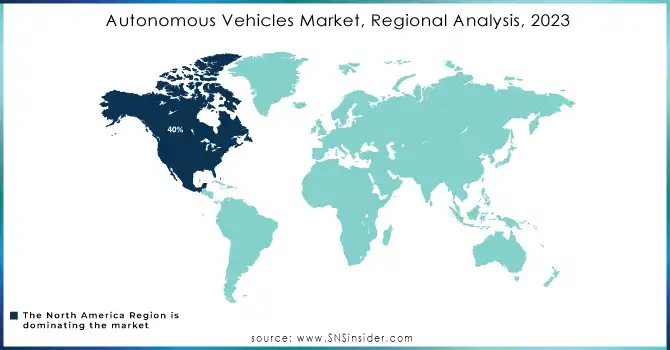
The North America is the dominating region in the Autonomous Vehicles Market holding 40% of market share due to a confluence of factors. Supportive regulations and the presence of tech hubs like Silicon Valley foster innovation and attract developers. A tech-savvy population readily embraces new technologies, while established car manufacturers like Tesla and Ford can quickly integrate autonomous features into existing models.
The Asia Pacific is the second highest region in this market. Dense urban areas with high disposable income create a strong demand for efficient transportation solutions, making autonomous vehicles particularly attractive.
Europe is the fastest growing region with the CAGR exceeding 25% driven by its focus on safety and efficiency in transportation. Well-developed infrastructure and a strong automotive industry with players like Mercedes-Benz actively investing in the technology position Europe for significant future growth.
Get Customized Report as per your Business Requirement - Request For Customized Report
REGIONAL COVERAGE:
North America
-
US
-
Canada
-
Mexico
Europe
-
Eastern Europe
-
Poland
-
Romania
-
Hungary
-
Turkey
-
Rest of Eastern Europe
-
-
Western Europe
-
Germany
-
France
-
UK
-
Italy
-
Spain
-
Netherlands
-
Switzerland
-
Austria
-
Rest of Western Europe
-
Asia Pacific
-
China
-
India
-
Japan
-
South Korea
-
Vietnam
-
Singapore
-
Australia
-
Rest of Asia Pacific
Middle East & Africa
-
Middle East
-
UAE
-
Egypt
-
Saudi Arabia
-
Qatar
-
Rest of the Middle East
-
-
Africa
-
Nigeria
-
South Africa
-
Rest of Africa
-
Latin America
-
Brazil
-
Argentina
-
Colombia
-
Rest of Latin America
KEY PLAYERS
The major key players are Audi AG, Google LLC, Honda Motor Co., Ltd.; Nissan Motors Co., Ltd., Tesla; Toyota Motor Corporation; Uber Technologies, BMW AG, Daimler AG, Ford Motor Company, General Motors, Robert Bosch GMBH, Aptiv, Continental AG, Denso Corporation, Volkswagen AG. and other key players.
RECENT DEVELOPMENT
-
In July 2023: Volkswagen and Mobileye are partnering to launch a self-driving program with 10 electric VW ID. Buzz vehicles. This program utilizes an autonomous driving system co-developed by both companies.
-
In August 2023: Toyota (through GTMC) will supply Pony.ai with specially designed electric vehicles for Level 4 self-driving car development. These vehicles will integrate Pony.ai's technology and operate on their robotaxi network.
| Report Attributes | Details |
|---|---|
| Market Size in 2023 | US$ 43.5 Billion |
| Market Size by 2032 | US$ 260.45 Billion |
| CAGR | CAGR of 22% From 2024 to 2032 |
| Base Year | 2023 |
| Forecast Period | 2024-2032 |
| Historical Data | 2020-2022 |
| Report Scope & Coverage | Market Size, Segments Analysis, Competitive Landscape, Regional Analysis, DROC & SWOT Analysis, Forecast Outlook |
| Key Segments | • By Level of Automation (Level 3, Level 4, Level 5) • By Application (Civil, Robo Taxi, Ride Share, Ride Hail, Self-Driving Truck, Self-Driving Bus) • By Component (Hardware, Software and Services) |
| Regional Analysis/Coverage | North America (US, Canada, Mexico), Europe (Eastern Europe [Poland, Romania, Hungary, Turkey, Rest of Eastern Europe] Western Europe] Germany, France, UK, Italy, Spain, Netherlands, Switzerland, Austria, Rest of Western Europe]), Asia Pacific (China, India, Japan, South Korea, Vietnam, Singapore, Australia, Rest of Asia Pacific), Middle East & Africa (Middle East [UAE, Egypt, Saudi Arabia, Qatar, Rest of Middle East], Africa [Nigeria, South Africa, Rest of Africa], Latin America (Brazil, Argentina, Colombia Rest of Latin America |
| Company Profiles | Audi AG, Google LLC, Honda Motor Co., Ltd.; Nissan Motor Company; Tesla; Toyota Motor Corporation; Uber Technologies, BMW AG, Daimler AG, Ford Motor Company, General Motors, Nissan Motors Co., Ltd., Tesla, Inc., Robert Bosch GMBH, Aptiv, Continental AG, Denso Corporation, Honda Motor Co., Ltd., Toyota Motor Corporation, and Volkswagen AG. |
| Key Drivers | • Increase in safety and traffic congestion reduction. • Expansion of interconnected infrastructure. |
| RESTRAINTS | • Significant manufacturing expenses. • Data management issues are limiting global market expansion. |
Frequently Asked Questions
North America region dominated the Autonomous Vehicles Market
The forecast period of Autonomous Vehicles Market is 2024-2031.
- The volume of data collected by autonomous vehicles necessitates a lot of computer power.
- Autonomous vehicle neural networks must be trained on representative datasets.
The market value of the Autonomous Vehicles Market is USD 43.5 billion in 2023.
Ans: The CAGR of the Autonomous Vehicles Market is 22% over the forecast period 2024-2031.
Get in Touch
