Service Integration and Management Market Report Scope & Overview:
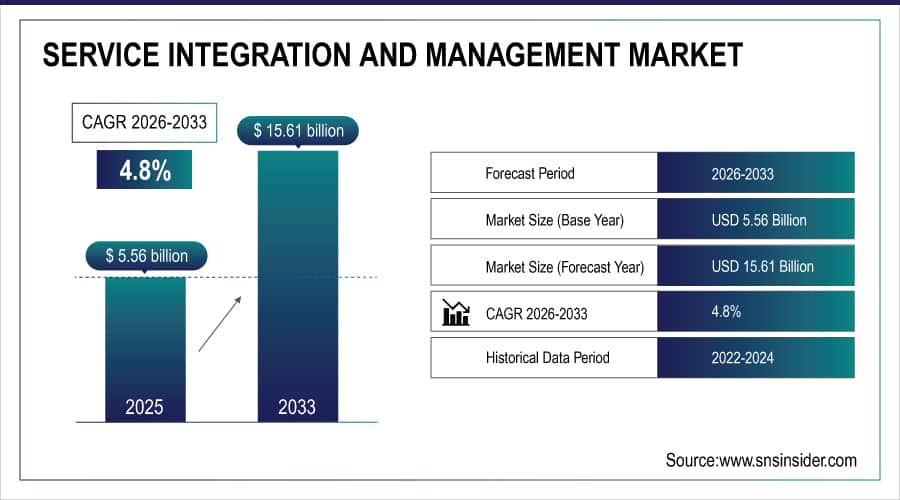
The Service Integration and Management Market Size was valued at USD 5.56 billion in 2025E and is expected to reach USD 15.61 billion by 2033 and grow at a CAGR of 4.8% over the forecast period 2026-2033.
The service integration and management market analysis highlight that enterprises seek to expand their service provider pools and gain the benefits of multi-vendor service models. SIAM allows for unified governance, easier collaboration, and effective integration of IT services from different providers. Accelerated by rapid digital transformation, increasing cloud adoption, and the demand for agility and speed of service, BFSI, IT & ITeS, manufacturing, and other organizations are gradually adopting the SIAM framework. Demand for improved operational control, risk mitigation, and transparency in service delivery will also continue to drive the market expansion. The Report breaks down market drivers, resistances, fashions, vendor landscapes, and the future opportunities in every single region and vertical where stakeholders are navigating the expanding SIAM ecosystem could benefit from greater strategic direction.
To Get More Information On Service Integration and Management Market - Request Free Sample Report
Service Integration and Management Market Size and Forecast:
-
Market Size in 2025E: USD 5.56 Billion
-
Market Size by 2033: USD 8.11 Billion
-
CAGR: 4.8% from 2026 to 2033
-
Base Year: 2025
-
Forecast Period: 2026–2033
-
Historical Data: 2022–2024
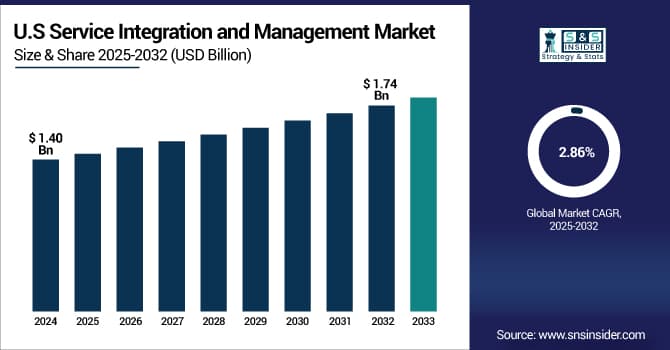
The U.S. Service Integration and Management Market size was USD 1.40 billion in 2024 and is expected to reach USD 1.74 billion by 2032, growing at a CAGR of 2.86% over the forecast period. The U.S. market is expected to be fueled by the increasing need for efficient multi-vendor management and digital transformation initiatives across industry verticals. The need for IT service delivery management and reduced operational complexities drives SIAM awareness among organizations. High presence of leading technology vendors, early cloud service adoption, and enterprise automation investment drives the dominant share of North America, particularly the U.S. Furthermore, stringent regulatory compliance mandates instigate high adoption of enterprise SIAM frameworks for efficient governance and risk mitigation.
Service Integration and Management Market Key Drivers:
-
Growing Demand for Efficient Multi-Vendor Management and Digital Transformation Accelerates Service Integration and Management Market Growth
The SIAM market is driven by the rising need for organizations to manage increasingly complex IT environments involving multiple service providers efficiently. Enterprises are undertaking digital transformation initiatives to improve agility, reduce operational costs, and enhance customer experience. SIAM provides a structured framework to integrate and govern diverse service providers, ensuring seamless collaboration and service delivery.
A recent development reflecting this trend is IBM’s acquisition of Software AG’s integration platforms in December 2023, aimed at strengthening hybrid cloud and AI-driven service integration capabilities. This acquisition underscores the growing emphasis on unified service management solutions that help enterprises streamline operations, improve transparency, and reduce risks. As organizations face growing pressures to optimize IT investments while maintaining service quality, SIAM adoption continues to expand across industries, such as BFSI, manufacturing, and IT & ITeS, fueling market growth.
Service Integration and Management Market Restraints:
-
Complexity in Implementing SIAM Frameworks Limits Market Growth Due to Organizational and Technical Challenges
Despite its benefits, there are complexities in implementing and managing multi-vendor environments. Establishing standardized governance, aligning diverse service providers, and integrating legacy systems can be daunting for many enterprises. The need for skilled resources, change management, and continuous monitoring further complicates deployments. Many organizations struggle with the upfront costs and the time required to achieve measurable benefits from SIAM adoption.
Additionally, inconsistent service level agreements (SLAs) and potential conflicts among vendors add to the challenge. These factors slow down market penetration, especially among small and medium enterprises lacking mature IT processes. As a result, while demand is growing, the complexity of SIAM integration remains a significant barrier that vendors and customers must navigate carefully.
Service Integration and Management Market Opportunities:
-
Expanding Cloud Adoption and Hybrid IT Environments Create New Growth Opportunities in the Service Integration and Management Market
The expanding adoption of cloud computing and hybrid IT environments presents a significant opportunity for the SIAM market, as enterprises increasingly require seamless integration across on-premises and cloud services. The ability to manage service providers in multi-cloud ecosystems, while ensuring consistent governance and security, drives demand for advanced SIAM solutions. A recent development highlighting this opportunity is HCLTech’s launch of its 5G System Integration Framework and CloudSMART Modernization Experience in February 2023, which targets enhanced service integration for cloud and telecom environments. This reflects the growing trend of leveraging SIAM for complex, multi-vendor cloud deployments. As organizations prioritize cloud-first strategies and digital agility, SIAM providers can capitalize on this shift by offering tailored solutions that simplify service integration, improve scalability, and enhance operational efficiency.
Service Integration and Management Market Challenges:
-
Managing Vendor Accountability and Ensuring Service Quality Remains a Critical Challenge in Service Integration and Management
A major challenge in the SIAM market is maintaining clear accountability and consistent service quality across multiple service providers. Coordinating diverse vendors with different processes, priorities, and technologies often leads to communication gaps, service overlaps, or conflicts, impacting overall service delivery. Ensuring end-to-end visibility into performance metrics and compliance is complex but essential to avoid service disruptions and meet business objectives. Organizations must implement robust governance models and real-time monitoring tools to mitigate risks and enforce SLAs effectively. Failure to do so can result in delayed issue resolution, increased operational costs, and reduced customer satisfaction. Addressing these challenges requires continuous collaboration, strong leadership, and technological investment, which remain ongoing hurdles for widespread SIAM adoption.
Service Integration and Management Market Segmentation Analysis:
By Component: Services Segment Dominates While Solutions Segment Experiences Rapid Growth
The Services segment dominates the SIAM market with 59% revenue share in 2025, driven by rising demand for integration, consulting, and managed services. Leading companies including Infosys and Wipro have recently launched advanced SIAM consulting and managed service offerings to support enterprises in multi-vendor governance and digital transformation. These service-led innovations enable seamless coordination among providers, reducing complexity and improving service delivery. The focus on expert integration and continuous monitoring strongly correlates with increasing SIAM adoption across industries globally.
The Solutions segment in the SIAM market is growing rapidly at a CAGR of 7.9%, fueled by the increasing adoption of automation and AI-enabled platforms. Companies including IBM and HCLTech have launched new SIAM orchestration tools and AI-driven dashboards to simplify vendor management and enhance service transparency. These product developments enable real-time analytics and proactive issue resolution, driving market expansion. The surge in digital transformation initiatives amplifies demand for robust SIAM solutions to unify complex IT ecosystems effectively.
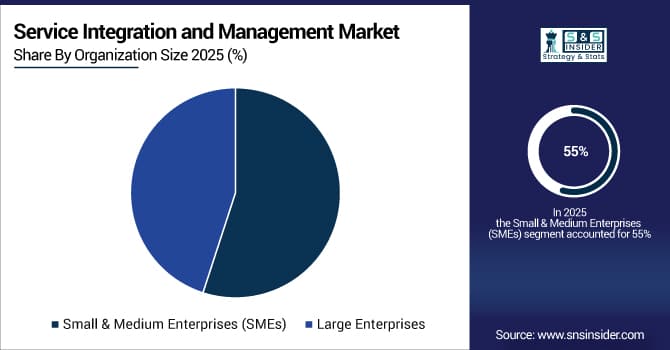
By Organization Size: SMEs Lead in Revenue Share, Large Enterprises Show Fastest Growth
Small and Medium Enterprises (SMEs) account for 55% of the SIAM market revenue in 2025, benefiting from affordable, scalable SIAM service packages tailored to their multi-vendor needs. Firms, such as LTIMindtree have introduced cloud-based SIAM platforms optimized for SMEs, offering flexible deployment and simplified governance. The increasing digitalization of SMEs fuels demand for efficient service integration to optimize resources and enhance operational control, reinforcing the segment’s significant market share and steady growth within the evolving SIAM landscape.
Large Enterprises segment is experiencing the fastest SIAM market growth at a CAGR of 6.28%, driven by complex IT environments requiring robust integration frameworks. Leading players, such as TCS and Atos have launched enterprise-grade SIAM solutions incorporating AI, automation, and hybrid cloud capabilities to improve service quality and reduce risks. These innovations cater to large organizations' demands for scalable, secure, and compliant multi-vendor management, aligning closely with the rising adoption of SIAM in large-scale digital transformation projects.
By Vertical: IT & ITeS Drives Market Share, Manufacturing Shows Highest Growth Potential
The IT & ITeS vertical leads the SIAM market with a 50% revenue share in 2025, supported by continuous innovations in service orchestration and automation. Companies including CGI and Fujitsu have introduced specialized SIAM solutions tailored to IT service providers, enhancing multi-vendor collaboration and delivery efficiency. The high dependency on integrated service management within this vertical drive’s widespread adoption, reflecting its critical role in enabling agile, transparent, and scalable IT operations globally.
The Manufacturing vertical is projected to grow at the highest CAGR of 6.77% in the SIAM market in the forecasted period 2026-2033, fueled by the increasing need for integrated IT and operational technology services. Companies including DXC Technology and IBM have developed SIAM-enabled platforms supporting smart factory and Industry 4.0 initiatives. These solutions help manufacturers manage diverse service providers, streamline operations, and enhance real-time monitoring, aligning with the sector’s digital transformation goals and driving accelerated SIAM adoption.
Service Integration and Management Market Regional Analysis:
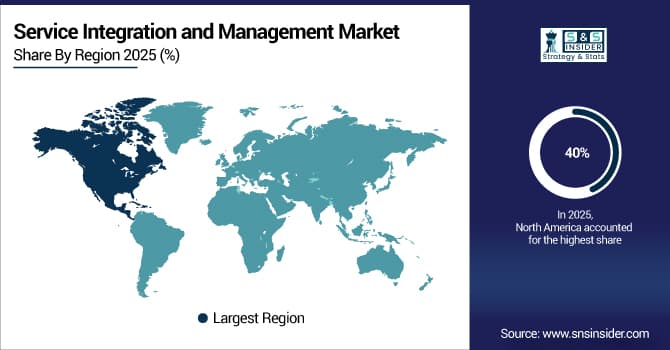
North America Leads SIAM Market with Strong Enterprise Adoption and Advanced IT Infrastructure
The North America region dominated the Service Integration and Management market share in 2025 with an estimated market share of approximately 40%. Advanced IT infrastructure and strong enterprise adoption drive robust SIAM market growth in North America. The U.S. is the dominant country in North America due to its mature digital ecosystem and presence of major SIAM service providers, such as IBM, TCS, and DXC Technology. The country’s leadership in cloud adoption, innovation in IT service management, and significant investments in digital transformation initiatives have propelled SIAM market expansion, enabling enterprises to manage multi-vendor environments efficiently.
Get Customized Report as Per Your Business Requirement - Enquiry Now
Asia Pacific Emerges as Fastest-Growing SIAM Market Driven by Digital Transformation
The Asia Pacific region is the fastest-growing region in the market in 2025, with an estimated CAGR of 7.2%. Rapid digital transformation and increasing cloud adoption fuel SIAM growth in Asia Pacific. India leads the Asia Pacific SIAM market, driven by its expanding IT & ITeS sector and growing demand for multi-vendor management services. Companies including Infosys, Wipro, and HCLTech are launching innovative SIAM platforms tailored for local enterprises. The country’s evolving digital infrastructure and government initiatives to boost IT modernization accelerate SIAM adoption across various sectors.
Europe Maintains Significant SIAM Market Share Fueled by Compliance and Mature IT Ecosystem
In 2025, Europe holds a significant share of the Service Integration and Management market, supported by stringent regulatory standards and a mature IT service ecosystem. Strong compliance requirements and digital innovation drive Europe’s SIAM market growth. The U.K. dominates the European SIAM market due to its advanced IT infrastructure, high cloud adoption rate, and robust financial services sector. UK enterprises increasingly invest in SIAM frameworks to ensure multi-vendor governance and risk mitigation, further strengthening the market’s position across the region.
MEA and Latin America Show Emerging SIAM Growth Amid Rising Digital Adoption
In 2025, the Middle East & Africa and Latin America regions show emerging growth in the Service Integration and Management (SIAM) market trends, driven by rising digital adoption and increasing IT investments. Both regions are witnessing growing interest from SMEs and the government sectors adopting SIAM to improve multi-vendor coordination and service delivery efficiency. Despite slower maturity compared to other regions, expanding cloud infrastructure and strategic partnerships with global SIAM vendors are paving the way for accelerated market penetration in the coming years.
Service Integration and Management Market Key Players:
-
Accenture
-
IBM Corporation
-
Capgemini SE
-
DXC Technology
-
Atos SE
-
Tata Consultancy Services (TCS)
-
HCL Technologies
-
Wipro Limited
-
Infosys Limited
-
Cognizant Technology Solutions
-
ServiceNow
-
Fujitsu Limited
-
CGI Inc.
-
Mindtree Limited
-
Orange Business Services
-
NTT DATA Corporation
-
Sopra Steria
-
Dimension Data (NTT)
-
Hewlett Packard Enterprise (HPE)
-
Oracle
Competitive Landscape for the Service Integration and Management Market:
Accenture
Accenture is a global professional services and consulting leader, providing end-to-end Service Integration and Management (SIAM) solutions. The company specializes in IT strategy, digital transformation, multi-vendor governance, and managed services. With decades of experience, Accenture helps enterprises design, implement, and optimize SIAM frameworks to improve service delivery, reduce complexity, and drive operational efficiency. Its role in the SIAM market is critical, as it enables organizations across industries to coordinate multiple service providers seamlessly while leveraging AI, automation, and cloud capabilities.
-
In 2025, Accenture expanded its SIAM offerings with advanced AI-driven orchestration tools and consulting packages, supporting large-scale enterprise multi-vendor environments and enhancing real-time analytics for proactive issue resolution.
IBM Corporation
IBM Corporation is a U.S.-based multinational technology and consulting firm offering comprehensive SIAM solutions. IBM focuses on IT service management, cloud integration, AI-enabled service orchestration, and vendor governance. Its extensive portfolio allows enterprises to unify complex IT ecosystems, streamline operations, and improve service transparency. IBM’s role in the SIAM market is significant, providing both consulting expertise and platform-driven solutions that simplify multi-vendor management.
-
In 2025, IBM launched new SIAM orchestration dashboards powered by AI, enabling real-time monitoring, automated workflows, and predictive analytics, strengthening enterprises’ ability to manage large-scale digital transformation initiatives.
Capgemini SE
Capgemini SE is a France-based global leader in consulting, technology services, and SIAM solutions. The company delivers managed SIAM services, IT integration, and process optimization, supporting enterprises in multi-vendor coordination and digital transformation. With a strong focus on innovation and cloud adoption, Capgemini enables seamless service delivery and governance across complex IT environments. Its role in the SIAM market is pivotal, helping organizations reduce operational risks while improving efficiency and service quality.
-
In 2025, Capgemini introduced enhanced SIAM consulting services and AI-powered automation platforms, allowing clients to achieve improved vendor performance, service visibility, and operational agility in multi-cloud and hybrid environments.
DXC Technology
DXC Technology is a U.S.-based IT services and consulting firm providing robust SIAM frameworks for global enterprises. The company specializes in multi-vendor management, IT service integration, and digital transformation consulting. DXC helps organizations streamline workflows, standardize processes, and coordinate diverse service providers efficiently. Its role in the SIAM market is essential, delivering scalable and secure solutions tailored for complex enterprise IT ecosystems.
-
In 2025, DXC Technology launched enterprise-grade SIAM platforms incorporating AI-driven dashboards, automation, and hybrid cloud support, enabling proactive issue resolution and enhanced service orchestration across multiple vendors.
| Report Attributes | Details |
|---|---|
| Market Size in 2025E | USD 5.56 Billion |
| Market Size by 2033 | USD 8.11 Billion |
| CAGR | CAGR of 4.8% From 2026 to 2033 |
| Base Year | 2025 |
| Forecast Period | 2026-2033 |
| Historical Data | 2022-2024 |
| Report Scope & Coverage | Market Size, Segments Analysis, Competitive Landscape, Regional Analysis, DROC & SWOT Analysis, Forecast Outlook |
| Key Segments | • By Component (Solutions [Business Solutions, Technology Solutions], Services [Integration & Implementation, Consulting]) • By Organization Size (Small & Medium Enterprises (SMEs), Large Enterprises) • By Vertical (Manufacturing, IT & ITeS, BFSI) |
| Regional Analysis/Coverage | North America (US, Canada, Mexico), Europe (Germany, France, UK, Italy, Spain, Poland, Turkey, Rest of Europe), Asia Pacific (China, India, Japan, South Korea, Singapore, Australia, Taiwan, Rest of Asia Pacific), Middle East & Africa (UAE, Saudi Arabia, Qatar, South Africa, Rest of Middle East & Africa), Latin America (Brazil, Argentina, Rest of Latin America) |
| Company Profiles |
Accenture, IBM Corporation, Capgemini SE, DXC Technology, Atos SE, Tata Consultancy Services (TCS), HCL Technologies, Wipro Limited, Infosys Limited, Cognizant Technology Solutions, ServiceNow, Fujitsu Limited, CGI Inc., Mindtree Limited, Orange Business Services, NTT DATA Corporation, Sopra Steria, Dimension Data (NTT), Hewlett Packard Enterprise (HPE), Oracle. |
Frequently Asked Questions
North America dominated the Service Integration and Management Market in 2025.
The IT & ITeS segment dominated the Service Integration and Management Market.
The major growth factor of the Service Integration and Management Market is the rising adoption of multi-vendor IT environments requiring centralized governance and seamless service delivery.
The Service Integration and Management Market Size was valued at USD 5.56 billion in 2025E and is expected to reach USD 15.61 billion by 2033 and grow at a CAGR of 4.8% over the forecast period 2026-2033.
The Service Integration and Management Market is expected to grow at a CAGR of 4.8% during 2026-2033.
Get in Touch
