image

Sharps Containers Market Report Scope & Overview:

Sharps Containers Market Revenue Analysis

To Get More Information on Sharps Containers Market - Request Sample Report

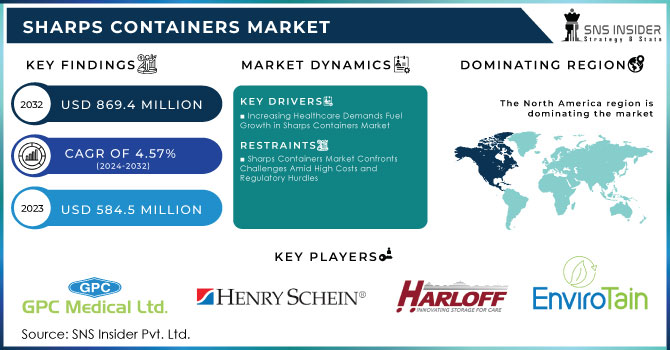
The Sharps Containers Market Size was valued at USD 584.5 Million in 2023 and is expected to reach USD 869.4 Million by 2032 and grow at a CAGR of 4.57% over the forecast period 2024-2032.

The sharps containers market is experiencing rapid growth due to the increasing demand for safe and efficient medical waste disposal solutions. Healthcare facilities, research institutions, and pharmaceutical companies generate significant amounts of medical waste, including sharp objects like needles, syringes, and lancets. These items pose a significant risk to human health and the environment if not disposed of properly. According to the CDC, approximately 385,000 healthcare workers in the United States experience needlestick and sharps-related injuries each year.

The escalating prevalence of Hospital-Acquired Infections (HAIs), primarily attributed to inadequate sanitation and safety measures, is a significant driver for the growth of the sharps container market. According to the CDC, a concerning one in 25 hospital patients is affected by at least one HAI annually. The proper disposal of medical waste in specialized containers plays a crucial role in preventing contamination and mitigating the risk of HAIs. By effectively managing medical waste, healthcare facilities can significantly reduce the spread of bacterial and microbial infections, thereby contributing to a safer patient environment.

The global surge in surgical procedures is another major factor driving the growth of the sharps container market. According to Mölnlycke Health Care AB, Europe alone witnesses an astonishing 70 million surgeries annually. The substantial amount of medical waste generated from these procedures necessitates proper disposal, increasing the demand for medical waste containers. In the United States, data from the Healthcare Cost and Utilization Project (HCUP) reveals that over 9.9 million surgeries were performed in ambulatory care settings in 2015 alone. The proper disposal of medical waste is essential to prevent the transmission of nosocomial infections, leading to a consistent preference among surgeons for specialized medical waste containers. These factors collectively contribute to the market's expansion.

Sharps containers play a crucial role in preventing accidental injuries and the spread of infectious diseases. These containers are designed to securely store and dispose of sharp medical waste, ensuring that it does not come into contact with individuals or the environment. The market for sharps containers is driven by several factors, including rising healthcare expenditure, stringent government regulations, and increased awareness about infectious diseases.

The sharps containers market is highly competitive, with a wide range of products available from various manufacturers. These containers vary in size, shape, and material, but they all share the common goal of providing a safe and effective solution for medical waste disposal. Recent advancements in the sharps containers market include the development of reusable containers, improved safety features, and the integration of smart technology.

In addition to technological advancements, there have been several recent developments in the regulatory landscape. Governments around the world are imposing stricter regulations on medical waste management to protect public health and the environment. These regulations include extended disposal timelines, free disposal programs, and government initiatives to improve medical waste management practices. In the United States, Michigan has extended the timeline for the disposal of sharps containers from 90 days to 18 months. Some communities have launched free sharps disposal programs to make it easier for residents to dispose of medical waste safely. Governments around the world are investing in infrastructure and education to improve medical waste management practices.

The sharps containers market is poised for continued growth as healthcare providers and governments prioritize safe and effective waste disposal solutions. The increasing demand for these products, coupled with advancements in technology and regulations, is expected to drive the market forward in the coming years.

BioMedical Waste Solutions offers a comprehensive guide to assist healthcare facilities and EMS professionals in the proper disposal of sharps and medical waste. The guide provides valuable information on best practices and regulations.

The Food and Drug Administration (FDA) in the United States provides comprehensive guidelines for the safe use and disposal of sharps. Similarly, the Centers for Disease Control and Prevention (CDC) offers recommendations on sharps disposal practices, tailored to healthcare facilities and individuals. At the global level, the World Health Organization (WHO) establishes guidelines for the safe management of healthcare waste, encompassing sharps disposal. Additionally, many countries have specific national or local health departments that regulate sharps disposal practices, ensuring adherence to local standards and requirements.

Market Dynamics

Drivers

  • Increasing Healthcare Demands Fuel Growth in Sharps Containers Market

The increasing demand for healthcare services, driven by rising healthcare expenditure, growing population, and aging demographics, is leading to a surge in the generation of medical waste, including sharps. Governments worldwide are imposing stricter regulations on medical waste management to protect public health and the environment, which is further driving the demand for safe and efficient disposal solutions. Moreover, the growing awareness of infectious diseases and the need for sustainable practices is increasing the demand for eco-friendly sharps containers.

Technological advancements, such as the development of reusable containers, improved safety features, and the integration of smart technology, are also contributing to the market's growth. Additionally, regulatory changes, including extended disposal timelines, free disposal programs, and government initiatives, are creating a favorable environment for the sharps containers market. These factors collectively highlight the increasing importance of safe and effective medical waste management and the growing demand for sharps containers.

Restraints

  • Sharps Containers Market Confronts Challenges Amid High Costs and Regulatory Hurdles

The sharps containers market faces several challenges, including high costs, lack of awareness, regulatory challenges, economic downturns, technological limitations, and environmental concerns. Overcoming these restraints requires investment in education, infrastructure, and sustainable practices to ensure safe and efficient medical waste disposal.

Key Segmentation

By Type

Multipurpose containers dominated the market in 2023 with a 54.02% share due to their versatility, availability in various sizes and shapes, and high demand from healthcare providers, research institutes, and hospitals.

While patient room containers and phlebotomy containers serve specific needs, multipurpose containers offer a more comprehensive solution for medical waste disposal, ensuring safety and environmental protection. This versatility, coupled with their reusability, is driving their market dominance and anticipated growth.

By Container Size

The 2-4-gallon segment, favored by healthcare professionals for its versatility in handling injections, cotton swabs, and laboratory waste, dominated the market in 2023 with a 46.03% share. Its vertical drop lid design facilitates safe and convenient disposal, making it a preferred choice in hospitals and research institutions.

While larger containers, such as 4-8 gallons and above, are primarily used in settings with higher waste generation, such as hospitals and pharmaceutical companies, the 2-4 and 4-8-gallon segments are projected to experience significant growth during the forecast period. Rising awareness about the importance of proper medical waste management and the increasing variety of options offered by manufacturers are key factors contributing to this anticipated expansion.

By Usage

Reusable containers dominated the market with a 74.33% share in 2023 and experienced the fastest growth rate during the forecast period. Their superior benefits, including safety, environmental friendliness, and cost-effectiveness, make them highly desirable for pharmaceutical companies, hospitals, and research institutions.

While single-use containers are primarily employed in facilities handling biohazardous waste, their growth is expected to remain steady. Their compact size and closed lids offer protection against infections, making them suitable for research institutes and pharmaceutical companies engaged in infection-driven research.

Regional Analysis

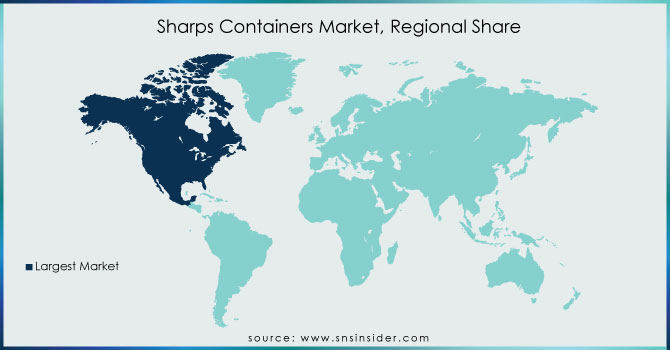
The sharps container market is dominated by North America with a 46.32% share in 2023, driven by stringent regulations, extensive distribution networks, and a strong focus on waste management. However, the Asia Pacific region is poised to experience the most rapid growth, fueled by significant investments in manufacturing and increasing compliance with regulatory guidelines.

Europe, while showing promising growth, faces challenges due to varying levels of guideline adherence and reliance on disposable bins in lower-income countries. Despite these hurdles, countries like Germany, the U.K., and Scandinavia are contributing to the region's expansion through advancements in supply chain management and awareness campaigns.

Sharps-Containers-Market-Regional-Share

Do You Need any Customization Research on Sharps Containers Market - Enquire Now

Key Players

The major players are GPC Medical, HenrySchein, Harloff, EnviroTain, BemishHealthcare, Cardinal Health, Becton, Dickinson and Company, BondTech Corporation, Stericycle, Thermo Fischer Scientific. and others the final reports list additional participants.

Recent Developments

In Jan 2024, Grundon, a waste management company, launched a new reusable sharps container service for the National Health Service (NHS). This initiative promotes sustainability and reduces waste.

In March 2024, Fire Prevention 24-7 in Naperville launched a free, safe, and convenient sharps disposal program. This initiative aims to reduce the risk of needlestick injuries and promote proper medical waste disposal practices.

Sharps Containers Market Report Scope:

Report Attributes Details
Market Size in 2023  US$ 584.5 Mn
Market Size by 2032  US$ 869.4 Mn
CAGR   CAGR of 4.57% From 2024 to 2032
Base Year  2023
Forecast Period  2024-2032
Historical Data  2020-2022
Report Scope & Coverage Market Size, Segments Analysis, Competitive  Landscape, Regional Analysis, DROC & SWOT Analysis, Forecast Outlook
Key Segments • By Type (Phlebotomy Containers, Patient Room Containers, Multipurpose Containers)
• By Container Size (1-2 Gallons, 2-4 Gallons, 4-8 Gallons)
• By Usage (Single-Use Containers, Reusable Containers)
Regional Analysis/Coverage North America (US, Canada, Mexico), Europe (Eastern Europe [Poland, Romania, Hungary, Turkey, Rest of Eastern Europe] Western Europe] Germany, France, UK, Italy, Spain, Netherlands, Switzerland, Austria, Rest of Western Europe]), Asia Pacific (China, India, Japan, South Korea, Vietnam, Singapore, Australia, Rest of Asia Pacific), Middle East & Africa (Middle East [UAE, Egypt, Saudi Arabia, Qatar, Rest of Middle East], Africa [Nigeria, South Africa, Rest of Africa], Latin America (Brazil, Argentina, Colombia, Rest of Latin America)
Company Profiles GPC Medical, HenrySchein, Harloff, EnviroTain, BemishHealthcare, Cardinal Health, Becton, Dickinson and Company, BondTech Corporation, Stericycle, Thermo Fischer Scientific.
Key Drivers • Increasing Healthcare Demands Fuel Growth in Sharps Containers Market
.
Market Opportunities • Sharps Containers Market Confronts Challenges Amid High Costs and Regulatory Hurdles


Frequently Asked Questions

Ans: The Sharps Containers Market size was valued at USD 584.5 Million in 2023

Ans: The Sharps Containers Market is to grow at 4.57% Over the Forecast Period 2024-2032.

Ans: The Sharps Containers Market is to Hit USD 869.4 Million by 2032.

Ans: Sharps contaminated with a patient's blood can spread more than 20 diseases, including hepatitis B and C and the human immunodeficiency virus (HIV).

Ans: The major key players are GPC Medical, HenrySchein, Harloff, EnviroTain, BemishHealthcare, Cardinal Health, Becton, Dickinson and Company, BondTech Corporation, Stericycle, Thermo Fischer Scientific. and others.

1. Introduction

1.1 Market Definition

1.2 Scope (Inclusion and Exclusions)

1.3 Research Assumptions

2. Executive Summary

2.1 Market Overview

2.2 Regional Synopsis

2.3 Competitive Summary

3. Research Methodology

3.1 Top-Down Approach

3.2 Bottom-up Approach

3.3. Data Validation

3.4 Primary Interviews

4. Market Dynamics Impact Analysis

4.1 Market Driving Factors Analysis

4.1.1 Drivers

4.1.2 Restraints

4.1.3 Opportunities

4.1.4 Challenges

4.2 PESTLE Analysis

4.3 Porter’s Five Forces Model

5. Statistical Insights and Trends Reporting

5.1 Incidence and Prevalence (2023)

5.2 Prescription Trends, (2023), by Region

5.3 Device Volume, by Region (2020-2032)

5.4 Healthcare Spending, by Region, (Government, Commercial, Private, Out-of-Pocket), 2023

6. Competitive Landscape

6.1 List of Major Companies, By Region

6.2 Market Share Analysis, By Region

6.3 Product Benchmarking

6.3.1 Product specifications and features

6.3.2 Pricing

6.4 Strategic Initiatives

6.4.1 Marketing and promotional activities

6.4.2 Distribution and Supply Chain Strategies

6.4.3 Expansion plans and new Product launches

6.4.4 Strategic partnerships and collaborations

6.5 Technological Advancements

6.6 Market Positioning and Branding

7. Sharps Containers Market Segmentation, by Type  

    1. Chapter Overview

     7.2 Phlebotomy Containers

              7.2.1 Phlebotomy Containers Market Trends Analysis (2020-2032)

7.2.2 Phlebotomy Containers Market Size Estimates and Forecasts to 2032 (USD Million)

7.3 Patient Room Containers

             7.3.1 Patient Room Containers Market Trends Analysis (2020-2032)

             7.3.2 Patient Room Containers Market Size Estimates and Forecasts to 2032 (USD Million)

     7.4 Multipurpose Containers

             7.4.1 Multipurpose Containers Market Trends Analysis (2020-2032)

             7.4.2 Multipurpose Containers Market Size Estimates and Forecasts to 2032 (USD Million)

8. Sharps Containers Market Segmentation, by Container Size

8.1 Chapter Overview

      8.2 1-2 Gallons

              8.2.1 1-2 Gallons Market Trends Analysis (2020-2032)

8.2.2 1-2 Gallons Market Size Estimates and Forecasts to 2032 (USD Million)

8.3 2-4 Gallons

              8.3.1 2-4 Gallons Market Trends Analysis (2020-2032)

       8.3.2 2-4 Gallons Market Size Estimates and Forecasts to 2032 (USD Million)

8.4 4-8 Gallons

             8.4.1 4-8 Gallons Market Trends Analysis (2020-2032)

8.4.2 4-8 Gallons Market Size Estimates and Forecasts to 2032 (USD Million)

9. Sharps Containers Market Segmentation, by Usage

9.1 Chapter Overview

9.2 Single-Use Containers

             9.2.1 Single-Use Containers Market Trends Analysis (2020-2032)

9.2.2 Single-Use Containers Market Size Estimates and Forecasts to 2032 (USD Million)

9.3 Reusable Containers

             9.3.1 Reusable Containers Market Trends Analysis (2020-2032)

             9.3.2 Reusable Containers Market Size Estimates and Forecasts to 2032 (USD Million)

10. Regional Analysis

10.1 Chapter Overview

10.2 North America

10.2.1 Trends Analysis

10.2.2 North America Sharps Containers Market Estimates and Forecasts, by Country (2020-2032) (USD Million)

10.2.3 North America Sharps Containers Market Estimates and Forecasts, by Type (2020-2032) (USD Million) 

10.2.4 North America Sharps Containers Market Estimates and Forecasts, by Container Size (2020-2032) (USD Million)

10.2.5 North America Sharps Containers Market Estimates and Forecasts, by Usage (2020-2032) (USD Million)

10.2.6 USA

10.2.6.1 USA Sharps Containers Market Estimates and Forecasts, by Type (2020-2032) (USD Million)

10.2.6.2 USA Sharps Containers Market Estimates and Forecasts, by Container Size (2020-2032) (USD Million)

10.2.6.3 USA Sharps Containers Market Estimates and Forecasts, by Usage (2020-2032) (USD Million)

10.2.7 Canada

10.2.7.1 Canada Sharps Containers Market Estimates and Forecasts, by Type (2020-2032) (USD Million)

10.2.7.2 Canada Sharps Containers Market Estimates and Forecasts, by Container Size (2020-2032) (USD Million)

10.2.7.3 Canada Sharps Containers Market Estimates and Forecasts, by Usage (2020-2032) (USD Million)

10.2.8 Mexico

10.2.8.1 Mexico Sharps Containers Market Estimates and Forecasts, by Type (2020-2032) (USD Million)

10.2.8.2 Mexico Sharps Containers Market Estimates and Forecasts, by Container Size (2020-2032) (USD Million)

10.2.8.3 Mexico Sharps Containers Market Estimates and Forecasts, by Usage (2020-2032) (USD Million)

10.3 Europe

10.3.1 Eastern Europe

10.3.1.1 Trends Analysis

10.3.1.2 Eastern Europe Sharps Containers Market Estimates and Forecasts, by Country (2020-2032) (USD Million)

10.3.1.3 Eastern Europe Sharps Containers Market Estimates and Forecasts, by Type (2020-2032) (USD Million) 

10.3.1.4 Eastern Europe Sharps Containers Market Estimates and Forecasts, by Container Size (2020-2032) (USD Million)

10.3.1.5 Eastern Europe Sharps Containers Market Estimates and Forecasts, by Usage (2020-2032) (USD Million)

10.3.1.6 Poland

10.3.1.6.1 Poland Sharps Containers Market Estimates and Forecasts, by Type (2020-2032) (USD Million)

10.3.1.6.2 Poland Sharps Containers Market Estimates and Forecasts, by Container Size (2020-2032) (USD Million)

10.3.1.6.3 Poland Sharps Containers Market Estimates and Forecasts, by Usage (2020-2032) (USD Million)

10.3.1.7 Romania

10.3.1.7.1 Romania Sharps Containers Market Estimates and Forecasts, by Type (2020-2032) (USD Million)

10.3.1.7.2 Romania Sharps Containers Market Estimates and Forecasts, by Container Size (2020-2032) (USD Million)

10.3.1.7.3 Romania Sharps Containers Market Estimates and Forecasts, by Usage (2020-2032) (USD Million)

10.3.1.8 Hungary

10.3.1.8.1 Hungary Sharps Containers Market Estimates and Forecasts, by Type (2020-2032) (USD Million)

10.3.1.8.2 Hungary Sharps Containers Market Estimates and Forecasts, by Container Size (2020-2032) (USD Million)

10.3.1.8.3 Hungary Sharps Containers Market Estimates and Forecasts, by Usage (2020-2032) (USD Million)

10.3.1.9 turkey

10.3.1.9.1 Turkey Sharps Containers Market Estimates and Forecasts, by Type (2020-2032) (USD Million)

10.3.1.9.2 Turkey Sharps Containers Market Estimates and Forecasts, by Container Size (2020-2032) (USD Million)

10.3.1.9.3 Turkey Sharps Containers Market Estimates and Forecasts, by Usage (2020-2032) (USD Million)

10.3.1.10 Rest of Eastern Europe

10.3.1.10.1 Rest of Eastern Europe Sharps Containers Market Estimates and Forecasts, by Type (2020-2032) (USD Million)

10.3.1.10.2 Rest of Eastern Europe Sharps Containers Market Estimates and Forecasts, by Container Size (2020-2032) (USD Million)

10.3.1.10.3 Rest of Eastern Europe Sharps Containers Market Estimates and Forecasts, by Usage (2020-2032) (USD Million)

10.3.2 Western Europe

10.3.2.1 Trends Analysis

10.3.2.2 Western Europe Sharps Containers Market Estimates and Forecasts, by Country (2020-2032) (USD Million)

10.3.2.3 Western Europe Sharps Containers Market Estimates and Forecasts, by Type (2020-2032) (USD Million) 

10.3.2.4 Western Europe Sharps Containers Market Estimates and Forecasts, by Container Size (2020-2032) (USD Million)

10.3.2.5 Western Europe Sharps Containers Market Estimates and Forecasts, by Usage (2020-2032) (USD Million)

10.3.2.6 Germany

10.3.2.6.1 Germany Sharps Containers Market Estimates and Forecasts, by Type (2020-2032) (USD Million)

10.3.2.6.2 Germany Sharps Containers Market Estimates and Forecasts, by Container Size (2020-2032) (USD Million)

10.3.2.6.3 Germany Sharps Containers Market Estimates and Forecasts, by Usage (2020-2032) (USD Million)

10.3.2.7 France

10.3.2.7.1 France Sharps Containers Market Estimates and Forecasts, by Type (2020-2032) (USD Million)

10.3.2.7.2 France Sharps Containers Market Estimates and Forecasts, by Container Size (2020-2032) (USD Million)

10.3.2.7.3 France Sharps Containers Market Estimates and Forecasts, by Usage (2020-2032) (USD Million)

10.3.2.8 UK

10.3.2.8.1 UK Sharps Containers Market Estimates and Forecasts, by Type (2020-2032) (USD Million)

10.3.2.8.2 UK Sharps Containers Market Estimates and Forecasts, by Container Size (2020-2032) (USD Million)

10.3.2.8.3 UK Sharps Containers Market Estimates and Forecasts, by Usage (2020-2032) (USD Million)

10.3.2.9 Italy

10.3.2.9.1 Italy Sharps Containers Market Estimates and Forecasts, by Type (2020-2032) (USD Million)

10.3.2.9.2 Italy Sharps Containers Market Estimates and Forecasts, by Container Size (2020-2032) (USD Million)

10.3.2.9.3 Italy Sharps Containers Market Estimates and Forecasts, by Usage (2020-2032) (USD Million)

10.3.2.10 Spain

10.3.2.10.1 Spain Sharps Containers Market Estimates and Forecasts, by Type (2020-2032) (USD Million)

10.3.2.10.2 Spain Sharps Containers Market Estimates and Forecasts, by Container Size (2020-2032) (USD Million)

10.3.2.10.3 Spain Sharps Containers Market Estimates and Forecasts, by Usage (2020-2032) (USD Million)

10.3.2.11 Netherlands

10.3.2.11.1 Netherlands Sharps Containers Market Estimates and Forecasts, by Type (2020-2032) (USD Million)

10.3.2.11.2 Netherlands Sharps Containers Market Estimates and Forecasts, by Container Size (2020-2032) (USD Million)

10.3.2.11.3 Netherlands Sharps Containers Market Estimates and Forecasts, by Usage (2020-2032) (USD Million)

10.3.2.12 Switzerland

10.3.2.12.1 Switzerland Sharps Containers Market Estimates and Forecasts, by Type (2020-2032) (USD Million)

10.3.2.12.2 Switzerland Sharps Containers Market Estimates and Forecasts, by Container Size (2020-2032) (USD Million)

10.3.2.12.3 Switzerland Sharps Containers Market Estimates and Forecasts, by Usage (2020-2032) (USD Million)

10.3.2.13 Austria

10.3.2.13.1 Austria Sharps Containers Market Estimates and Forecasts, by Type (2020-2032) (USD Million)

10.3.2.13.2 Austria Sharps Containers Market Estimates and Forecasts, by Container Size (2020-2032) (USD Million)

10.3.2.13.3 Austria Sharps Containers Market Estimates and Forecasts, by Usage (2020-2032) (USD Million)

10.3.2.14 Rest of Western Europe

10.3.2.14.1 Rest of Western Europe Sharps Containers Market Estimates and Forecasts, by Type (2020-2032) (USD Million)

10.3.2.14.2 Rest of Western Europe Sharps Containers Market Estimates and Forecasts, by Container Size (2020-2032) (USD Million)

10.3.2.14.3 Rest of Western Europe Sharps Containers Market Estimates and Forecasts, by Usage (2020-2032) (USD Million)

10.4 Asia Pacific

10.4.1 Trends Analysis

10.4.2 Asia Pacific Sharps Containers Market Estimates and Forecasts, by Country (2020-2032) (USD Million)

10.4.3 Asia Pacific Sharps Containers Market Estimates and Forecasts, by Type (2020-2032) (USD Million) 

10.4.4 Asia Pacific Sharps Containers Market Estimates and Forecasts, by Container Size (2020-2032) (USD Million)

10.4.5 Asia Pacific Sharps Containers Market Estimates and Forecasts, by Usage (2020-2032) (USD Million)

10.4.6 China

10.4.6.1 China Sharps Containers Market Estimates and Forecasts, by Type (2020-2032) (USD Million)

10.4.6.2 China Sharps Containers Market Estimates and Forecasts, by Container Size (2020-2032) (USD Million)

10.4.6.3 China Sharps Containers Market Estimates and Forecasts, by Usage (2020-2032) (USD Million)

10.4.7 India

10.4.7.1 India Sharps Containers Market Estimates and Forecasts, by Type (2020-2032) (USD Million)

10.4.7.2 India Sharps Containers Market Estimates and Forecasts, by Container Size (2020-2032) (USD Million)

10.4.7.3 India Sharps Containers Market Estimates and Forecasts, by Usage (2020-2032) (USD Million)

10.4.8 Japan

10.4.8.1 Japan Sharps Containers Market Estimates and Forecasts, by Type (2020-2032) (USD Million)

10.4.8.2 Japan Sharps Containers Market Estimates and Forecasts, by Container Size (2020-2032) (USD Million)

10.4.8.3 Japan Sharps Containers Market Estimates and Forecasts, by Usage (2020-2032) (USD Million)

10.4.9 South Korea

10.4.9.1 South Korea Sharps Containers Market Estimates and Forecasts, by Type (2020-2032) (USD Million)

10.4.9.2 South Korea Sharps Containers Market Estimates and Forecasts, by Container Size (2020-2032) (USD Million)

10.4.9.3 South Korea Sharps Containers Market Estimates and Forecasts, by Usage (2020-2032) (USD Million)

10.4.10 Vietnam

10.4.10.1 Vietnam Sharps Containers Market Estimates and Forecasts, by Type (2020-2032) (USD Million)

10.4.10.2 Vietnam Sharps Containers Market Estimates and Forecasts, by Container Size (2020-2032) (USD Million)

10.4.10.3 Vietnam Sharps Containers Market Estimates and Forecasts, by Usage (2020-2032) (USD Million)

10.4.11 Singapore

10.4.11.1 Singapore Sharps Containers Market Estimates and Forecasts, by Type (2020-2032) (USD Million)

10.4.11.2 Singapore Sharps Containers Market Estimates and Forecasts, by Container Size (2020-2032) (USD Million)

10.4.11.3 Singapore Sharps Containers Market Estimates and Forecasts, by Usage (2020-2032) (USD Million)

10.4.12 Australia

10.4.12.1 Australia Sharps Containers Market Estimates and Forecasts, by Type (2020-2032) (USD Million)

10.4.12.2 Australia Sharps Containers Market Estimates and Forecasts, by Container Size (2020-2032) (USD Million)

10.4.12.3 Australia Sharps Containers Market Estimates and Forecasts, by Usage (2020-2032) (USD Million)

10.4.13 Rest of Asia Pacific

10.4.13.1 Rest of Asia Pacific Sharps Containers Market Estimates and Forecasts, by Type (2020-2032) (USD Million)

10.4.13.2 Rest of Asia Pacific Sharps Containers Market Estimates and Forecasts, by Container Size (2020-2032) (USD Million)

10.4.13.3 Rest of Asia Pacific Sharps Containers Market Estimates and Forecasts, by Usage (2020-2032) (USD Million)

10.5 Middle East and Africa

10.5.1 Middle East

10.5.1.1 Trends Analysis

10.5.1.2 Middle East Sharps Containers Market Estimates and Forecasts, by Country (2020-2032) (USD Million)

10.5.1.3 Middle East Sharps Containers Market Estimates and Forecasts, by Type (2020-2032) (USD Million) 

10.5.1.4 Middle East Sharps Containers Market Estimates and Forecasts, by Container Size (2020-2032) (USD Million)

10.5.1.5 Middle East Sharps Containers Market Estimates and Forecasts, by Usage (2020-2032) (USD Million)

10.5.1.6 UAE

10.5.1.6.1 UAE Sharps Containers Market Estimates and Forecasts, by Type (2020-2032) (USD Million)

10.5.1.6.2 UAE Sharps Containers Market Estimates and Forecasts, by Container Size (2020-2032) (USD Million)

10.5.1.6.3 UAE Sharps Containers Market Estimates and Forecasts, by Usage (2020-2032) (USD Million)

10.5.1.7 Egypt

10.5.1.7.1 Egypt Sharps Containers Market Estimates and Forecasts, by Type (2020-2032) (USD Million)

10.5.1.7.2 Egypt Sharps Containers Market Estimates and Forecasts, by Container Size (2020-2032) (USD Million)

10.5.1.7.3 Egypt Sharps Containers Market Estimates and Forecasts, by Usage (2020-2032) (USD Million)

10.5.1.8 Saudi Arabia

10.5.1.8.1 Saudi Arabia Sharps Containers Market Estimates and Forecasts, by Type (2020-2032) (USD Million)

10.5.1.8.2 Saudi Arabia Sharps Containers Market Estimates and Forecasts, by Container Size (2020-2032) (USD Million)

10.5.1.8.3 Saudi Arabia Sharps Containers Market Estimates and Forecasts, by Usage (2020-2032) (USD Million)

10.5.1.9 Qatar

10.5.1.9.1 Qatar Sharps Containers Market Estimates and Forecasts, by Type (2020-2032) (USD Million)

10.5.1.9.2 Qatar Sharps Containers Market Estimates and Forecasts, by Container Size (2020-2032) (USD Million)

10.5.1.9.3 Qatar Sharps Containers Market Estimates and Forecasts, by Usage (2020-2032) (USD Million)

10.5.1.10 Rest of Middle East

10.5.1.10.1 Rest of Middle East Sharps Containers Market Estimates and Forecasts, by Type (2020-2032) (USD Million)

10.5.1.10.2 Rest of Middle East Sharps Containers Market Estimates and Forecasts, by Container Size (2020-2032) (USD Million)

10.5.1.10.3 Rest of Middle East Sharps Containers Market Estimates and Forecasts, by Usage (2020-2032) (USD Million)

10.5.2 Africa

10.5.2.1 Trends Analysis

10.5.2.2 Africa Sharps Containers Market Estimates and Forecasts, by Country (2020-2032) (USD Million)

10.5.2.3 Africa Sharps Containers Market Estimates and Forecasts, by Type (2020-2032) (USD Million) 

10.5.2.4 Africa Sharps Containers Market Estimates and Forecasts, by Container Size (2020-2032) (USD Million)

10.5.2.5 Africa Sharps Containers Market Estimates and Forecasts, by Usage (2020-2032) (USD Million)

10.5.2.6 South Africa

10.5.2.6.1 South Africa Sharps Containers Market Estimates and Forecasts, by Type (2020-2032) (USD Million)

10.5.2.6.2 South Africa Sharps Containers Market Estimates and Forecasts, by Container Size (2020-2032) (USD Million)

10.5.2.6.3 South Africa Sharps Containers Market Estimates and Forecasts, by Usage (2020-2032) (USD Million)

10.5.2.7 Nigeria

10.5.2.7.1 Nigeria Sharps Containers Market Estimates and Forecasts, by Type (2020-2032) (USD Million)

10.5.2.7.2 Nigeria Sharps Containers Market Estimates and Forecasts, by Container Size (2020-2032) (USD Million)

10.5.2.7.3 Nigeria Sharps Containers Market Estimates and Forecasts, by Usage (2020-2032) (USD Million)

10.5.2.8 Rest of Africa

10.5.2.8.1 Rest of Africa Sharps Containers Market Estimates and Forecasts, by Type (2020-2032) (USD Million)

10.5.2.8.2 Rest of Africa Sharps Containers Market Estimates and Forecasts, by Container Size (2020-2032) (USD Million)

10.5.2.8.3 Rest of Africa Sharps Containers Market Estimates and Forecasts, by Usage (2020-2032) (USD Million)

10.6 Latin America

10.6.1 Trends Analysis

10.6.2 Latin America Sharps Containers Market Estimates and Forecasts, by Country (2020-2032) (USD Million)

10.6.3 Latin America Sharps Containers Market Estimates and Forecasts, by Type (2020-2032) (USD Million) 

10.6.4 Latin America Sharps Containers Market Estimates and Forecasts, by Container Size (2020-2032) (USD Million)

10.6.5 Latin America Sharps Containers Market Estimates and Forecasts, by Usage (2020-2032) (USD Million)

10.6.6 Brazil

10.6.6.1 Brazil Sharps Containers Market Estimates and Forecasts, by Type (2020-2032) (USD Million)

10.6.6.2 Brazil Sharps Containers Market Estimates and Forecasts, by Container Size (2020-2032) (USD Million)

10.6.6.3 Brazil Sharps Containers Market Estimates and Forecasts, by Usage (2020-2032) (USD Million)

10.6.7 Argentina

10.6.7.1 Argentina Sharps Containers Market Estimates and Forecasts, by Type (2020-2032) (USD Million)

10.6.7.2 Argentina Sharps Containers Market Estimates and Forecasts, by Container Size (2020-2032) (USD Million)

10.6.7.3 Argentina Sharps Containers Market Estimates and Forecasts, by Usage (2020-2032) (USD Million)

10.6.8 Colombia

10.6.8.1 Colombia Sharps Containers Market Estimates and Forecasts, by Type (2020-2032) (USD Million)

10.6.8.2 Colombia Sharps Containers Market Estimates and Forecasts, by Container Size (2020-2032) (USD Million)

10.6.8.3 Colombia Sharps Containers Market Estimates and Forecasts, by Usage (2020-2032) (USD Million)

10.6.9 Rest of Latin America

10.6.9.1 Rest of Latin America Sharps Containers Market Estimates and Forecasts, by Type (2020-2032) (USD Million)

10.6.9.2 Rest of Latin America Sharps Containers Market Estimates and Forecasts, by Container Size (2020-2032) (USD Million)

10.6.9.3 Rest of Latin America Sharps Containers Market Estimates and Forecasts, by Usage (2020-2032) (USD Million)

11. Company Profiles

11.1 GPC Medical

11.1.1 Company Overview

11.1.2 Financial

11.1.3 Product / Services Offered

11.1.4 SWOT Analysis

11.2 HenrySchein

11.2.1 Company Overview

11.2.2 Financial

11.2.3 Product / Services Offered

11.2.4 SWOT Analysis

11.3 Harloff

11.3.1 Company Overview

11.3.2 Financial

11.3.3 Product / Services Offered

11.3.4 SWOT Analysis

11.4 EnviroTain

11.4.1 Company Overview

11.4.2 Financial

11.4.3 Product / Services Offered

11.4.4 SWOT Analysis

11.5 BemishHealthcare

11.5.1 Company Overview

11.5.2 Financial

11.5.3 Product / Services Offered

11.5.4 SWOT Analysis

11.6 Cardinal Health

11.6.1 Company Overview

11.6.2 Financial

11.6.3 Product / Services Offered

11.6.4 SWOT Analysis

11.7 Becton, Dickinson, and Company

11.7.1 Company Overview

11.7.2 Financial

11.7.3 Product / Services Offered

11.7.4 SWOT Analysis

11.8  BondTech Corporation

11.8.1 Company Overview

11.8.2 Financial

11.8.3 Product / Services Offered

11.8.4 SWOT Analysis

11.9 Stericycle

11.9.1 Company Overview

11.9.2 Financial

11.9.3 Product / Services Offered

11.9.4 SWOT Analysis

11.10 Thermo Fischer Scientific

11.10.1 Company Overview

11.10.2 Financial

11.10.3 Product / Services Offered

11.10.4 SWOT Analysis

12. Use Cases and Best Practices

13. Conclusion


An accurate research report requires proper strategizing as well as implementation. There are multiple factors involved in the completion of good and accurate research report and selecting the best methodology to compete the research is the toughest part. Since the research reports we provide play a crucial role in any company’s decision-making process, therefore we at SNS Insider always believe that we should choose the best method which gives us results closer to reality. This allows us to reach at a stage wherein we can provide our clients best and accurate investment to output ratio.

Each report that we prepare takes a timeframe of 350-400 business hours for production. Starting from the selection of titles through a couple of in-depth brain storming session to the final QC process before uploading our titles on our website we dedicate around 350 working hours. The titles are selected based on their current market cap and the foreseen CAGR and growth.


The 5 steps process:

Step 1: Secondary Research:

Secondary Research or Desk Research is as the name suggests is a research process wherein, we collect data through the readily available information. In this process we use various paid and unpaid databases which our team has access to and gather data through the same. This includes examining of listed companies’ annual reports, Journals, SEC filling etc. Apart from this our team has access to various associations across the globe across different industries. Lastly, we have exchange relationships with various university as well as individual libraries.

Secondary Research

Step 2: Primary Research

When we talk about primary research, it is a type of study in which the researchers collect relevant data samples directly, rather than relying on previously collected data.  This type of research is focused on gaining content specific facts that can be sued to solve specific problems. Since the collected data is fresh and first hand therefore it makes the study more accurate and genuine.

We at SNS Insider have divided Primary Research into 2 parts.

Part 1 wherein we interview the KOLs of major players as well as the upcoming ones across various geographic regions. This allows us to have their view over the market scenario and acts as an important tool to come closer to the accurate market numbers. As many as 45 paid and unpaid primary interviews are taken from both the demand and supply side of the industry to make sure we land at an accurate judgement and analysis of the market.

This step involves the triangulation of data wherein our team analyses the interview transcripts, online survey responses and observation of on filed participants. The below mentioned chart should give a better understanding of the part 1 of the primary interview.

Primary Research

Part 2: In this part of primary research the data collected via secondary research and the part 1 of the primary research is validated with the interviews from individual consultants and subject matter experts.

Consultants are those set of people who have at least 12 years of experience and expertise within the industry whereas Subject Matter Experts are those with at least 15 years of experience behind their back within the same space. The data with the help of two main processes i.e., FGDs (Focused Group Discussions) and IDs (Individual Discussions). This gives us a 3rd party nonbiased primary view of the market scenario making it a more dependable one while collation of the data pointers.

Step 3: Data Bank Validation

Once all the information is collected via primary and secondary sources, we run that information for data validation. At our intelligence centre our research heads track a lot of information related to the market which includes the quarterly reports, the daily stock prices, and other relevant information. Our data bank server gets updated every fortnight and that is how the information which we collected using our primary and secondary information is revalidated in real time.

Data Bank Validation

Step 4: QA/QC Process

After all the data collection and validation our team does a final level of quality check and quality assurance to get rid of any unwanted or undesired mistakes. This might include but not limited to getting rid of the any typos, duplication of numbers or missing of any important information. The people involved in this process include technical content writers, research heads and graphics people. Once this process is completed the title gets uploader on our platform for our clients to read it.

Step 5: Final QC/QA Process:

This is the last process and comes when the client has ordered the study. In this process a final QA/QC is done before the study is emailed to the client. Since we believe in giving our clients a good experience of our research studies, therefore, to make sure that we do not lack at our end in any way humanly possible we do a final round of quality check and then dispatch the study to the client.

Key Segments:

By Type

  • Phlebotomy Containers

  • Patient Room Containers

  • Multipurpose Containers

By Container Size

  • 1-2 Gallons

  • 2-4 Gallons

  • 4-8 Gallons

By Usage

  • Single-Use Containers

  • Reusable Containers

Request for Segment Customization as per your Business Requirement: Segment Customization Request

Regional Coverage:

North America

  • US

  • Canada

  • Mexico

Europe

  • Eastern Europe

    • Poland

    • Romania

    • Hungary

    • Turkey

    • Rest of Eastern Europe

  • Western Europe

    • Germany

    • France

    • UK

    • Italy

    • Spain

    • Netherlands

    • Switzerland

    • Austria

    • Rest of Western Europe

Asia Pacific

  • China

  • India

  • Japan

  • South Korea

  • Vietnam

  • Singapore

  • Australia

  • Rest of Asia Pacific

Middle East & Africa

Middle East

  • UAE

  • Egypt

  • Saudi Arabia

  • Qatar

  • Rest of Middle East

Africa

  • Nigeria

  • South Africa

  • Rest of Africa

Latin America

  • Brazil

  • Argentina

  • Colombia

  • Rest of Latin America

Request for Country Level Research Report: Country Level Customization Request

Available Customization

With the given market data, SNS Insider offers customization as per the company’s specific needs. The following customization options are available for the report:

  • Product Analysis

  • Criss-Cross segment analysis (e.g. Product X Application)

  • Product Matrix which gives a detailed comparison of product portfolio of each company

  • Geographic Analysis

  • Additional countries in any of the regions

  • Company Information

  • Detailed analysis and profiling of additional market players (Up to five)


  •            5000 (33% Discount)


  •            8950 (40% Discount)


  •            3050 (23% Discount)

Start a Conversation

Hi! Click one of our member below to chat on Phone