SiC Ingots Market Report Scope and Overview:
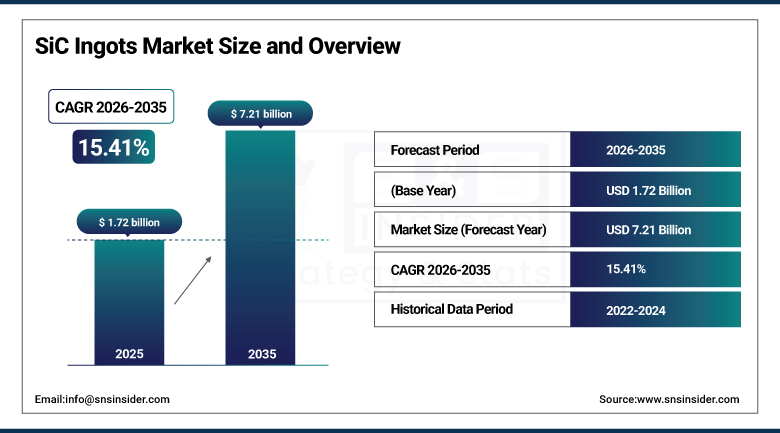
The SiC Ingots Market size was valued at USD 1.72 Billion in 2025 and is expected to reach USD 7.21 Billion by 2035, growing at a CAGR of 15.41% over the forecast period of 2026-2035.
The SiC Ingots Market is expanding rapidly due to rising demand for energy-efficient semiconductors in electric vehicles, renewable energy, and industrial systems. Silicon carbide’s superior thermal and electrical properties make it ideal for high-performance power electronics, driving its increasing adoption across advanced and emerging technology sectors.
Wide-bandgap semiconductor advancements and growing EV infrastructure are boosting SiC ingot integration into fast-charging systems, smart grids, and high-efficiency devices. Technological progress in production methods and regional investments especially in Asia-Pacific and North America are accelerating market growth, solidifying these regions as key hubs for innovation, supply chain development, and end-use expansion.
To Get More Information On SiC Ingots Market - Request Free Sample Report
SiC Ingots Market Size and Forecast:
-
Market Size in 2025: USD 1.72 Billion
-
Market Size by 2035: USD 7.21 Billion
-
CAGR: 15.41% from 2026 to 2035
-
Base Year: 2025
-
Forecast Period: 2026–2035
-
Historical Data: 2022–2024
SiC Ingots Market Highlights:
-
SiC technology is redefining EV performance and charging, enabling faster charging (e.g., vehicles adding ~400 km of range in ~5 minutes) and drastically improving powertrain efficiency, supported by AI‑optimized SiC crystal growth and larger wafer formats (e.g., 200 mm) that increase yields and reduce defects.
-
Breakthroughs in wafer technology, including pioneering laser‑cutting and laser spalling methods, are significantly increasing wafer production efficiency, reducing material loss and cut times, and boosting yields, which helps lower SiC costs and supports scaling for EV and industrial applications.
-
Global competition is intensifying, with Chinese firms advancing 8‑inch and 12‑inch SiC wafer production lines and aiming for greater localization, which could reshape global market shares and cost structures.
-
Wolfspeed’s market leadership faces challenges, as heavy investment and strategic risks have led to financial strain, while European and Asian rivals continue to develop competitive SiC infrastructure and production capacity.
-
Advanced manufacturing techniques like laser-assisted slicing and air‑bearing stage precision are becoming key enablers for higher throughput, improved wafer quality, and reduced process waste, supporting the broader adoption of SiC materials in power electronics.
-
SiC applications are expanding beyond automotive, increasingly serving high‑voltage power systems, renewable energy infrastructure, and AI data centers, highlighting the material’s strategic importance in global electrification and energy transition efforts.
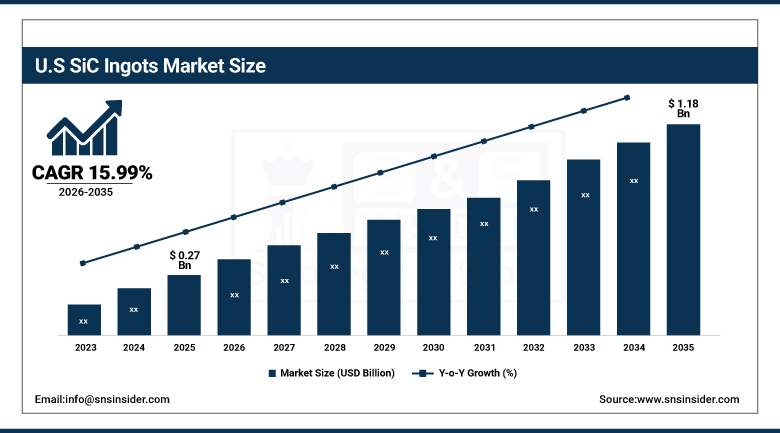
The U.S. SiC Ingots Market size was USD 0.27 billion in 2025 and is expected to reach USD 1.18 billion by 2035, growing at a CAGR of 15.99% over the forecast period of 2026–2035.The US sic ingots market growth is driven by rapid electrification in transportation, a growing focus on renewable energy integration, and government support for domestic semiconductor production. Increasing investment in EV infrastructure and demand for high-efficiency power components are further strengthening the U.S. market position in the SiC ingot space.
According to research, in 2024, over 180,000 public EV chargers are installed across the U.S., with SiC-enabled fast chargers growing fastest.
SiC Ingots Market Drivers:
-
Rising demand for electric vehicles and renewable energy systems boosts the need for energy-efficient semiconductor materials like SiC ingots.
Electric vehicles (EVs) and renewable power systems require high-performance semiconductors capable of withstanding high voltages and temperatures. SiC ingots, offering superior thermal conductivity and energy efficiency compared to silicon, have become crucial in developing high-voltage inverters and fast-charging components. Their ability to enhance EV range and reduce power losses in solar inverters positions them as key enablers of decarbonization efforts. This transition toward sustainable transport and energy infrastructure is creating a consistent demand surge for SiC ingots across developed and emerging markets.
According to research, over 40% of new solar inverter manufacturers have integrated SiC components by 2024 to improve performance.
SiC Ingots Market Restraints:
-
Limited supply chain and wafer availability restrict large-scale commercialization of SiC ingots across emerging markets.
The SiC ingot market is concentrated among a few established players with high technological barriers, leading to restricted supply availability. Capacity expansion is time-consuming, and global supply chains remain vulnerable to geopolitical tensions and export restrictions. Moreover, wafer shortages often disrupt production schedules for downstream manufacturers, especially in Asia and Latin America. This bottleneck affects the scalability of SiC-based solutions across various industries, slowing market penetration and adoption in regions lacking strong semiconductor manufacturing infrastructure.
| Factor | Key Insight |
|---|---|
|
Market Dominance |
Top 3 players hold over 75% of SiC ingot production. |
|
Supply Gap |
Only 60–70% of global demand currently met. |
|
Expansion Delay |
New fabs require 18–24 months to become operational. |
|
Geopolitical Risk |
Trade tensions and export controls hinder material flow. |
|
Technical Barrier |
Complex processes and high defect rates limit new entrants. |
SiC Ingots Market Opportunities:
-
Emergence of high-voltage charging infrastructure for electric vehicles opens demand for advanced SiC-based power electronics.
The global roll-out of high-speed EV charging networks requires power components that support high voltages and fast switching speeds. SiC ingots enable devices that operate efficiently in these extreme conditions, providing improved energy efficiency and thermal stability. As governments and automotive manufacturers invest in charging stations and grid infrastructure, demand for SiC devices—particularly for power conversion and distribution—will rise sharply. This creates a lucrative opportunity for SiC ingot manufacturers to supply key components in next-generation mobility ecosystems.
According to research, charging time using SiC-enabled systems can be cut from 60 minutes to under 20 minutes in high-power EV chargers.
SiC Ingots Market Segment Analysis:
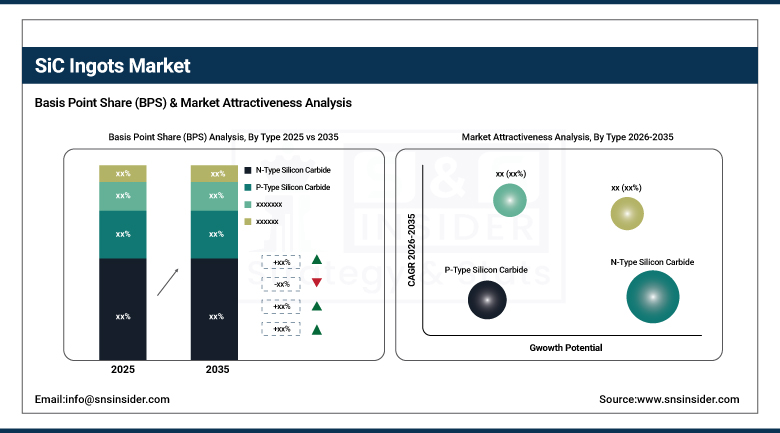
By Type
N-Type Silicon Carbide dominated the highest market share in 2025 with approximately 61.02% revenue share, due to its superior electrical characteristics such as high electron mobility and low resistivity, which are essential for high-power and high-frequency applications. These features support its extensive use in EV powertrains, industrial inverters, and energy grids. Its excellent thermal conductivity and voltage-handling capacity make it a preferred material for demanding applications. The segment’s dominance is also reinforced by consistent supply from key producers.
P-Type Silicon Carbide is expected to grow at the fastest CAGR of about 16.39% from 2026 to 2035, driven by increasing demand for advanced semiconductor devices with enhanced switching performance. Sic Ingots Companies like SK Siltron are expanding their R&D and production capabilities to develop next-generation P-Type SiC materials. Rising demand for complementary SiC structures in high-voltage bipolar devices and optoelectronic systems is creating opportunities for wider adoption, especially in applications requiring more complex doping and junction configurations.
By Application
The Power Electronics segment dominated the SiC Ingots Market share of approximately 34.76% in 2025, owing to growing usage of SiC in EVs, power grids, and industrial automation. SiC-based devices enable high efficiency, compact designs, and better thermal performance for power conversion systems. Infineon Technologies plays a vital role in this segment by offering SiC power solutions for inverters, onboard chargers, and energy storage systems, which are increasingly demanded across automotive and renewable energy sectors.
The LEDs segment is expected to grow at the fastest CAGR of about 16.62% from 2026 to 2035, fueled by expanding applications in smart lighting, automotive headlamps, and large-scale displays. SiC’s compatibility with GaN epitaxy allows for improved efficiency and longevity in LED devices. Wolfspeed is a major contributor to this growth, supplying high-quality SiC substrates tailored for advanced lighting solutions, enabling manufacturers to produce high-performance, thermally stable, and miniaturized lighting components.
By Production Method
Physical Vapor Transport (PVT) dominated the share in the SiC Ingots Market in 2025, accounting for about 59.30% of the revenue. PVT is widely adopted due to its scalability, cost-effectiveness, and capability to grow large, high-purity SiC crystals suitable for power devices. ROHM Semiconductor utilizes PVT-grown ingots for fabricating efficient and reliable power electronics used in EVs, solar inverters, and industrial drives. The method’s maturity and compatibility with current manufacturing ecosystems further support its widespread usage.
Chemical Vapor Deposition (CVD) is forecasted to grow at the fastest CAGR of about 15.95% from 2026 to 2035, driven by its ability to produce ultra-pure, defect-free epitaxial SiC layers. This precision makes CVD the preferred method for fabricating high-performance devices in aerospace, high-frequency, and defense sectors. II-VI Incorporated is investing significantly in CVD processes to meet the rising demand for advanced SiC materials in cutting-edge semiconductor applications, where material quality and doping control are critical performance drivers.
SiC Ingots Market Regional Analysis:
Asia-Pacific SiC Ingots Market Trends:
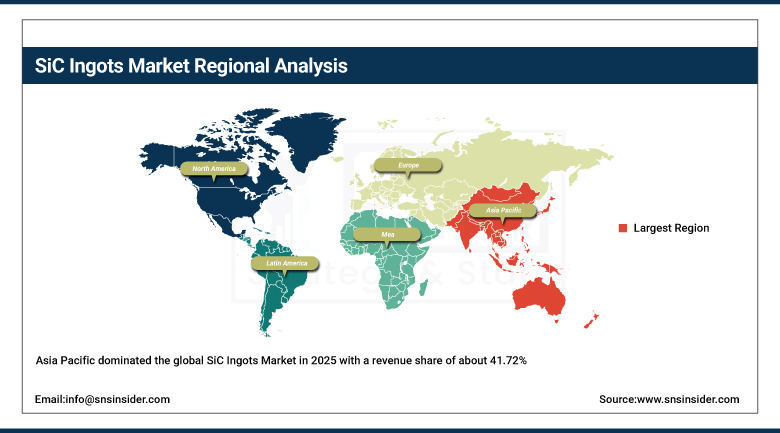
Asia Pacific dominated the global SiC Ingots Market in 2025 with a revenue share of about 41.72%, supported by a strong manufacturing ecosystem and government initiatives in countries such as China, Japan, and South Korea. These nations lead in EV production, renewable energy projects, and semiconductor fabrication. Local companies are rapidly scaling SiC wafer production to meet global demand. The region’s cost competitiveness and established supply chains make it a central hub for SiC ingot development and deployment.
According to research, Asia-Pacific is home to 7 of the top 10 EV battery producers, reinforcing the vertical integration with SiC power electronics.
China leads the Asia Pacific SiC Ingots Market owing to its vast manufacturing capacity, significant government support, and aggressive investment in electric vehicles, renewable energy, and semiconductor production, making it a critical hub for global SiC demand and supply.
Get Customized Report as Per Your Business Requirement - Enquiry Now
North America SiC Ingots Market Trends:
North America is projected to grow at the fastest CAGR of about 16.70% from 2026 to 2035, driven by rising investments in electric mobility, 5G infrastructure, and defense electronics. Strategic initiatives to reduce reliance on imports and localize semiconductor supply chains are fueling SiC production in the region. U.S.-based companies are expanding fabrication capacity and forming strategic partnerships to support the increasing demand. Government funding and growing adoption in high-power, high-efficiency systems also contribute to North America’s rapid market growth.
According to research, U.S.-based SiC producers (e.g., Wolfspeed) are expanding to support next-gen 800V EV platforms using SiC inverters.
The U.S. dominates the North American SiC Ingots Market due to strong federal investments, leading semiconductor manufacturers, and a thriving EV and defense sector. Local supply chain initiatives and technological advancements further position the country at the forefront of regional market growth.
Europe SiC Ingots Market Trends:
Europe’s SiC Ingots Market is steadily growing, supported by the region’s commitment to carbon neutrality, rising adoption of electric mobility, and advancements in power electronics. Countries like Germany and France are investing in local SiC production, R&D facilities, and clean energy systems, driving demand for high-efficiency semiconductors. Additionally, EU policies promoting domestic semiconductor manufacturing are reinforcing Europe’s strategic role in the global SiC value chain.
According to research, Europe added ~73 GW of renewable capacity in 2023, with solar accounting for nearly 60 GW, driving demand for SiC-based power inverters.
Germany leads due to its strong automotive industry, substantial investments in electric mobility and renewable energy, and the presence of major semiconductor manufacturers. The country’s robust R&D ecosystem and government initiatives to strengthen domestic chip production further solidify its leadership in the region.
Latin America and Middle East & Africa SiC Ingots Market Trends:
In the Middle East & Africa, the UAE leads the SiC Ingots Market through strong investments in renewable energy, smart infrastructure, and tech innovation. In Latin America, Brazil dominates due to its growing EV sector, industrial development, and government initiatives supporting semiconductor manufacturing and advanced power electronics integration across key industries.
SiC Ingots Market Competitive Landscape:
ROHM’s SiCrystal (a ROHM Group company) is a German‑based semiconductor manufacturer established in 1997 that specializes in producing and supplying high‑quality single‑crystal silicon carbide (SiC) wafers used as substrates in power electronics, automotive, industrial and EV applications; these SiC wafers enable high‑efficiency power devices and are a key material for MOSFETs, diodes and other next‑generation semiconductor products, supporting global chip makers with mass‑production capacity and long‑term supply
- In April 2024, ROHM (SiCrystal) announced ramping up of its PVT-grown SiC ingots to support internal demand, in line with global trend of major firms expanding SiC capacity.
ON Semiconductor (onsemi) is a U.S.‑based global semiconductor company founded in 1999 and headquartered in Scottsdale/Phoenix, Arizona, that designs, manufactures and supplies a broad portfolio of intelligent power and sensing technologies — including power management ICs, discrete and logic devices, image sensors and silicon carbide (SiC) products — serving automotive, industrial, computing, communications, medical and consumer markets with solutions that improve energy efficiency, safety and performance worldwide.
- In March 2024, Onsemi announced plans to build a full-scale SiC manufacturing facility in the Czech Republic to produce advanced power semiconductors integrating SiC substrates and devices.
SiC Ingots Market Key Players:
-
Wolfspeed
-
II‑VI Incorporated
-
SiCrystal (ROHM Co., Ltd.)
-
Norstel AB (STMicroelectronics)
-
ON Semiconductor
-
Infineon Technologies
-
ROHM Semiconductor
-
Atecom Technology
-
Hypersics Semiconductor
-
TankeBlue Semiconductor
-
STMicroelectronics
-
Mitsubishi Electric
-
GeneSiC Semiconductor
-
Fuji Electric
-
Showa Denko K.K.
-
Sumitomo Electric Industries
-
United Silicon Carbide
-
Skyworks Solutions
-
Cree, Inc.
-
Advanced Semiconductor Materials
| Report Attributes | Details |
|---|---|
| Market Size in 2025 | USD 1.72 Billion |
| Market Size by 2035 | USD 7.21 Billion |
| CAGR | CAGR of 15.41% From 2026 to 2035 |
| Base Year | 2025 |
| Forecast Period | 2026-2035 |
| Historical Data | 2022-2024 |
| Report Scope & Coverage | Market Size, Segments Analysis, Competitive Landscape, Regional Analysis, DROC & SWOT Analysis, Forecast Outlook |
| Key Segments | • By Type (N-Type Silicon Carbide, P-Type Silicon Carbide) • By Application (Power Electronics, LEDs, Semiconductors, High-Temperature Electronics, RF Devices) • By Production Method (Physical Vapor Transport (PVT), Chemical Vapor Deposition (CVD), Other Methods) |
| Regional Analysis/Coverage | North America (US, Canada), Europe (Germany, UK, France, Italy, Spain, Russia, Poland, Rest of Europe), Asia Pacific (China, India, Japan, South Korea, Australia, ASEAN Countries, Rest of Asia Pacific), Middle East & Africa (UAE, Saudi Arabia, Qatar, South Africa, Rest of Middle East & Africa), Latin America (Brazil, Argentina, Mexico, Colombia, Rest of Latin America). |
| Company Profiles | Wolfspeed, II‑VI Incorporated, SiCrystal (ROHM Co., Ltd.), Norstel AB (STMicroelectronics), ON Semiconductor, Infineon Technologies, ROHM Semiconductor, Atecom Technology, Hypersics Semiconductor, TankeBlue Semiconductor, STMicroelectronics, Mitsubishi Electric, GeneSiC Semiconductor, Fuji Electric, Showa Denko K.K., Sumitomo Electric Industries, United Silicon Carbide, Skyworks Solutions, Cree, Inc., Advanced Semiconductor Materials |
Frequently Asked Questions
Asia Pacific dominated the SiC Ingots Market in 2025.
N-Type Silicon Carbide segment dominated the SiC Ingots Market.
The major growth factor of the SiC Ingots Market is the increasing demand for energy-efficient power electronics in EVs, renewable energy, and industrial systems.
The SiC Ingots Market size was valued at USD 1.72 Billion in 2025 and is expected to reach USD 7.21 Billion by 2035
The SiC Ingots Market is expected to grow at a CAGR of 15.41% from 2026-2035.
Get in Touch
