SiC Device Market Size Analysis:
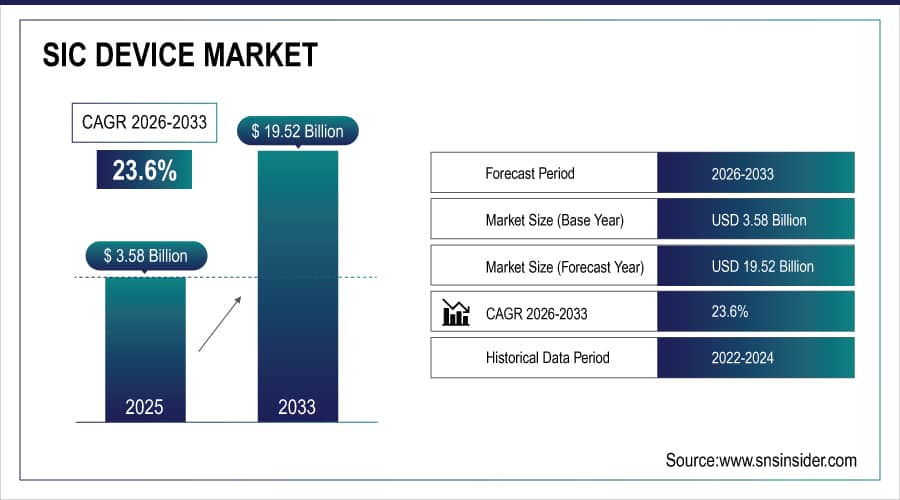
The SiC Device Market size was valued at USD 2.90 billion in 2024 and is expected to reach USD 15.82 billion by 2032 and grow at a CAGR of 23.6% over the forecast period 2025-2032. The Silicon Carbide devices market has been witnessing a considerable growth rate due to the increasing requirement for highly efficient power electronics in various industries. The SiC Device are more beneficial than the traditional silicon-based devices regarding performance at high temperature, high voltage, and high speed. Thus, the growing usage of SiC switches, power ICs, Schottky diodes, and power modules in the automotive, renewable energy, industrial, and telecommunications industries has contributed to the market growth.

Get more information on SiC Device Market - Request Sample Report
The U.S. Department of Energy’s Office of Electricity launched the American-Made Silicon Carbide Packaging Prize which will award $2.25 million in February 2024. The prize is a competition that encourages participants to put forward, design, construct, and test SiC Device or silicon carbide semiconductor packaging prototypes, to make them work more productively in high-voltage applications, such as energy storage. It forms part of the American-Made Challenges program and will help to further cooperation between the DOE National Labs, the U.S. entrepreneurs and innovators, and the private sector.
Key SiC Device Market Trends:
-
Accelerated adoption of SiC devices in renewable energy, particularly in solar and wind power inverters and converters.
-
Superior voltage resistance and high-performance efficiency of SiC in extreme operating conditions driving wider deployment.
-
Rising global investments in renewable energy infrastructure to reduce fossil fuel dependence and combat climate change.
-
Increased government support through R&D funding, tax rebates, subsidies, and grants for SiC technology adoption.
-
Collaborative initiatives between governments, research organizations, and industry players to advance SiC applications in automotive, energy, and manufacturing.
SiC Device Market Growth Drivers:
-
Advancements in Renewable Energy
The renewable energy sector, particularly solar power and wind power, is growing at an accelerated rate as the world turns towards sustainable energy solutions. Utilized in power converters and inverters, SiC Device are driving this expansion by streamlining multiple aspects of power transformer use. SiC inverters do not suffer from higher energy losses alone, as they boast better voltage-resistance capabilities and greater workability placed in extreme circumstances. Furthermore, the current worldwide trend of pouring resources into renewable energy to counteract climate change and lessen our reliance on fossil fuels will likely drive the demand for SiC Device even higher.
-
Supportive Government Policies and Investments
Various governments globally have started to see different purposes of SiC technologies and try to use them to promote energy efficiency and reduce carbon emissions. Many governments throughout the world have started to implement and support various research and developments of SiC Device. This includes financing of research processes and implementation of SiC Device in such fields as automotive, energy, and manufacturing. The government uses various incentives, such as tax rebates, subsidies, and grants to promote it. The governments benefit from less carbon emissions and strive to use collaborative initiatives with the help of research organizations and companies.
SiC Device Market Restraints:
-
The availability of replacement materials like gallium nitride
Gallium nitride is expected to replace silicon carbide due to manifold electrical properties and performance benefits over the latter. The bandgap of GaN is much broader and allows the fabrication of devices that operate at higher voltages and temperatures. Its electron mobility is also greater and, thus, the switching speed is increased. Such devices put to waste less energy. Furthermore, GaN elements are physically smaller and lighter. As such, they are irreplaceable in electric vehicles, solar technology, and telecommunication applications.
SiC Device Market Segment Analysis:
By Product
The power semiconductors segment led the market with a market share of 60% in 2024. SiC Device have several fundamental qualities such as wide band gap, which makes them a good option for power semiconductors. It also helps in lowering the size of the equipment and makes it more dependable for higher voltages and switching frequencies.
The optoelectronic devices segment is estimated to have a faster CAGR in the forecast period. The growth of this segment can be attributed to the rising application of silicon carbide in high-energy lighting and laser devices. Moreover, silicon carbide is also being widely used in optoelectronic devices including light-emitting diodes, solar cells, photodetectors, and telescopes due to its higher thermal stability.
By Component
The power module segment dominated the market in 2024 with more than 30% of the market share. SiC power modules are used in high-power applications distinguished by the characteristics of the resulting compound blocks. SiC power modules, unlike silicon in classic modules, have a larger bandgap. It leads to higher heat, voltage, and switching levels, meaning less energy lost on resistance and higher efficiency, as well as the possibility of making a smaller and lighter system. Such modules are used in electric vehicles, renewable energy systems, and various other applications.
The FET/MOSFET transistors segment is to show significant growth during the forecast period 2025-2032. The major advantages of silicon carbide FET/MOSFET include higher thermal conductivity, higher critical breakdown field, and a wider band gap. They also increase the current density, reduce the thickness of the device and on-state resistance, and reduce leakage/power loss at high operating temperatures.
By Wafer Size
The 1 inch to 4 inches segment dominated the market in 2024 with a market share of over 44.0%. These silicon carbide devices can be manufactured on large scales, which makes them cost-effective. The demand is expected to remain inclined toward industrial applications. These wafers help in reducing the equipment dimensions and the resultant noise. This will ensure the establishment of prolific opportunities for the growth of the segment over the forecast period.
The 10 inches & above segment is expected to have the fastest CAGR over the forecast period, owing to the commercial scale manufacturing of silicon carbide wafers. The wafers ensure the fabricating of Gallium Nitride devices, which include power devices and LEDs.
SiC Device Market Regional Analysis:
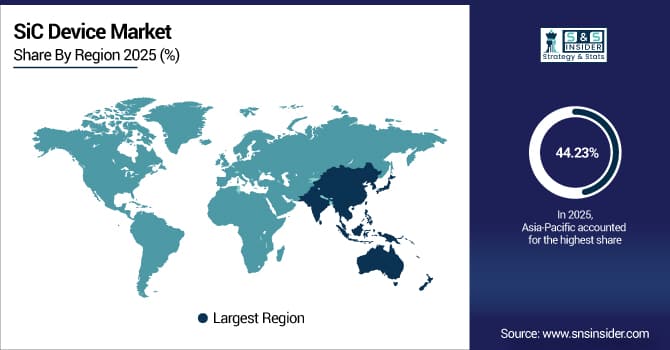
Asia Pacific SiC Device Market Insights
Asia Pacific held the largest market share of 44.23% in 2024. This dominance is due to the deployment of SiC Device in end-use industries like consumer electronics, automotive, as well as medical. The demand for SiC Device will be driven by the number of power device manufacturers in the region, especially in Asia. As a high percentage of discrete devices are imported from the region, high demand for SiC Device is likely to increase the value of this market.
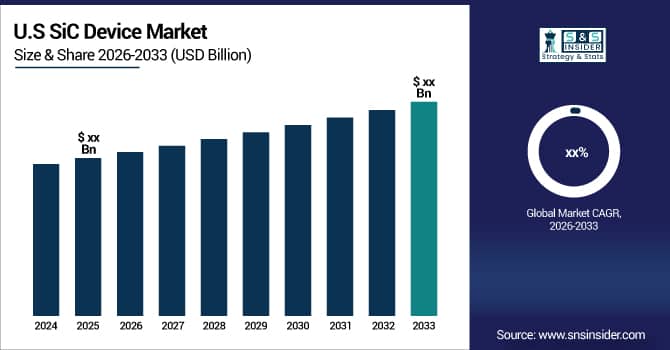
North America SiC Device Market Insights
North America is to grow at a faster CAGR during 2025-2032. The growth of this region is attributed to the presence and concentration of prominent players such as Gene Sic Semiconductor with an established customer base. Additionally, the concentration of these prominent players in this region encourages power electronics manufacturers to better adopt innovative SiC Device with advanced efficiency. Moreover, leading regional players are also implementing strategic initiatives, encouraging the growth of this region.
Europe SiC Device Market Insights
Europe’s SiC device market is expanding steadily, supported by strong renewable energy initiatives, electrification of transport, and government-backed carbon reduction targets. Growing demand for efficient power electronics in automotive, industrial, and energy sectors drives adoption. Strategic collaborations, R&D investments, and supportive EU regulations further enhance SiC technology deployment across advanced applications.
Latin America (LATAM) and Middle East & Africa (MEA) SiC Device Market Insights
LATAM and MEA SiC device markets are gaining traction, fueled by rising renewable energy projects, infrastructure modernization, and gradual adoption of EV technologies. Government initiatives to diversify energy sources, reduce dependency on fossil fuels, and improve grid efficiency are boosting SiC integration. Opportunities exist in solar power, oil & gas, and emerging smart infrastructure applications.

Need any customization research on SiC Device Market - Enquiry Now
SiC Device Companies are:
-
Fuji Electric Co., Ltd
-
Infineon Technologies AG
-
Microchip Technology Inc.
-
Mitsubishi Electric Corporation
-
Renesas Electronics Corporation
-
ROHM Co., Ltd
-
Toshiba Electronic Devices & Storage Corporation
-
Wolfspeed, Inc.
-
STMicroelectronics N.V.
-
Texas Instruments Incorporated
-
Littelfuse, Inc.
-
GeneSiC Semiconductor Inc.
-
SemiQ, Inc.
-
Alpha & Omega Semiconductor Limited (AOS)
-
UnitedSiC (now part of Qorvo, but still active under Qorvo brand)
-
IXYS Corporation (part of Littelfuse, still manufacturing)
-
Power Integrations, Inc.
-
SK Siltron Co., Ltd
Competitive Landscape for SiC Device Market:
Renesas Electronics Corporation is a leading global semiconductor manufacturer advancing the SiC device market with high-performance solutions for automotive, industrial, and renewable energy applications. The company focuses on SiC MOSFETs and modules that deliver superior energy efficiency, thermal management, and reliability. Leveraging strong R&D, partnerships, and a wide product portfolio, Renesas supports the transition to electric vehicles, clean energy systems, and smart infrastructure, positioning itself as a key player in power electronics innovation.
-
In July 2023 – Renesas and Wolfspeed signed a ten-year wafer supply contract was signed, access to high-quality SiC wafers for power semiconductor production, the amount of 2 billion USD, starting from 2025.
Report Attributes | Details |
Market Size in 2024 | USD 2.90 Billion |
Market Size by 2032 | USD 15.82 Billion |
CAGR | CAGR of 23.6% From 2025 to 2032 |
Base Year | 2024 |
Forecast Period | 2025-2032 |
Historical Data | 2021-2023 |
Report Scope & Coverage | Market Size, Segments Analysis, Competitive Landscape, Regional Analysis, DROC & SWOT Analysis, Forecast Outlook |
Key Segments | • By Product (Optoelectronic Devices, Power Semiconductors, Frequency Devices) • By Component (Schottky Diodes, FET/MOSFET Transistors, Integrated Circuits, Rectifiers/Diodes, Power Modules, Others) • By Wafer Size (1 inch to 4 inches, 6 inches, 8 inches, 10 inches & above) • By End-use (Automotive, Consumer Electronics, Aerospace & Defense, Medical Devices, Data & Communication Devices, Energy & Power, Others) |
Regional Analysis/Coverage | North America (US, Canada), Europe (Germany, UK, France, Italy, Spain, Russia, Poland, Rest of Europe), Asia Pacific (China, India, Japan, South Korea, Australia, ASEAN Countries, Rest of Asia Pacific), Middle East & Africa (UAE, Saudi Arabia, Qatar, South Africa, Rest of Middle East & Africa), Latin America (Brazil, Argentina, Mexico, Colombia, Rest of Latin America). |
Company Profiles | Coherent Corp., Fuji Electric Co., Ltd, Infineon Technologies AG, Microchip Technology Inc., Mitsubishi Electric Corporation, ON Semiconductor Corp., Renesas Electronics Corporation, ROHM Co., Ltd, Toshiba Electronic Devices & Storage Corporation, Wolfspeed, Inc., STMicroelectronics N.V., Texas Instruments Incorporated, Littelfuse, Inc., GeneSiC Semiconductor Inc., SemiQ, Inc., Alpha & Omega Semiconductor Limited, UnitedSiC (Qorvo), IXYS Corporation, Power Integrations, Inc., SK Siltron Co., Ltd. |
Table Of Contents
1. Introduction
1.1 Market Definition & Scope
1.2 Research Assumptions & Abbreviations
1.3 Research Methodology
2. Executive Summary
2.1 Market Snapshot
2.2 Market Absolute $ Opportunity Assessment & Y-o-Y Analysis, 2021–2032
2.3 Market Size & Forecast, By Segmentation, 2021–2032
2.3.1 Market Size By Product
2.3.2 Market Size By Component
2.3.3 Market Size By Wafer Size
2.3.4 Market Size By End-User
2.4 Market Share & Bps Analysis By Region, 2024
2.5 Industry Growth Scenarios – Conservative, Likely & Optimistic
2.6 Industry CxO’s Perspective
3. Market Overview
3.1 Market Dynamics
3.1.1 Drivers
3.1.2 Restraints
3.1.3 Opportunities
3.1.4 Key Market Trends
3.2 Industry PESTLE Analysis
3.3 Key Industry Forces (Porter’s) Impacting Market Growth
3.4 Industry Supply Chain Analysis
3.4.1 Raw Material Suppliers
3.4.2 Manufacturers
3.4.3 Distributors/Suppliers
3.4.4 Customers/End-Users
3.5 Industry Life Cycle Assessment
3.6 Parent Market Overview
3.7 Market Risk Assessment
4. Statistical Insights & Trends Reporting
4.1 Performance & Technology Metrics
4.1.1 Average power efficiency improvement (%) of SiC devices vs. silicon-based devices
4.1.2 Average switching frequency (kHz/MHz) across SiC MOSFETs, diodes, and modules
4.1.3 Average thermal conductivity (W/mK) and heat dissipation advantage vs. silicon
4.2 Adoption & Deployment Trends
4.2.1 Percentage adoption of SiC devices in automotive (EVs), energy, and industrial sectors
4.2.2 Average number of SiC devices per electric vehicle (by application: inverter, OBC, charger)
4.2.3 Year-on-year growth rate (%) of SiC wafer/device shipments globally
4.3 Integration & Ecosystem Metrics
4.3.1 Share of SiC devices integrated into EV powertrains vs. renewable energy systems (%)
4.3.2 Average wafer size transition trend (4-inch, 6-inch, 8-inch) by market share (%)
4.3.3 Adoption rate of SiC devices in fast-charging infrastructure (%)
4.4 Cost & Manufacturing Benchmarks
4.4.1 Average cost per SiC wafer compared to silicon wafer (USD)
4.4.2 Share of material, fabrication, and packaging in total SiC device cost (%)
4.4.3 Average price decline (%) of SiC MOSFETs and diodes per year
5. SiC Device Market Segmental Analysis & Forecast, By Product, 2021 – 2032, Value (USD Billion)
5.1 Introduction
5.2 Optoelectronic Devices
5.2.1 Key Trends
5.2.2 Market Size & Forecast, 2021 – 2032
5.3 Power Semiconductors
5.3.1 Key Trends
5.3.2 Market Size & Forecast, 2021 – 2032
5.4 Frequency Devices
5.4.1 Key Trends
5.4.2 Market Size & Forecast, 2021 – 2032
6. SiC Device Market Segmental Analysis & Forecast, By Component, 2021 – 2032, Value (USD Billion)
6.1 Introduction
6.2 Schottky Diodes
6.2.1 Key Trends
6.2.2 Market Size & Forecast, 2021 – 2032
6.3 FET/MOSFET Transistors
6.3.1 Key Trends
6.3.2 Market Size & Forecast, 2021 – 2032
6.4 Integrated Circuits
6.4.1 Key Trends
6.4.2 Market Size & Forecast, 2021 – 2032
6.5 Rectifiers/Diodes
6.5.1 Key Trends
6.5.2 Market Size & Forecast, 2021 – 2032
6.6 Power Modules
6.6.1 Key Trends
6.6.2 Market Size & Forecast, 2021 – 2032
6.7 Others
6.7.1 Key Trends
6.7.2 Market Size & Forecast, 2021 – 2032
7. SiC Device Market Segmental Analysis & Forecast, By Wafer Size, 2021 – 2032, Value (USD Billion)
7.1 Introduction
7.2 1 inch to 4 inches
7.2.1 Key Trends
7.2.2 Market Size & Forecast, 2021 – 2032
7.3 6 inches
7.3.1 Key Trends
7.3.2 Market Size & Forecast, 2021 – 2032
7.4 8 inches
7.4.1 Key Trends
7.4.2 Market Size & Forecast, 2021 – 2032
7.5 10 inches & above
7.5.1 Key Trends
7.5.2 Market Size & Forecast, 2021 – 2032
8. SiC Device Market Segmental Analysis & Forecast, By End-User, 2021 – 2032, Value (USD Billion)
8.1 Introduction
8.2 Automotive
8.2.1 Key Trends
8.2.2 Market Size & Forecast, 2021 – 2032
8.3 Consumer Electronics
8.3.1 Key Trends
8.3.2 Market Size & Forecast, 2021 – 2032
8.4 Aerospace & Defense
8.4.1 Key Trends
8.4.2 Market Size & Forecast, 2021 – 2032
8.5 Medical Devices
8.5.1 Key Trends
8.5.2 Market Size & Forecast, 2021 – 2032
8.6 Data & Communication Devices
8.6.1 Key Trends
8.6.2 Market Size & Forecast, 2021 – 2032
8.7 Energy & Power
8.7.1 Key Trends
8.7.2 Market Size & Forecast, 2021 – 2032
8.8 Others
8.8.1 Key Trends
8.8.2 Market Size & Forecast, 2021 – 2032
9. SiC Device Market Segmental Analysis & Forecast By Region, 2021 – 2025, Value (USD Billion)
9.1 Introduction
9.2 North America
9.2.1 Key Trends
9.2.2 SiC Device Market Size & Forecast, By Product, 2021 – 2032
9.2.3 SiC Device Market Size & Forecast, By Component, 2021 – 2032
9.2.4 SiC Device Market Size & Forecast, By Wafer Size, 2021 – 2032
9.2.5 SiC Device Market Size & Forecast, By End-User, 2021 – 2032
9.2.6 SiC Device Market Size & Forecast, By Country, 2021 – 2032
9.2.6.1 USA
9.2.6.1.1 SiC Device Market Size & Forecast, By Product, 2021 – 2032
9.2.6.1.2 SiC Device Market Size & Forecast, By Component, 2021 – 2032
9.2.6.1.3 SiC Device Market Size & Forecast, By Wafer Size, 2021 – 2032
9.2.6.1.4 SiC Device Market Size & Forecast, By End-User, 2021 – 2032
9.2.6.2 Canada
9.2.6.2.1 SiC Device Market Size & Forecast, By Product, 2021 – 2032
9.2.6.2.2 SiC Device Market Size & Forecast, By Component, 2021 – 2032
9.2.6.2.3 SiC Device Market Size & Forecast, By Wafer Size, 2021 – 2032
9.2.6.2.4 SiC Device Market Size & Forecast, By End-User, 2021 – 2032
9.3 Europe
9.3.1 Key Trends
9.3.2 SiC Device Market Size & Forecast, By Product, 2021 – 2032
9.3.3 SiC Device Market Size & Forecast, By Component, 2021 – 2032
9.3.4 SiC Device Market Size & Forecast, By Wafer Size, 2021 – 2032
9.3.5 SiC Device Market Size & Forecast, By End-User, 2021 – 2032
9.3.6 SiC Device Market Size & Forecast, By Country, 2021 – 2032
9.3.6.1 Germany
9.3.6.1.1 SiC Device Market Size & Forecast, By Product, 2021 – 2032
9.3.6.1.2 SiC Device Market Size & Forecast, By Component, 2021 – 2032
9.3.6.1.3 SiC Device Market Size & Forecast, By Wafer Size, 2021 – 2032
9.3.6.1.4 SiC Device Market Size & Forecast, By End-User, 2021 – 2032
9.3.6.2 UK
9.3.6.2.1 SiC Device Market Size & Forecast, By Product, 2021 – 2032
9.3.6.2.2 SiC Device Market Size & Forecast, By Component, 2021 – 2032
9.3.6.2.3 SiC Device Market Size & Forecast, By Wafer Size, 2021 – 2032
9.3.6.2.4 SiC Device Market Size & Forecast, By End-User, 2021 – 2032
9.3.6.3 France
9.3.6.3.1 SiC Device Market Size & Forecast, By Product, 2021 – 2032
9.3.6.3.2 SiC Device Market Size & Forecast, By Component, 2021 – 2032
9.3.6.3.3 SiC Device Market Size & Forecast, By Wafer Size, 2021 – 2032
9.3.6.3.4 SiC Device Market Size & Forecast, By End-User, 2021 – 2032
9.3.6.4 Italy
9.3.6.4.1 SiC Device Market Size & Forecast, By Product, 2021 – 2032
9.3.6.4.2 SiC Device Market Size & Forecast, By Component, 2021 – 2032
9.3.6.4.3 SiC Device Market Size & Forecast, By Wafer Size, 2021 – 2032
9.3.6.4.4 SiC Device Market Size & Forecast, By End-User, 2021 – 2032
9.3.6.5 Spain
9.3.6.5.1 SiC Device Market Size & Forecast, By Product, 2021 – 2032
9.3.6.5.2 SiC Device Market Size & Forecast, By Component, 2021 – 2032
9.3.6.5.3 SiC Device Market Size & Forecast, By Wafer Size, 2021 – 2032
9.3.6.5.4 SiC Device Market Size & Forecast, By End-User, 2021 – 2032
9.3.6.6 Russia
9.3.6.6.1 SiC Device Market Size & Forecast, By Product, 2021 – 2032
9.3.6.6.2 SiC Device Market Size & Forecast, By Component, 2021 – 2032
9.3.6.6.3 SiC Device Market Size & Forecast, By Wafer Size, 2021 – 2032
9.3.6.6.4 SiC Device Market Size & Forecast, By End-User, 2021 – 2032
9.3.6.7 Poland
9.3.6.7.1 SiC Device Market Size & Forecast, By Product, 2021 – 2032
9.3.6.7.2 SiC Device Market Size & Forecast, By Component, 2021 – 2032
9.3.6.7.3 SiC Device Market Size & Forecast, By Wafer Size, 2021 – 2032
9.3.6.7.4 SiC Device Market Size & Forecast, By End-User, 2021 – 2032
9.3.6.8 Rest of Europe
9.3.6.8.1 SiC Device Market Size & Forecast, By Product, 2021 – 2032
9.3.6.8.2 SiC Device Market Size & Forecast, By Component, 2021 – 2032
9.3.6.8.3 SiC Device Market Size & Forecast, By Wafer Size, 2021 – 2032
9.3.6.8.4 SiC Device Market Size & Forecast, By End-User, 2021 – 2032
9.4 Asia-Pacific
9.4.1 Key Trends
9.4.2 SiC Device Market Size & Forecast, By Product, 2021 – 2032
9.4.3 SiC Device Market Size & Forecast, By Component, 2021 – 2032
9.4.4 SiC Device Market Size & Forecast, By Wafer Size, 2021 – 2032
9.4.5 SiC Device Market Size & Forecast, By End-User, 2021 – 2032
9.4.6 SiC Device Market Size & Forecast, By Country, 2021 – 2032
9.4.6.1 China
9.4.6.1.1 SiC Device Market Size & Forecast, By Product, 2021 – 2032
9.4.6.1.2 SiC Device Market Size & Forecast, By Component, 2021 – 2032
9.4.6.1.3 SiC Device Market Size & Forecast, By Wafer Size, 2021 – 2032
9.4.6.1.4 SiC Device Market Size & Forecast, By End-User, 2021 – 2032
9.4.6.2 India
9.4.6.2.1 SiC Device Market Size & Forecast, By Product, 2021 – 2032
9.4.6.2.2 SiC Device Market Size & Forecast, By Component, 2021 – 2032
9.4.6.2.3 SiC Device Market Size & Forecast, By Wafer Size, 2021 – 2032
9.4.6.2.4 SiC Device Market Size & Forecast, By End-User, 2021 – 2032
9.4.6.3 Japan
9.4.6.3.1 SiC Device Market Size & Forecast, By Product, 2021 – 2032
9.4.6.3.2 SiC Device Market Size & Forecast, By Component, 2021 – 2032
9.4.6.3.3 SiC Device Market Size & Forecast, By Wafer Size, 2021 – 2032
9.4.6.3.4 SiC Device Market Size & Forecast, By End-User, 2021 – 2032
9.4.6.4 South Korea
9.4.6.4.1 SiC Device Market Size & Forecast, By Product, 2021 – 2032
9.4.6.4.2 SiC Device Market Size & Forecast, By Component, 2021 – 2032
9.4.6.4.3 SiC Device Market Size & Forecast, By Wafer Size, 2021 – 2032
9.4.6.4.4 SiC Device Market Size & Forecast, By End-User, 2021 – 2032
9.4.6.5 Australia
9.4.6.5.1 SiC Device Market Size & Forecast, By Product, 2021 – 2032
9.4.6.5.2 SiC Device Market Size & Forecast, By Component, 2021 – 2032
9.4.6.5.3 SiC Device Market Size & Forecast, By Wafer Size, 2021 – 2032
9.4.6.5.4 SiC Device Market Size & Forecast, By End-User, 2021 – 2032
9.4.6.6 ASEAN Countries
9.4.6.6.1 SiC Device Market Size & Forecast, By Product, 2021 – 2032
9.4.6.6.2 SiC Device Market Size & Forecast, By Component, 2021 – 2032
9.4.6.6.3 SiC Device Market Size & Forecast, By Wafer Size, 2021 – 2032
9.4.6.6.4 SiC Device Market Size & Forecast, By End-User, 2021 – 2032
9.4.6.7 Rest of Asia-Pacific
9.4.6.7.1 SiC Device Market Size & Forecast, By Product, 2021 – 2032
9.4.6.7.2 SiC Device Market Size & Forecast, By Component, 2021 – 2032
9.4.6.7.3 SiC Device Market Size & Forecast, By Wafer Size, 2021 – 2032
9.4.6.7.4 SiC Device Market Size & Forecast, By End-User, 2021 – 2032
9.5 Latin America
9.5.1 Key Trends
9.5.2 SiC Device Market Size & Forecast, By Product, 2021 – 2032
9.5.3 SiC Device Market Size & Forecast, By Component, 2021 – 2032
9.5.4 SiC Device Market Size & Forecast, By Wafer Size, 2021 – 2032
9.5.5 SiC Device Market Size & Forecast, By End-User, 2021 – 2032
9.5.6 SiC Device Market Size & Forecast, By Country, 2021 – 2032
9.5.6.1 Brazil
9.5.6.1.1 SiC Device Market Size & Forecast, By Product, 2021 – 2032
9.5.6.1.2 SiC Device Market Size & Forecast, By Component, 2021 – 2032
9.5.6.1.3 SiC Device Market Size & Forecast, By Wafer Size, 2021 – 2032
9.5.6.1.4 SiC Device Market Size & Forecast, By End-User, 2021 – 2032
9.5.6.2 Argentina
9.5.6.2.1 SiC Device Market Size & Forecast, By Product, 2021 – 2032
9.5.6.2.2 SiC Device Market Size & Forecast, By Component, 2021 – 2032
9.5.6.2.3 SiC Device Market Size & Forecast, By Wafer Size, 2021 – 2032
9.5.6.2.4 SiC Device Market Size & Forecast, By End-User, 2021 – 2032
9.5.6.3 Mexico
9.5.6.3.1 SiC Device Market Size & Forecast, By Product, 2021 – 2032
9.5.6.3.2 SiC Device Market Size & Forecast, By Component, 2021 – 2032
9.5.6.3.3 SiC Device Market Size & Forecast, By Wafer Size, 2021 – 2032
9.5.6.3.4 SiC Device Market Size & Forecast, By End-User, 2021 – 2032
9.5.6.4 Colombia
9.5.6.4.1 SiC Device Market Size & Forecast, By Product, 2021 – 2032
9.5.6.4.2 SiC Device Market Size & Forecast, By Component, 2021 – 2032
9.5.6.4.3 SiC Device Market Size & Forecast, By Wafer Size, 2021 – 2032
9.5.6.4.4 SiC Device Market Size & Forecast, By End-User, 2021 – 2032
9.5.6.5 Rest of Latin America
9.5.6.5.1 SiC Device Market Size & Forecast, By Product, 2021 – 2032
9.5.6.5.2 SiC Device Market Size & Forecast, By Component, 2021 – 2032
9.5.6.5.3 SiC Device Market Size & Forecast, By Wafer Size, 2021 – 2032
9.5.6.5.4 SiC Device Market Size & Forecast, By End-User, 2021 – 2032
9.6 Middle East & Africa
9.6.1 Key Trends
9.6.2 SiC Device Market Size & Forecast, By Product, 2021 – 2032
9.6.3 SiC Device Market Size & Forecast, By Component, 2021 – 2032
9.6.4 SiC Device Market Size & Forecast, By Wafer Size, 2021 – 2032
9.6.5 SiC Device Market Size & Forecast, By End-User, 2021 – 2032
9.6.6 SiC Device Market Size & Forecast, By Country, 2021 – 2032
9.6.6.1 UAE
9.6.6.1.1 SiC Device Market Size & Forecast, By Product, 2021 – 2032
9.6.6.1.2 SiC Device Market Size & Forecast, By Component, 2021 – 2032
9.6.6.1.3 SiC Device Market Size & Forecast, By Wafer Size, 2021 – 2032
9.6.6.1.4 SiC Device Market Size & Forecast, By End-User, 2021 – 2032
9.6.6.2 Saudi Arabia
9.6.6.2.1 SiC Device Market Size & Forecast, By Product, 2021 – 2032
9.6.6.2.2 SiC Device Market Size & Forecast, By Component, 2021 – 2032
9.6.6.2.3 SiC Device Market Size & Forecast, By Wafer Size, 2021 – 2032
9.6.6.2.4 SiC Device Market Size & Forecast, By End-User, 2021 – 2032
9.6.6.3 Qatar
9.6.6.3.1 SiC Device Market Size & Forecast, By Product, 2021 – 2032
9.6.6.3.2 SiC Device Market Size & Forecast, By Component, 2021 – 2032
9.6.6.3.3 SiC Device Market Size & Forecast, By Wafer Size, 2021 – 2032
9.6.6.3.4 SiC Device Market Size & Forecast, By End-User, 2021 – 2032
9.6.6.4 Egypt
9.6.6.4.1 SiC Device Market Size & Forecast, By Product, 2021 – 2032
9.6.6.4.2 SiC Device Market Size & Forecast, By Component, 2021 – 2032
9.6.6.4.3 SiC Device Market Size & Forecast, By Wafer Size, 2021 – 2032
9.6.6.4.4 SiC Device Market Size & Forecast, By End-User, 2021 – 2032
9.6.6.5 South Africa
9.6.6.5.1 SiC Device Market Size & Forecast, By Product, 2021 – 2032
9.6.6.5.2 SiC Device Market Size & Forecast, By Component, 2021 – 2032
9.6.6.5.3 SiC Device Market Size & Forecast, By Wafer Size, 2021 – 2032
9.6.6.5.4 SiC Device Market Size & Forecast, By End-User, 2021 – 2032
9.6.6.6 Rest of Middle East & Africa
9.6.6.6.1 SiC Device Market Size & Forecast, By Product, 2021 – 2032
9.6.6.6.2 SiC Device Market Size & Forecast, By Component, 2021 – 2032
9.6.6.6.3 SiC Device Market Size & Forecast, By Wafer Size, 2021 – 2032
9.6.6.6.4 SiC Device Market Size & Forecast, By End-User, 2021 – 2032
10. Competitive Landscape
10.1 Key Players' Positioning
10.2 Competitive Developments
10.2.1 Key Strategies Adopted (%), By Key Players, 2024
10.2.2 Year-Wise Strategies & Development, 2021 – 2025
10.2.3 Number Of Strategies Adopted By Key Players, 2024
10.3 Market Share Analysis, 2024
10.4 Product/Service & Application Benchmarking
10.4.1 Product/Service Specifications & Features By Key Players
10.4.2 Product/Service Heatmap By Key Players
10.4.3 Application Heatmap By Key Players
10.5 Industry Start-Up & Innovation Landscape
10.6 Key Company Profiles
10.6.1 Coherent Corp.
10.6.1.1 Company Overview & Snapshot
10.6.1.2 Product/Service Portfolio
10.6.1.3 Key Company Financials
10.6.1.4 SWOT Analysis
10.6.2 Fuji Electric Co., Ltd.
10.6.2.1 Company Overview & Snapshot
10.6.2.2 Product/Service Portfolio
10.6.2.3 Key Company Financials
10.6.2.4 SWOT Analysis
10.6.3 Infineon Technologies AG.
10.6.3.1 Company Overview & Snapshot
10.6.3.2 Product/Service Portfolio
10.6.3.3 Key Company Financials
10.6.3.4 SWOT Analysis
10.6.4 Microchip Technology Inc.
10.6.4.1 Company Overview & Snapshot
10.6.4.2 Product/Service Portfolio
10.6.4.3 Key Company Financials
10.6.4.4 SWOT Analysis
10.6.5 Mitsubishi Electric Corporation
10.6.5.1 Company Overview & Snapshot
10.6.5.2 Product/Service Portfolio
10.6.5.3 Key Company Financials
10.6.5.4 SWOT Analysis
10.6.6 ON Semiconductor Corp.
10.6.6.1 Company Overview & Snapshot
10.6.6.2 Product/Service Portfolio
10.6.6.3 Key Company Financials
10.6.6.4 SWOT Analysis
10.6.7 Renesas Electronics Corporation
10.6.7.1 Company Overview & Snapshot
10.6.7.2 Product/Service Portfolio
10.6.7.3 Key Company Financials
10.6.7.4 SWOT Analysis
10.6.8 ROHM Co., Ltd.
10.6.8.1 Company Overview & Snapshot
10.6.8.2 Product/Service Portfolio
10.6.8.3 Key Company Financials
10.6.8.4 SWOT Analysis
10.6.9 Toshiba Electronic Devices & Storage Corporation.
10.6.9.1 Company Overview & Snapshot
10.6.9.2 Product/Service Portfolio
10.6.9.3 Key Company Financials
10.6.9.4 SWOT Analysis
10.6.10 Wolfspeed, Inc.
10.6.10.1 Company Overview & Snapshot
10.6.10.2 Product/Service Portfolio
10.6.10.3 Key Company Financials
10.6.10.4 SWOT Analysis
10.6.11 STMicroelectronics N.V.
10.6.11.1 Company Overview & Snapshot
10.6.11.2 Product/Service Portfolio
10.6.11.3 Key Company Financials
10.6.11.4 SWOT Analysis
10.6.12 Texas Instruments Incorporated.
10.6.12.1 Company Overview & Snapshot
10.6.12.2 Product/Service Portfolio
10.6.12.3 Key Company Financials
10.6.12.4 SWOT Analysis
10.6.13 Littelfuse, Inc.
10.6.13.1 Company Overview & Snapshot
10.6.13.2 Product/Service Portfolio
10.6.13.3 Key Company Financials
10.6.13.4 SWOT Analysis
10.6.14 GeneSiC Semiconductor Inc.
10.6.14.1 Company Overview & Snapshot
10.6.14.2 Product/Service Portfolio
10.6.14.3 Key Company Financials
10.6.14.4 SWOT Analysis
10.6.15 SemiQ, Inc.
10.6.15.1 Company Overview & Snapshot
10.6.15.2 Product/Service Portfolio
10.6.15.3 Key Company Financials
10.6.15.4 SWOT Analysis
10.6.16 Alpha & Omega Semiconductor Limited.
10.6.16.1 Company Overview & Snapshot
10.6.16.2 Product/Service Portfolio
10.6.16.3 Key Company Financials
10.6.16.4 SWOT Analysis
10.6.17 UnitedSiC.
10.6.17.1 Company Overview & Snapshot
10.6.17.2 Product/Service Portfolio
10.6.17.3 Key Company Financials
10.6.17.4 SWOT Analysis
10.6.18 IXYS Corporation.
10.6.18.1 Company Overview & Snapshot
10.6.18.2 Product/Service Portfolio
10.6.18.3 Key Company Financials
10.6.18.4 SWOT Analysis
10.6.19 Power Integrations, Inc.
10.6.19.1 Company Overview & Snapshot
10.6.19.2 Product/Service Portfolio
10.6.19.3 Key Company Financials
10.6.19.4 SWOT Analysis
10.6.20 SK Siltron Co., Ltd.
10.6.20.1 Company Overview & Snapshot
10.6.20.2 Product/Service Portfolio
10.6.20.3 Key Company Financials
10.6.20.4 SWOT Analysis
11. Analyst Recommendations
11.1 SNS Insider Opportunity Map
11.2 Industry Low-Hanging Fruit Assessment
11.3 Market Entry & Growth Strategy
11.4 Analyst Viewpoint & Suggestions On Market Growth
12. Assumptions
13. Disclaimer
14. Appendix
14.1 List Of Tables
14.2 List Of Figures
Key Segments:
By Product
-
Optoelectronic Devices
-
Power Semiconductors
-
Frequency Devices
By Component
-
Schottky Diodes
-
FET/MOSFET Transistors
-
Integrated Circuits
-
Rectifiers/Diodes
-
Power Modules
-
Others
By Wafer Size
-
1 inch to 4 inches
-
6 inches
-
8 inches
-
10 inches & above
By End User
-
Automotive
-
Consumer Electronics
-
Aerospace & Defense
-
Medical Devices
-
Data & Communication Devices
-
Energy & Power
-
Others
Request for Segment Customization as per your Business Requirement: Segment Customization Request
REGIONAL COVERAGE:
North America
-
US
-
Canada
-
Mexico
Europe
-
Eastern Europe
-
Poland
-
Romania
-
Hungary
-
Turkey
-
Rest of Eastern Europe
-
-
Western Europe
-
Germany
-
France
-
UK
-
Italy
-
Spain
-
Netherlands
-
Switzerland
-
Austria
-
Rest of Western Europe
-
Asia Pacific
-
China
-
India
-
Japan
-
South Korea
-
Vietnam
-
Singapore
-
Australia
-
Rest of Asia Pacific
Middle East & Africa
-
Middle East
-
UAE
-
Egypt
-
Saudi Arabia
-
Qatar
-
Rest of the Middle East
-
-
Africa
-
Nigeria
-
South Africa
-
Rest of Africa
-
Latin America
-
Brazil
-
Argentina
-
Colombia
Request for Country Level Research Report: Country Level Customization Request
Available Customization
With the given market data, SNS Insider offers customization as per the company’s specific needs. The following customization options are available for the report:
-
Product Analysis
-
Criss-Cross segment analysis (e.g. Product X Application)
-
Product Matrix which gives a detailed comparison of the product portfolio of each company
-
Geographic Analysis
-
Additional countries in any of the regions
-
Company Information
-
Detailed analysis and profiling of additional market players (Up to five)
An accurate research report requires proper strategizing as well as implementation. There are multiple factors involved in the completion of good and accurate research report and selecting the best methodology to compete the research is the toughest part. Since the research reports we provide play a crucial role in any company’s decision-making process, therefore we at SNS Insider always believe that we should choose the best method which gives us results closer to reality. This allows us to reach at a stage wherein we can provide our clients best and accurate investment to output ratio.
Each report that we prepare takes a timeframe of 350-400 business hours for production. Starting from the selection of titles through a couple of in-depth brain storming session to the final QC process before uploading our titles on our website we dedicate around 350 working hours. The titles are selected based on their current market cap and the foreseen CAGR and growth.
The 5 steps process:
Step 1: Secondary Research:
Secondary Research or Desk Research is as the name suggests is a research process wherein, we collect data through the readily available information. In this process we use various paid and unpaid databases which our team has access to and gather data through the same. This includes examining of listed companies’ annual reports, Journals, SEC filling etc. Apart from this our team has access to various associations across the globe across different industries. Lastly, we have exchange relationships with various university as well as individual libraries.

Step 2: Primary Research
When we talk about primary research, it is a type of study in which the researchers collect relevant data samples directly, rather than relying on previously collected data. This type of research is focused on gaining content specific facts that can be sued to solve specific problems. Since the collected data is fresh and first hand therefore it makes the study more accurate and genuine.
We at SNS Insider have divided Primary Research into 2 parts.
Part 1 wherein we interview the KOLs of major players as well as the upcoming ones across various geographic regions. This allows us to have their view over the market scenario and acts as an important tool to come closer to the accurate market numbers. As many as 45 paid and unpaid primary interviews are taken from both the demand and supply side of the industry to make sure we land at an accurate judgement and analysis of the market.
This step involves the triangulation of data wherein our team analyses the interview transcripts, online survey responses and observation of on filed participants. The below mentioned chart should give a better understanding of the part 1 of the primary interview.

Part 2: In this part of primary research the data collected via secondary research and the part 1 of the primary research is validated with the interviews from individual consultants and subject matter experts.
Consultants are those set of people who have at least 12 years of experience and expertise within the industry whereas Subject Matter Experts are those with at least 15 years of experience behind their back within the same space. The data with the help of two main processes i.e., FGDs (Focused Group Discussions) and IDs (Individual Discussions). This gives us a 3rd party nonbiased primary view of the market scenario making it a more dependable one while collation of the data pointers.
Step 3: Data Bank Validation
Once all the information is collected via primary and secondary sources, we run that information for data validation. At our intelligence centre our research heads track a lot of information related to the market which includes the quarterly reports, the daily stock prices, and other relevant information. Our data bank server gets updated every fortnight and that is how the information which we collected using our primary and secondary information is revalidated in real time.

Step 4: QA/QC Process
After all the data collection and validation our team does a final level of quality check and quality assurance to get rid of any unwanted or undesired mistakes. This might include but not limited to getting rid of the any typos, duplication of numbers or missing of any important information. The people involved in this process include technical content writers, research heads and graphics people. Once this process is completed the title gets uploader on our platform for our clients to read it.
Step 5: Final QC/QA Process:
This is the last process and comes when the client has ordered the study. In this process a final QA/QC is done before the study is emailed to the client. Since we believe in giving our clients a good experience of our research studies, therefore, to make sure that we do not lack at our end in any way humanly possible we do a final round of quality check and then dispatch the study to the client.