Smart Home Market Report Scope & Overview:
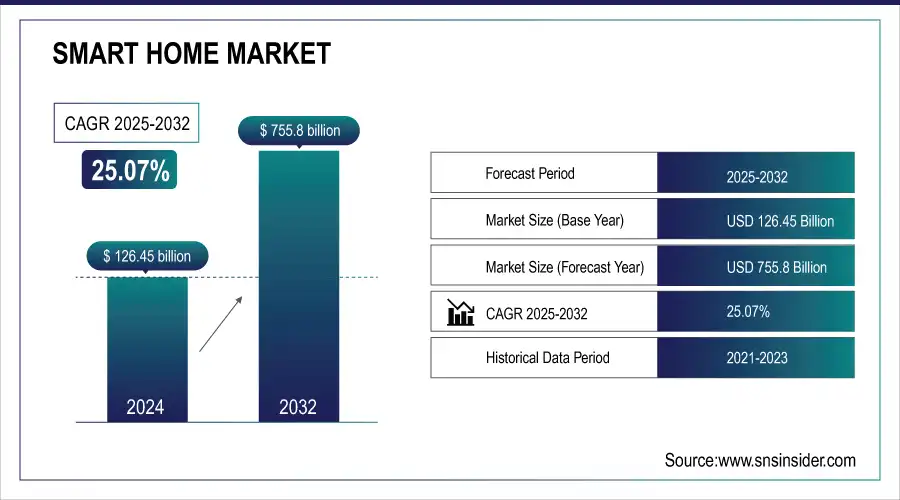
The Smart Home Market was valued at USD 126.45 billion in 2024 and is expected to reach USD 755.8 billion by 2032, growing at a CAGR of 25.07% from 2025-2032.
The Smart Home Market is emerging as a key player in transforming the residential technology space amid increasing consumer interest in home automation regarding comfort, security, and efficient energy consumption. Recently, there has been a rapid increase in the penetration and expansion of smart devices, including but not limited to smart thermostats, lighting, security cameras, and smart speakers in the home, largely due to the adoption of Internet of Things technologies in home automation. The rapid adoption of smart speakers is a clear sign of growth in the market. Based on recent data released by industry researchers, smart speaker installations will reach more than 300 million units globally by the end of 2024, indicating growing demand for voice-managed domestic ecosystems. A growing focus on energy-efficient solutions for both homes and offices has also intensified the use of smart thermostats, which sell at a 25% compounded annual growth rate in some areas. Moreover, the seamless blending of renewable energy systems, such as solar panel management, into smart home technologies is making them more attractive than before.
To get more information on Smart Home Market - Request Free Sample Report
Smart Home Market Size and Forecast:
-
Market Size in 2024: USD 126.45 Billion
-
Market Size by 2032: USD 755.8 Billion
-
CAGR: 25.07% from 2025 to 2032
-
Base Year: 2024
-
Forecast Period: 2025–2032
-
Historical Data: 2021–2023
Key Smart Home Market Trends:
-
Integration of AI and machine learning enhances predictive home automation, energy management, and personalized device control for consumers.
-
Adoption of IoT-enabled devices and smart hubs improves connectivity, interoperability, and seamless integration across multiple home appliances and systems.
-
Rising demand for voice-activated assistants and AI-powered control systems enables hands-free management of lighting, security, and entertainment solutions.
-
Growth of energy-efficient smart devices supports sustainable living, reduces utility costs, and aligns with environmental regulations.
-
Expansion of cloud platforms and edge computing enables real-time monitoring, remote control, and predictive maintenance of connected home devices.
-
Increasing focus on home security and surveillance systems strengthens protection, enables real-time alerts, and enhances consumer confidence.
-
Consumer-centric mobile apps and platforms facilitate personalized automation, remote management, and actionable insights for home efficiency and comfort.
The growing elderly populace in developed nations is also a key driver for the market, with smart home technologies being used for elder care. Remote health monitoring, fall detection, and numerous other features are becoming a lifesaver. An additional boost to the market is provided by the government plans to promote energy efficiency along with the schemes for the adoption of smart appliances. In the EU and the US, for example, subsidies for the rollout of smart meters and the take-up of energy-efficient devices are accelerating the number of take-up of smart devices.
The Smart Home Market will witness significant growth due to technological advancements, increasing levels of awareness among consumers, and government policies that have favorable conditions for the above situations. AI IoT and big data analytics will take this industry to a new level, leading automatic home solutions innovations to be hyper-personalized, predictive, and efficient, revolutionizing our modern lifestyle in the future.
Smart Home Market Drivers:
-
Innovations in wireless protocols like Zigbee, Z-Wave, and Wi-Fi 6 driving device connectivity.
The Smart Home Market is advanced due to wired communication protocols and due to recent innovations regarding Zigbee, Z-Wave, and Wi-Fi 6. Such protocols enable smooth interoperability of smart devices, enhancing consistent performance and compatibility across varied ecosystems. Zigbee, with its low-power consumption and support for multiple devices as a mesh network, is widely used in smart lighting, security, and home automation hubs. Likewise, Z-Wave provides a strong, low-latency connection, which works great for applications like door locks, thermostats, and sensors. Both are energy-efficient and are designed to work on noise-free, low-frequency channels, which is ideal for home. The newest generation in Wi-Fi technology offers faster speeds, increased network capacity, and reduced latency to improve smart home device performance. This helps when the number of devices connecting to your home is growing and needs networks plating acceptable numbers of data rainpours. Wi-Fi 6 also powers some special features such as the Target Wake Time that helps conserve battery life, which makes Wi-FI 6 ideal for battery-powered smart home devices. These innovations in wireless communication are an important step towards forming seamless and efficient smart home ecosystems. They are facilitating seamless interaction of devices and reducing various operational complexities thereby stimulating user experience in utilizing smart home technologies, resulting in increased demand across smart home ecosystem and accelerating market growth as a whole.
-
Increasing preference for convenience, energy efficiency, and enhanced security in residential spaces.
-
Growing adoption of IoT-enabled devices for seamless home automation and interoperability.
Smart Home Market Restraints:
-
Rapid technological advancements lead to obsolescence, increasing replacement costs for consumers.
Smart Home Market has fast-growing technology which tends to get obsolete, making it hard for consumers. Newer variants come with new features and improved connectivity and performance, leading to the rapid obsolescence of older models. The rapid innovation cycle means that consumers replace or upgrade their devices more quickly to keep up with the latest standard and performance level requirements. This is particularly concerning as new wireless protocols come out and we enter an Age of Exponential Technology. for instance, a Router that supports Wi-Fi 6 or Matter merchant device will have a hard time talking to older non-Veritec devices from when those protocols were just proposals on a clipboard.
And consumers may hesitate to dive deeper into smart home solutions if pricey subscription fees are required to eventually upgrade antiquated devices. With the high cost of many smart home products — hi, fancy thermostats, security cameras, and hubs! — the costly cycle of needing to upgrade can take a toll on house budgets, too. The issue is worsened by the absence of backward compatibility in some ecosystems, where end users have to replace multiple devices to keep the environment unified and compatible. This cycle of planned obsolescence affects the consumer by requiring them to continuously purchase updated versions of their Electronics and also creates a problem with electronic waste as all their previously owned devices become waste. Manufacturers need to solve these problems by designing durable devices, that are upgradable, backward compatible, and therefore can evolve with the technology. By providing software updates and modular hardware options, the product lifecycle can be extended, lowering the financial cost to the consumer and the ecological cost, while achieving sustainable growth within the smart home market.
-
Lack of standardization among devices and ecosystems creates interoperability challenges.
-
The need for technical expertise for setup and integration can discourage non-tech-savvy users.
Smart Home Market Segmentation Analysis:
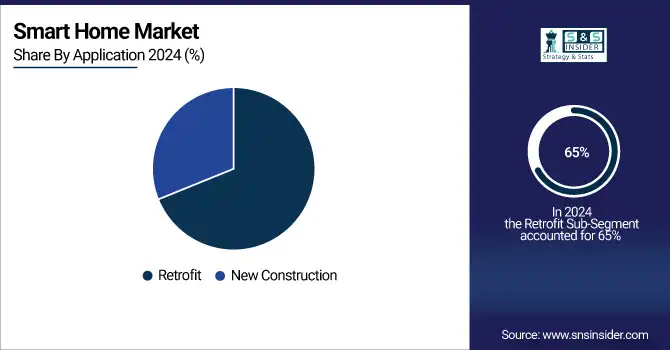
By Application, Retrofit Homes Lead Market Share While New Construction Drives Fastest Growth in Smart Home Adoption
The retrofit segment dominated the market and represented a revenue share of more than 65% in 2023, as there is a high demand for constructing smart technologies in existing homes without the need for innovative buildings. More and more homeowners are starting to retrofit their homes with the likes of thermostats, lighting controls, and security systems to make their pads more convenient, energy-efficient, and secure. This trend is driven by increasing energy prices and environmental awareness, opera deep retrofit solutions allow the process of saving energy and increasing sustainability. In addition to this, insane growth in this segment is because of government incentives for upgrading energy-efficient homes. With an increasing number of consumers looking for inexpensive methods to renew their homes, the retrofit market will continue to be a part of the business, maintaining a steady growth rate over the forecast duration.
The new construction segment is expected to witness the fastest CAGR throughout the forecast period from 2024 to 2032, due to the rise in adoption of smart home technologies in new homes. To meet the rising consumer demand for modern, tech-enabled living spaces, builders are incorporating smart devices like smart thermostats, lighting, and security systems into their projects. Smart cities and urbanization are also influencing the demand for connected homes in new developments. With consumers focusing on the need for convenience, energy efficiency, and sustainability, smart home technology is being included in more new construction. This segment is also likely to see accelerated growth, driven by innovations in construction technologies, and the growing popularity of smart, green homes.
By Protocol, Wired Protocol Dominates Smart Home Market, While Wireless Technologies Forecasted for Rapid Growth
The wired protocol segment dominated the market and accounted for a revenue share of more than 71% in 2023, due to the reliability and security it provides over wireless. Also known as Ethernet and powerline communication, wired systems offer stable, high-speed data transfer, making them suitable for applications that demand consistent performance, such as security systems, home automation hubs, and entertainment devices. With the advances in wireless technologies, they are picking up at the pro-level but in key branches of high-end installation where network reliability, and min… Due to consumers' preference for installing flexible, easy-to-implement, and cost-effective tools, this segment is going to grow at a slower rate than wireless technologies.
The wireless protocol segment is projected to register the fastest CAGR during the forecast period, as smart home installations are preferred in terms of convenience, and flexibility across the buildings. Wireless technologies, including Wi-Fi, Zigbee, Z-Wave, and Bluetooth, also reduce the need for extensive wiring, allowing easy configuration and scalability for IoT devices and reducing installation costs. This segment is primarily driven by the rapidly increasing adoption of IoT devices and the growing need for seamless connectivity in homes. Due to the introduction of wireless communication protocols including Wi-Fi 6, which significantly increases network performance and device compatibility, the wireless protocol segment is expected to experience rapid growth and widespread adoption in both retrofit and new construction applications.
Smart Home Market Regional Analysis:
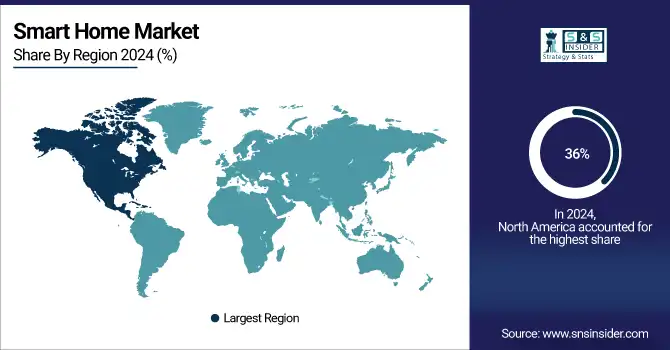
North America Dominates Smart Home Market in 2024
North America holds an estimated 36% market share in the Smart Home Market in 2024, largely due to high disposable incomes and strong consumer willingness to invest in connected technologies. The region benefits from widespread adoption of smartphones, high-speed internet, and IoT infrastructure, which facilitate seamless integration of smart home devices. Government incentives and energy-efficiency programs encourage homeowners to install smart thermostats, lighting systems, and security solutions. Combined with innovation from major tech companies and increasing awareness of convenience, safety, and energy savings, these factors drive robust market growth.
Get Customized Report as per Your Business Requirement - Enquiry Now
-
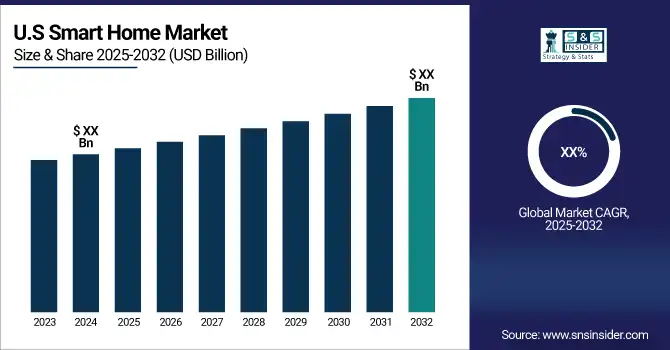
United States Leads North America’s Smart Home Market
The U.S. dominates due to widespread adoption of connected home technologies, energy-efficient solutions, and strong consumer awareness. Government incentives for energy-efficient upgrades, extensive high-speed internet coverage, and a mature IoT ecosystem encourage smart thermostat, lighting, and security device adoption. Major players like Amazon, Google, and Apple offer diverse smart home solutions, promoting convenience, safety, and automation. The combination of innovation, early tech adoption, and supportive infrastructure establishes the U.S. as the key contributor to North America’s smart home market.
Asia Pacific is the Fastest-Growing Region in the Smart Home Market in 2024
Asia Pacific is expected to grow at a CAGR of 28.5% in the Smart Home Market, fueled by rapid urbanization and rising middle-class incomes. Expanding residential infrastructure, smart city initiatives, and growing awareness of energy efficiency and home automation are driving consumers to adopt smart home devices such as thermostats, lighting controls, security systems, and voice assistants. Countries like China, India, and Japan are witnessing significant investments from both local and international tech companies, making smart home solutions more accessible, affordable, and integrated into everyday life, accelerating market expansion.
-
China Leads Asia Pacific’s Smart Home Market
China dominates due to massive urbanization, government-backed smart city projects, and growing disposable incomes. Increasing awareness of energy efficiency and convenience fuels demand for connected lighting, thermostats, and security systems. Local companies like Xiaomi and Huawei provide affordable, innovative smart home solutions, while collaborations with global technology providers expand device accessibility. Integration with IoT, voice assistants, and mobile apps enhances adoption. China’s focus on urban modernization, technological innovation, and large-scale smart device deployment positions it as the leading contributor to Asia Pacific’s smart home market.
Europe Smart Home Market Insights, 2024
Europe experiences steady growth in the smart home market, supported by energy efficiency initiatives, urban modernization, and rising IoT adoption. Germany’s stringent energy efficiency regulations encourage smart device installation, resulting in improved energy management and sustainability.
-
Germany Leads Europe’s Smart Home Market
Germany dominates due to strong consumer awareness, environmental regulations, and early adoption of smart devices. Widespread installation of smart thermostats, lighting, and security systems in retrofit and new construction projects supports growth. Collaboration between European manufacturers and global technology companies enhances accessibility of connected devices. Germany’s focus on sustainability, advanced infrastructure, and innovation drives widespread adoption of smart home solutions, establishing its leadership position in Europe’s market.
Middle East & Africa and Latin America Smart Home Market Insights, 2024
The smart home market in these regions is growing steadily, driven by urbanization, infrastructure development, and increasing awareness of energy-efficient technologies. In the Middle East, countries like the UAE and Saudi Arabia invest in smart city and commercial projects, increasing demand for connected security and automation solutions. In Latin America, Brazil and Mexico are modernizing residential and commercial infrastructure, driving smart device adoption. Partnerships with global technology providers and government initiatives accelerate deployment, making these regions emerging markets for smart home technologies.
Competitive Landscape for the Smart Home Market:
Amazon
Amazon is a U.S.-based global leader in smart home technology, offering products like the Echo smart speakers, Ring video doorbells, and Alexa-enabled devices. The company integrates AI and voice-controlled automation to create connected home ecosystems, enhancing convenience, security, and energy efficiency. Amazon operates direct-to-consumer through online platforms, providing seamless sales, installation guidance, and software updates. Its role in the smart home market is pivotal, as it combines cutting-edge technology with widespread consumer adoption, making smart homes accessible and user-friendly for millions of households worldwide.
-
In 2024, Amazon expanded its Echo lineup, introducing devices with improved voice recognition, energy management features, and enhanced home security integrations.
Google is a U.S.-based technology leader specializing in smart home solutions through its Nest product line, including smart thermostats, cameras, and speakers. Google integrates AI, machine learning, and voice control via Google Assistant to create intelligent home ecosystems, enhancing convenience, safety, and energy management. Operating globally, the company focuses on seamless device interoperability, software updates, and cloud-based services. Google’s influence in the smart home market is significant, driving adoption of connected devices and shaping consumer expectations for integrated, automated living environments.
-
In 2024, Google launched Nest devices with enhanced AI-driven energy efficiency, smarter home automation routines, and improved connectivity with third-party smart devices.
Apple
Apple is a U.S.-based leader in consumer electronics and smart home solutions, offering products like HomePod, HomeKit-enabled devices, and smart automation systems. Apple emphasizes seamless integration of hardware and software, focusing on user-friendly experiences, security, and privacy. Operating through direct-to-consumer channels and retail stores, Apple provides software updates, technical support, and ecosystem integration. Its role in the smart home market is essential, as it ensures interoperability across devices while maintaining high standards of design, security, and convenience for users worldwide.
-
In 2024, Apple introduced HomePod updates and new HomeKit-compatible devices with improved automation, enhanced Siri control, and advanced energy management features.
Samsung
Samsung is a South Korea-based multinational specializing in smart home technology, including SmartThings Hub, appliances, and connected devices. Samsung focuses on creating integrated home ecosystems, connecting lighting, security, HVAC, and appliances for convenience and efficiency. Through direct sales and global retail networks, Samsung delivers installation support, software updates, and device integration. Its role in the smart home market is substantial, driving adoption of connected devices, IoT interoperability, and AI-enhanced automation for energy efficiency and improved user experience.
-
In 2024, Samsung expanded SmartThings Hub compatibility with a wider range of devices, enhancing automation, connectivity, and voice-controlled functionality.
Smart Home Market Key Players:
-
Amazon
-
Google
-
Apple
-
Samsung
-
Philips
-
Honeywell
-
ADT
-
LG Electronics
-
Xiaomi
-
Ring
-
Bosch
-
Siemens
-
Legrand
-
Ecobee
-
Arlo Technologies
-
Nest
-
Belkin
-
Logitech
-
TP-Link
-
Wink Labs
|
Report Attributes |
Details |
|
Market Size in 2024 |
USD 126.45 Billion |
|
Market Size by 2032 |
USD 755.8 Billion |
|
CAGR |
CAGR of 25.07% From 2025 to 2032 |
|
Base Year |
2024 |
|
Forecast Period |
2025-2032 |
|
Historical Data |
2021-2023 |
|
Report Scope & Coverage |
Market Size, Segments Analysis, Competitive Landscape, Regional Analysis, DROC & SWOT Analysis, Forecast Outlook |
|
Key Segments |
• By Device Type (Safety & Security Access Control, Home Appliances, HVAC, Lighting Control, Smart Entertainment Devices, Smart Kitchen Appliances, Others) |
|
Regional Analysis/Coverage |
North America (US, Canada, Mexico), Europe (Eastern Europe [Poland, Romania, Hungary, Turkey, Rest of Eastern Europe] Western Europe] Germany, France, UK, Italy, Spain, Netherlands, Switzerland, Austria, Rest of Western Europe]), Asia Pacific (China, India, Japan, South Korea, Vietnam, Singapore, Australia, Rest of Asia Pacific), Middle East & Africa (Middle East [UAE, Egypt, Saudi Arabia, Qatar, Rest of Middle East], Africa [Nigeria, South Africa, Rest of Africa], Latin America (Brazil, Argentina, Colombia, Rest of Latin America) |
|
Company Profiles |
Amazon, Google, Apple, Samsung, Philips, Honeywell, ADT, LG Electronics, Xiaomi, Ring, Bosch, Siemens, Legrand, Ecobee, Arlo Technologies |
Frequently Asked Questions
Ans: The Smart Home Market was valued at USD 126.45 billion in 2024 and is expected to reach USD 755.8 billion by 2032.
Ans: The CAGR of the Smart Home Market during the forecast period is 25.07% from 2025-2032.
Ans: North America is expected to register the fastest CAGR during the forecast period.
Ans: Increasing preference for convenience, energy efficiency, and enhanced security in residential spaces.
Ans: Integrating travel and expense management software with existing enterprise systems can be time-consuming and complex.
Get in Touch
