Smart Irrigation Market Size & Overview:
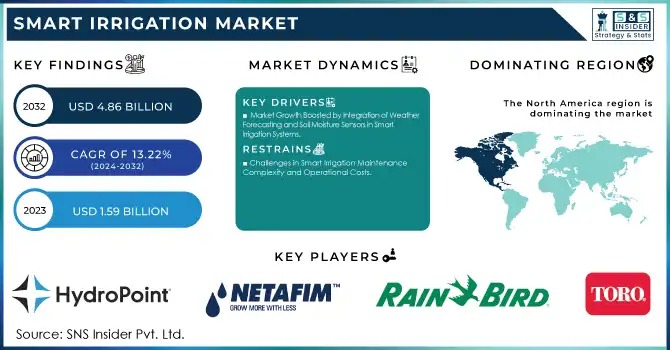
The Smart Irrigation Market size was valued at USD 1.59 billion in 2023 and is expected to grow to USD 4.86 billion by 2032 and grow at a CAGR of 13.22% over the forecast period of 2024-2032.
Get E-PDF Sample Report on Smart Irrigation Market - Request Sample Report
The global smart irrigation market is experiencing significant growth, driven by the rising adoption of precision agriculture technologies. Agriculture, which consumes about 70% of the world’s freshwater, is increasingly challenged by water scarcity and inefficient irrigation systems. Traditional irrigation methods not only waste water and nutrients but also lead to lower crop yields, food insecurity, and unnecessary carbon emissions. In response to these challenges, smart irrigation systems using IoT, AI, and sensor technologies are becoming crucial for optimizing water use, improving crop yields, and promoting sustainability.
For example, Full Nature Farms' Rocket 2.0 Smart Irrigation Platform, launched at CES 2025, reduces water costs by 30%, lowers energy consumption, and boosts crop yields. These systems help farmers by delivering water precisely when and where it's needed, using real-time data on weather, soil conditions, and crop needs, which is key for precision agriculture. Studies have shown the impact of smart irrigation on water conservation and crop productivity. In California, precision irrigation systems that use soil moisture sensors and data analytics reduced water usage by 20% while increasing crop yields by 12%. Similarly, an Australian precision irrigation project achieved a 30% reduction in water usage and a 20% increase in crop yields. The water conservation achieved by smart irrigation is particularly important as agriculture accounts for around 70% of global freshwater withdrawals. These systems can cut water consumption by up to 50% compared to traditional methods, helping to conserve this vital resource and reduce the environmental impact of farming. The increasing integration of advanced technologies such as machine learning, AI, and IoT into smart irrigation systems has been instrumental in driving market growth. This shift is supported by government incentives and subsidies that encourage the adoption of water-saving technologies. In terms of market expansion, the growing awareness among farmers about the long-term benefits of smart irrigation, such as reduced water and energy costs, improved crop yields, and sustainability, is contributing to widespread adoption.
Smart Irrigation Market Dynamics
Drivers
-
Market Growth Boosted by Integration of Weather Forecasting and Soil Moisture Sensors in Smart Irrigation Systems
The integration of weather forecasting models and soil moisture sensors is a pivotal market driver in the smart irrigation sector, revolutionizing water management practices. Advanced weather forecasting models, when combined with real-time data from soil moisture sensors, enable smart irrigation systems to make precise, data-driven adjustments. This dynamic combination ensures that irrigation is applied exactly when and where it's needed, drastically reducing water wastage and improving resource conservation. As the demand for sustainable agricultural practices rises, these systems help optimize crop yields while minimizing environmental impact. Furthermore, the integration of these technologies enhances the socio-economic benefits of agriculture, improving both water efficiency and food security, which are critical for future generations. With increasing awareness of the environmental benefits, such as reduced water and energy consumption, more farmers are turning to smart irrigation systems. These systems not only offer cost savings but also contribute to a greener, more sustainable future. The adoption of advanced technologies like weather forecasting models and soil moisture sensors represents a key shift in how irrigation is managed, empowering farmers to respond to fluctuating weather patterns and soil conditions.
Restraints
-
Challenges in Smart Irrigation Maintenance Complexity and Operational Costs
Smart irrigation systems, while offering significant benefits, also present challenges in terms of maintenance and operational complexity. These systems rely on a network of sensors, weather forecasting models, and IoT technologies that require regular calibration, monitoring, and maintenance to function optimally. Ensuring the accuracy and longevity of sensors and other components requires time, technical expertise, and regular checks. This increases operational costs, as skilled personnel are needed to manage and troubleshoot issues that arise. Additionally, the costs associated with maintenance, repairs, and software updates can be prohibitive, particularly for small-scale farmers with limited budgets or access to specialized technical support. When any part of the system malfunctions, it can lead to inefficiencies and potential water wastage, negating the benefits of smart irrigation. Consequently, the complexity and cost of upkeep may limit the widespread adoption of these systems in some agricultural sectors.
Smart Irrigation Market Segment Analysis
By System Type
The sensor-based segment holds a dominant share of approximately 61% in the smart irrigation market, driven by its ability to provide real-time data for optimized water usage. These systems integrate sensors that monitor soil moisture, weather conditions, and crop needs, enabling precise irrigation schedules that minimize water waste and improve efficiency. The growing demand for sustainable farming practices and the need for resource conservation have accelerated the adoption of sensor-based systems. They enable farmers to make data-driven decisions, leading to improved crop yields while reducing water consumption. Additionally, advancements in sensor technology, such as increased accuracy and cost-effectiveness, have further fueled the growth of this segment, making it a key driver in the smart irrigation market.
By Application
The agriculture segment dominates the smart irrigation market, accounting for around 35% of the market share in 2023. This dominance is primarily driven by the increasing need for efficient water usage in crop cultivation. Smart irrigation systems in agriculture allow farmers to monitor soil moisture, weather conditions, and crop water needs, optimizing irrigation schedules to reduce water waste and enhance crop yields. The rising demand for sustainable farming practices, coupled with the growing focus on resource conservation and climate change adaptation, has further accelerated the adoption of smart irrigation technologies in agriculture. As global food production continues to rise, the need for advanced irrigation systems in agriculture is expected to remain a key growth driver in the smart irrigation market.
Smart Irrigation Market Regional Outlook
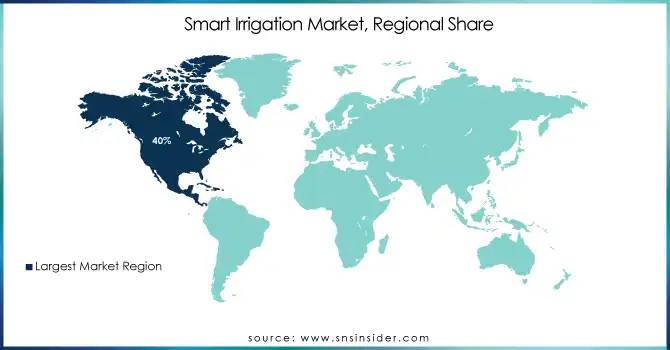
North America holds a dominant share of around 40% in the smart irrigation market in 2023, driven by significant technological advancements and a growing emphasis on sustainable water management. The region's adoption of smart irrigation systems is fueled by increasing water scarcity concerns, the need for efficient agricultural practices, and the availability of advanced technologies like IoT, AI, and sensor-based systems. In particular, the United States plays a key role in market growth, with farmers and commercial enterprises investing in smart irrigation solutions to optimize water usage and enhance crop yields. Government incentives, environmental policies, and rising awareness about water conservation further contribute to the region’s dominance. With a well-established infrastructure and a focus on Smart agriculture, North America is expected to continue leading the smart irrigation market in the coming years.
Asia-Pacific is projected to be the fastest-growing region in the smart irrigation market during the forecast period from 2024 to 2032. This growth is driven by increasing agricultural demand, rising water scarcity issues, and a rapid shift toward modern farming practices. Countries like China, India, and Australia are investing heavily in smart irrigation technologies to enhance water efficiency and boost crop productivity. The region’s large agricultural sector, combined with government initiatives and subsidies promoting sustainable water management, is accelerating the adoption of IoT, AI, and sensor-based irrigation solutions. As the demand for food increases alongside environmental concerns, the Asia-Pacific region is set to become a key player in the global smart irrigation market.
Get Customized Report as Per Your Business Requirement - Request For Customized Report
KEY PLAYERS
Some of the major key players in Smart Irrigation Market along with their product:
-
The Toro Company (Sprinkler systems, controllers, and precision irrigation systems)
-
Rain Bird Corporation (Irrigation controllers, valves, and drip irrigation systems)
-
Netafim (Drip irrigation systems, sprinklers, and automation solutions)
-
HUNTER INDUSTRIES INC. (Smart irrigation controllers, sprinklers, and rotors)
-
HydroPoint (Weather-based irrigation controllers and water management platforms)
-
Manna Irrigation Ltd. (Satellite-based irrigation management platforms)
-
Stevens Water Monitoring Systems Inc. (Soil moisture sensors and environmental monitoring systems)
-
Galcon (Smart irrigation controllers and irrigation valves)
-
Rachio Inc. (Wi-Fi-enabled smart irrigation controllers)
-
Weathermatic (Weather-based irrigation controllers and flow monitoring solutions)
-
Irrigreen (Digital sprinkler systems for precise water application)
-
Banyan Water, Inc. (Water management and data analytics solutions)
-
Delta-T Devices Ltd. (Soil moisture sensors and data loggers)
-
CALSENSE (Smart irrigation controllers and water-saving solutions)
-
AquaSpy (Soil moisture sensors and plant monitoring systems)
-
Soil Scout Oy (Wireless soil sensors for agriculture and sports fields)
-
Acclima, Inc. (Digital soil moisture sensors and irrigation controllers)
-
RainMachine – Green Electronics LLC (Wi-Fi-enabled smart irrigation systems)
-
WiseConn Engineering (Irrigation automation systems and sensors)
-
VALMONT INDUSTRIES, INC. (Center pivot irrigation systems and precision agriculture solutions)
List of suppliers in Smart Irrigation Market provide raw materials and components essential for manufacturing smart irrigation systems.
1. Raw Material Suppliers
-
SABIC
-
Dow Inc.
-
BASF SE
-
DuPont
-
Covestro AG
2. Sensor and Electronics Component Suppliers
-
Texas Instruments
-
STMicroelectronics
-
NXP Semiconductors
-
Bosch Sensortec
-
TE Connectivity
3. Pump and Valve Component Suppliers
-
Emerson Electric Co.
-
Pentair plc
-
Eaton Corporation
-
Kirloskar Brothers Limited
4. Battery and Power Supply Component Suppliers
-
Panasonic Corporation
-
LG Energy Solution
-
Enphase Energy
5. Software and IoT Module Suppliers
-
Qualcomm Technologies, Inc.
-
ARM Holdings
-
Semtech Corporation
6. Sensor Material and Component Suppliers
-
Sensirion AG
-
AMS AG
-
Honeywell International Inc.
7. Manufacturers of Piping and Drip Components
-
Advanced Drainage Systems, Inc.
-
JM Eagle
-
Netafim’s Partner Suppliers
Recent Development
-
November 7, 2024 – Netafim Italia has acquired 100% of Tecnir S.r.l., a leading irrigation system design and installation company based in Faenza. This acquisition strengthens Netafim Italia’s position as a leader in precision irrigation, expanding its range of advanced, sustainable irrigation solutions tailored to the needs of Italian farmers.
-
July 22, 2024 – Rivulis and Phytech have announced a strategic partnership to advance sustainable agriculture. As part of this collaboration, Rivulis' Manna operations will merge into Phytech, combining Rivulis’ irrigation solutions with Phytech’s real-time plant health and hydraulic monitoring technology, providing farmers with enhanced precision and efficiency in irrigation management.
| Report Attributes | Details |
| Market Size in 2023 | USD 1.59 Billion |
| Market Size by 2032 | USD 4.86 Billion |
| CAGR | CAGR of 13.22% From 2024 to 2032 |
| Base Year | 2023 |
| Forecast Period | 2024-2032 |
| Historical Data | 2020-2022 |
| Report Scope & Coverage | Market Size, Segments Analysis, Competitive Landscape, Regional Analysis, DROC & SWOT Analysis, Forecast Outlook |
| Key Segments | • By Component (Controllers, (Evapotranspiration) ET-Based, Soil Sensor-Based, Sensors, Soil Moisture Sensors, Temperature Sensors, Rain/Freeze Sensors, Fertigation Sensors, Others, Water Flow Meters, Others) • By System Type (Weather-based, Sensor-based) • By Application (Agricultural, Greenhouses, Open-fields, Non-Agricultural, Residential, Turf & Landscape, Golf Courses, Others |
| Regional Analysis/Coverage | North America (US, Canada, Mexico), Europe (Eastern Europe [Poland, Romania, Hungary, Turkey, Rest of Eastern Europe] Western Europe] Germany, France, UK, Italy, Spain, Netherlands, Switzerland, Austria, Rest of Western Europe]), Asia Pacific (China, India, Japan, South Korea, Vietnam, Singapore, Australia, Rest of Asia Pacific), Middle East & Africa (Middle East [UAE, Egypt, Saudi Arabia, Qatar, Rest of Middle East], Africa [Nigeria, South Africa, Rest of Africa], Latin America (Brazil, Argentina, Colombia, Rest of Latin America) |
| Company Profiles | Toro Company, Rain Bird Corporation, Netafim, Hunter Industries Inc., HydroPoint, Manna Irrigation Ltd., Stevens Water Monitoring Systems Inc., Galcon, Rachio Inc., Weathermatic, Irrigreen, Banyan Water, Inc., Delta-T Devices Ltd., CALSENSE, AquaSpy, Soil Scout Oy, Acclima, Inc., RainMachine – Green Electronics LLC, WiseConn Engineering, and Valmont Industries, Inc. |
| Key Drivers | • Energy Efficiency and Sustainability Driving the High-Frequency Transformer Market. |
| Restraints | • Impact of Electromagnetic Interference on High-Frequency Transformer Market Growth. |
Get in Touch
