Smart Irrigation Controllers Market Size:
Get more information on Smart Irrigation Controllers Market - Request Sample Report
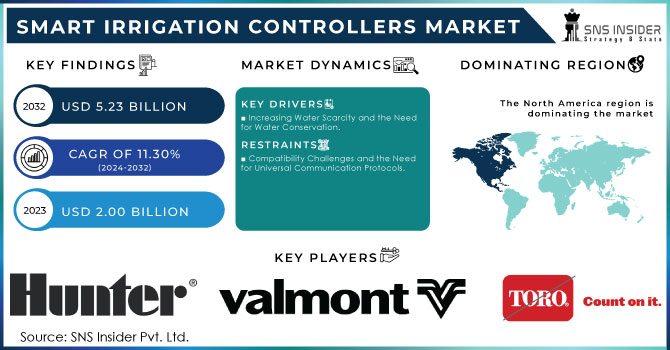
The Smart Irrigation Controllers Market size was valued at USD 2.00 Billion in 2023 and is expected to reach USD 5.23 Billion by 2032 and grow at a CAGR of 11.30% over the forecast period 2024-2032.
The smart irrigation controllers market is experiencing significant growth due to the increasing adoption of advanced agricultural technologies and the rising awareness of water conservation. Smart irrigation controllers are innovative devices that use real-time data and advanced algorithms to optimize water usage for irrigation. Water scarcity is increasingly affecting global populations, with over 2 billion people currently living in regions facing high water stress. Agriculture is the largest consumer of freshwater, accounting for around 70% of global usage, while industry and domestic use account for about 20% and 10%, respectively. The challenge of water scarcity is compounded by inadequate access to clean drinking water, with approximately 771 million people lacking access to safe water sources. Economically, water scarcity poses a substantial burden, with estimated global costs exceeding USD 500 billion annually. In agriculture, inefficiencies in irrigation systems result in the loss of 40% of water used. Urban areas are also heavily impacted, with over 1.2 billion people facing extreme water scarcity, a number likely to rise with growing urban populations. These systems are particularly beneficial in regions facing water scarcity, as they help in efficiently managing water resources by adjusting the irrigation schedule based on weather conditions, soil moisture levels, and plant needs.
Precision agriculture involves using technology to monitor and manage agricultural practices more accurately and efficiently. Around 65% of farms in the U.S. are estimated to use some form of precision farming technology. In 2023, the USDA’s Conservation Innovation Grants (CIG) program allocated around USD 27 million to projects focused on innovative conservation practices, which include precision agriculture technologies. Moreover, the Inflation Reduction Act, enacted in 2022, allocated USD 19.5 billion to the USDA for conservation and climate-smart agriculture practices. This funding is partly directed towards supporting precision farming practices that aim to improve soil health and reduce greenhouse gas emissions. Smart irrigation controllers play a vital role in this by providing farmers with detailed insights into soil moisture levels and weather forecasts, allowing them to make informed irrigation decisions.
Smart Irrigation Controllers Market Dynamics:
Drivers
-
Increasing Water Scarcity and the Need for Water Conservation.
Water scarcity is emerging as a global crisis due to a myriad of human activities and changes in environmental conditions. Freshwater supply is becoming limited, given the deleterious effects of climate change, increasing population, and urbanization. Currently, as the demand for freshwater rises, the world is experiencing a water scarcity crisis that calls for smart utilization of the available supplies. With agriculture being the biggest consumer of water, there is an increasing need for better ways of using the resource that will enhance efficiency and help conserve water while maintaining or increasing agricultural output. Smart irrigation controllers are essential systems that rely on the latest technology to control water usage. These tools have in-built water loss calculation functionalities, hence ensuring that an optimal water usage pattern is achieved. The controllers can be adjusted to apply only the right amount of water in precision areas hence avoiding water wastage on unproductive fields. Water conservation and efficient utilization of natural resources remain a critical feature in HVAC applications. As the world becomes increasingly aware of the need to conserve water and use it efficiently, the demand for these systems will continue to rise. Governments and environmentalist departments are actively rolled out creating awareness, providing subsidies, and enactment of legislation that will see the adoption of smart irrigation controllers in every homestead.
-
Government Initiatives Fuel Growth in Smart Irrigation Controllers Through Sustainable Agriculture Support.
Governments worldwide are increasingly concerned regarding the need for sustainable agricultural measures to address rising problems such as water conservation, environmental deterioration, and food scarcity. Therefore, governments in numerous countries have imposed guidelines and offered rewards to promote the adoption of water-efficient technology, smart irrigation controllers included. For instance, in the United States, the Environmental Protection Agency promotes the use of irrigation controllers which have passed the WaterSense labeling program. California’s Model Water Efficient Landscape Ordinance also encourages the use of smart irrigation technology. In Europe, the Common Agricultural Policy provides financial support for precision farming, smart irrigation included, with subsidies for precision farming totaling between fifteen and 52 euros per hectare. Such programs initiated by the government help to drive the demand for smart irrigation controllers. They facilitate the process and provide financial support to the farmers and landscapers, raising the demand for the technology. Moreover, the overall trend toward more sustainable farming is expected to further drive the demand for smart irrigation controllers.
Restraints
-
Compatibility Challenges and the Need for Universal Communication Protocols.
One crucial restraint in the smart irrigation controllers market is the concern about the compatibility of smart controllers with existing irrigation systems. Many farms and landscape territories use common irrigation systems, which are unlikely to be compatible with the latest smart controllers. In other words, farmers who use traditional irrigation technologies have to radically reconstruct their irrigation infrastructures to integrate the new technology. The reconstruction of existing irrigation facilities is both a cumbersome and expensive process. The absence of single standards of communication between an irrigation controller and other parts of the irrigation system. In other words, the absence of standard protocols and interfaces between the smart controllers and the rest of the system may lead to certain operational problems associated with both low efficiency and effectiveness of irrigation. As a result, the pace of smart controllers’ distribution may be relatively low in those regions where traditional irrigation is extensively used. To overcome this restraint, manufacturers need to focus on developing universal communication protocols, which can be used to easily integrate new controllers with the existing systems.
Smart Irrigation Controllers Market Segment Overview:
By Type
Weather-based controllers led the market in 2023 with more than 54% market share. The increasing focus on saving water and the incorporation of IoT technology continues to push for the use of weather-based controllers, establishing them as the top segment in the market. Their accurate water management practices minimize waste and promote sustainable agriculture, earning them popularity among both commercial and residential customers. For example, Rain Bird's weather-based controllers are commonly found in large agricultural fields, golf courses, and public parks, where accurate irrigation is crucial.
Soil-based controllers are expected to have a faster CAGR during the forecast period. The growing need for precision agriculture and the desire to improve water efficiency in various farming environments are driving the rapid expansion of soil-based controllers in the market. This technology is especially advantageous in regions with diverse soil types and conditions, as it enhances water efficiency and promotes robust plant growth. Toro's soil-based controllers are frequently utilized in vineyards and orchards, where soil moisture levels can greatly affect the quality of crops.
By End User
The agricultural segment held a major market share of more than 56% in 2023. Farmers and agricultural businesses are more and more turning to smart irrigation systems to improve crop production, save water, and lower labor expenses. These systems use real-time data to optimize irrigation schedules, ensuring precise water application to suit the specific requirements of various crops. Companies such as Netafim and Toro offer intelligent irrigation controllers designed for agricultural purposes, which can be seamlessly combined with drip irrigation systems and other advanced farming technologies. Due to the increasing focus on sustainable farming methods and the necessity to fulfill growing food needs, the agriculture sector is projected to see ongoing expansion.
The non-agriculture sector is going to have a rapid growth rate during 2024-2032. This section is positively impacted by the increasing recognition of the importance of sustainable water use in maintaining attractive green areas in cities dealing with water scarcity. Businesses such as golf courses, resorts, and office complexes are more and more using smart irrigation systems to maximize water efficiency and lower expenses. Hunter Industries Corporation provides sophisticated smart irrigation solutions designed for big non-agricultural areas. The need for this technology is increasing quickly due to the rise in urbanization, which is driving rapid growth in this sector.
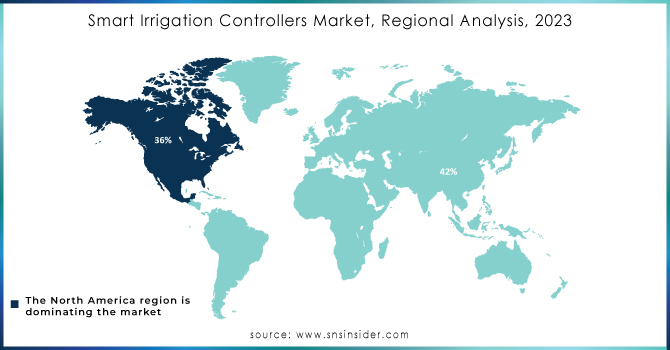
Smart Irrigation Controllers Market Regional Analysis:
North America dominated the market with more than 36% in 2023, primarily because of the region's extensive use of modern agricultural technologies and water conservation methods. The area's focus on sustainability and effective water management has resulted in a high need for smart irrigation systems, particularly in the United States and Canada. Major companies such as Rain Bird Corporation have created a powerful presence by offering innovative controllers that are connected with weather information and moisture sensors to improve irrigation timing. The increasing popularity of smart homes and connected devices is also driving the use of smart irrigation controllers in the area.
The APAC region is to experience the quickest growth rate during the forecast period 2023 in demand for smart irrigation controllers, driven by a rise in agricultural operations, fast urban development, and a growing focus on water conservation. Nations such as China, India, and Australia are at the forefront of implementing smart irrigation technologies, especially in extensive agriculture and horticulture. Netafim and Jain Irrigation Systems Ltd. are actively engaged in implementing smart irrigation solutions customized for the varied requirements of the APAC region. Smart irrigation controllers are becoming increasingly common in residential and commercial landscapes in urban areas due to the rising trend of smart cities.
Get Customized Report as per your Business Requirement - Request For Customized Report
KEY PLAYERS:
Some of the major players in the Smart Irrigation Controllers Market are HUNTER INDUSTRIES, Rain Bird Corporation, The Toro Company, Valmont Industries., Calsense, Galcon, Nelson Irrigation Corporation., Weathermatic, Lindsay Corporation, HydroPoint Data Systems, Netafim, Rachio Inc., Orbit Irrigation Products, Skydrop, and Weathermatic, & others.
RECENT TRENDS
-
In March 2024, Rain Bird introduced the ESP-LXIVM Series Controllers with advanced flow sensing technology. This series is designed for large commercial landscapes and includes features like station sequencing and cycle & soak options to prevent overwatering.
-
In January 2024, Hunter Industries launched the latest version of its Hydrawise PRO-HC smart irrigation controllers. The new models offer enhanced weather predictive capabilities, remote management via mobile app, and compatibility with Amazon Alexa for voice control.
-
In September 2023, Orbit introduced the B-hyve XR Smart Sprinkler Timer, which integrates hyper-local weather data and advanced flow monitoring. This model is designed for both residential and commercial use, offering voice control through Google Assistant and Alexa.
| Report Attributes | Details |
|---|---|
| Market Size in 2023 | USD 2.00 Billion |
| Market Size by 2032 | USD 5.23 Billion |
| CAGR | CAGR of 11.30% From 2024 to 2032 |
| Base Year | 2023 |
| Forecast Period | 2024-2032 |
| Historical Data | 2020-2022 |
| Report Scope & Coverage | Market Size, Segments Analysis, Competitive Landscape, Regional Analysis, DROC & SWOT Analysis, Forecast Outlook |
| Key Segments | • By Type (Weather-Based Controllers, Soil-Based Controllers) • By End User (Agriculture, Non-Agriculture) |
| Regional Analysis/Coverage | North America (US, Canada, Mexico), Europe (Eastern Europe [Poland, Romania, Hungary, Turkey, Rest of Eastern Europe] Western Europe] Germany, France, UK, Italy, Spain, Netherlands, Switzerland, Austria, Rest of Western Europe]), Asia Pacific (China, India, Japan, South Korea, Vietnam, Singapore, Australia, Rest of Asia Pacific), Middle East & Africa (Middle East [UAE, Egypt, Saudi Arabia, Qatar, Rest of Middle East], Africa [Nigeria, South Africa, Rest of Africa], Latin America (Brazil, Argentina, Colombia, Rest of Latin America) |
| Company Profiles | HUNTER INDUSTRIES, Rain Bird Corporation, The Toro Company, Valmont Industries, Calsense, Galcon, Nelson Irrigation Corporation, Weathermatic, Lindsay Corporation, HydroPoint Data Systems, Netafim, Rachio Inc., Orbit Irrigation Products, Skydrop, and Weathermatic |
| Key Drivers | • Increasing Water Scarcity and the Need for Water Conservation. • Government Initiatives Fuel Growth in Smart Irrigation Controllers Through Sustainable Agriculture Support. |
| Restraints | • Compatibility Challenges and the Need for Universal Communication Protocols |
Frequently Asked Questions
Ans: North America dominated the Smart Irrigation Controllers Market in 2023.
Ans: The Weather-Based Controllers segment dominated the Smart Irrigation Controllers Market.
Ans: Government initiatives fuel growth in smart irrigation controllers through sustainable agriculture support.
Ans: Smart Irrigation Controllers Market size was USD 2.00 Billion in 2023 and is expected to Reach USD 5.23 Billion by 2032.
Ans: The Smart Irrigation Controllers Market is expected to grow at a CAGR of 11.30% during 2024-2032.
Get in Touch
