Smart Waste Management Market Size & Trends:
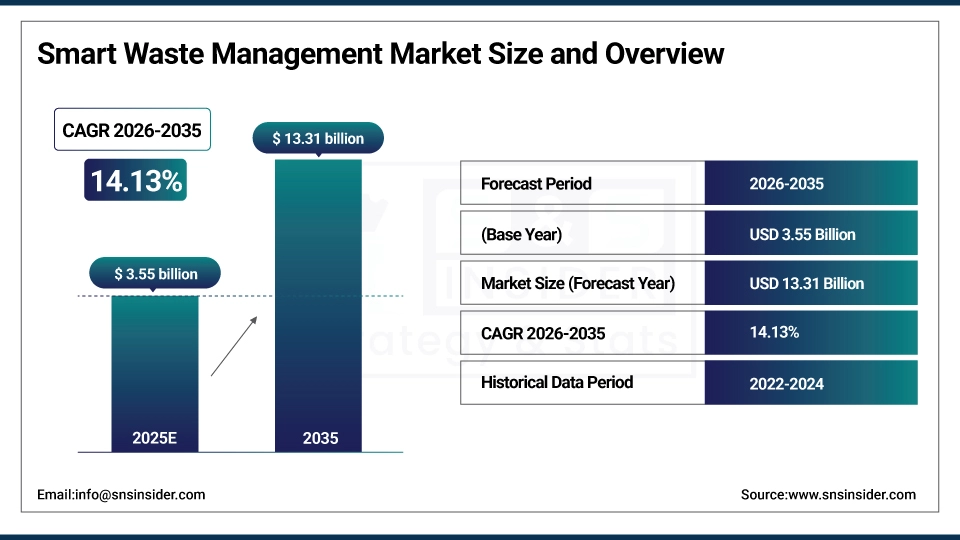
The Smart Waste Management Market Size was valued at USD 3.55 billion in 2025 and is expected to reach USD 13.31 billion by 2035 and grow at a CAGR of 14.13% over the forecast period 2026-2035.
The global Smart Waste Management Market is witnessing tremendous growth, fueled by the development of IoT, AI, and sensor technologies. These technologies are revolutionizing waste collection, sorting, and recycling operations, further improving efficiency, sustainability, and cost savings. Urbanization, along with surging environmental sustainability awareness, and government policies are major drivers of the adoption of smart waste management solutions globally.
Smart Waste Management Market Size and Growth Projection
-
Market Size in 2025: USD 3.55 Billion
-
Market Size by 2035: USD 13.31 Billion
-
CAGR: 14.13% from 2026 to 2035
-
Base Year: 2025
-
Forecast Period: 2026–2035
-
Historical Data: 2022–2024
To Get more information on Smart Waste Management Market - Request Free Sample Report
Key Smart Waste Management Market Trends:
-
Integration of IoT-enabled bins with fill-level sensors optimizes collection routes, reducing unnecessary trips, fuel costs, and emissions.
-
AI-powered waste analytics help forecast generation patterns, improve recycling efficiency, and support circular economy initiatives globally.
-
Smart fleet management systems with GPS and telematics streamline collection operations, lowering idle time, fuel usage, and maintenance costs.
-
Automation and robotics in sorting centers increase recycling rates and reduce manual handling of hazardous or bulky waste.
-
Blockchain adoption enhances transparency and traceability in hazardous, industrial, and medical waste management systems.
-
Government regulations and sustainability mandates drive adoption of smart recycling solutions and waste-to-energy technologies for greener urban ecosystems.
According to research, 65% of municipalities now prioritize smart waste management as part of their climate action strategies, with smart waste solutions capable of cutting operational costs by 20%–50%.
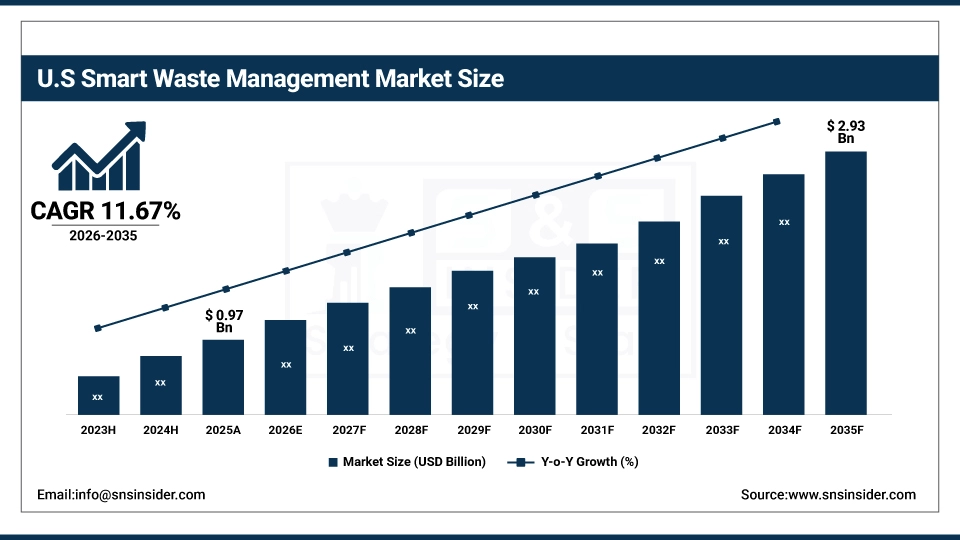
U.S. Smart Waste Management Market Size Outlook
The U.S. Smart Waste Management Market size was USD 0.97 billion in 2025 and is expected to reach USD 2.93 billion by 2035, growing at a CAGR of 11.67% over the forecast period of 2026–2035. The U.S. Smart Waste Management Market is transforming at a fast pace, fueled by the demand for smarter waste management techniques. Sensor technology improvements, data analytics, and automation are improving the efficiency of waste collection, sorting, and recycling. With urbanization and sustainability taking center stage, the market is implementing these innovative technologies to minimize waste and optimize resource management.
Smart Waste Management Market Drivers:
-
Rising Urbanization and Increasing Population Drive the Adoption of Smart Waste Management Solutions in Growing Cities
The increasing trend in population growth in cities and production of waste demands effective waste management technologies. The rise in urbanization and population, both require that cities adopt modern technology for the management of waste. Smart waste management technologies, such as Internet of Things-enabled trash bins and self-cleaning disposal vehicles, improve the handling of waste and keep urban areas tidy and sustainable. It is also fueling market growth as cities seek better and more efficient solutions for waste management.
- According to research, more than 70% of smart city projects incorporate smart waste management solutions in their infrastructure investments, with smart bins having the potential to cut waste collection expenses by as much as 40% and enhance operational efficiency by 20%–30%.
Smart Waste Management Market Restraints:
-
Limited Infrastructure and Connectivity in Rural Areas Challenge the Implementation of Smart Waste Management Solutions
While in urban and metropolitan regions, weak connectivity and unavailability of sufficient infrastructure are major restraints, which occur during the implementation of smart waste management technologies. The efficacy of IoT devices and real-time data tracking systems depends upon stable internet access and suitable infrastructure for waste collection. The incorporation of smart waste solutions becomes challenging, further hampering market growth and limiting the implementation of these technologies beyond the urban environment, when such type of conditions do not prevail in particular regions.
Smart Waste Management Market Opportunities:
-
Government Initiatives and Regulations on Waste Reduction Create Growth Opportunities for Smart Waste Management Solutions
There have been more and more stringent regulations for waste management, recycling and sustainability by governments across the world. These regulations are forcing enterprises to implement environmentally sound waste management policies. Incentives, subsidies, and public-private partnerships foster the investment in smart waste solutions. Due to increasing regulatory pressure, companies in the market have ample growth opportunities as they can offer smart solutions that help in achieving compliance and conservation targets and improve scope for the market.
- According to research, Cities including Singapore and Seoul have mandated IoT-based waste collection systems citywide, resulting in a 35% drop in waste collection inefficiencies.
Smart Waste Management Market Challenges:
-
Data Privacy and Security Concerns in IoT-Enabled Smart Waste Management Systems Pose Significant Challenges.
Since the intelligent waste management system is heavily dependent on the IoT devices to gather or sense the data and to forward the sensed data to the back-end systems, the data privacy and security are considered as one of the most important challenges. The proliferation of interconnected devices also leads to an increased potential of cyberattacks, data leaks, and unauthorized access to sensitive data. Strong cyber-security, data encryption and compliance with data protection laws is essential in order to inspire confidence in consumers and protect ongoing adoption of these technologies in the marketplace.
Smart Waste Management Market Segmentation Analysis:
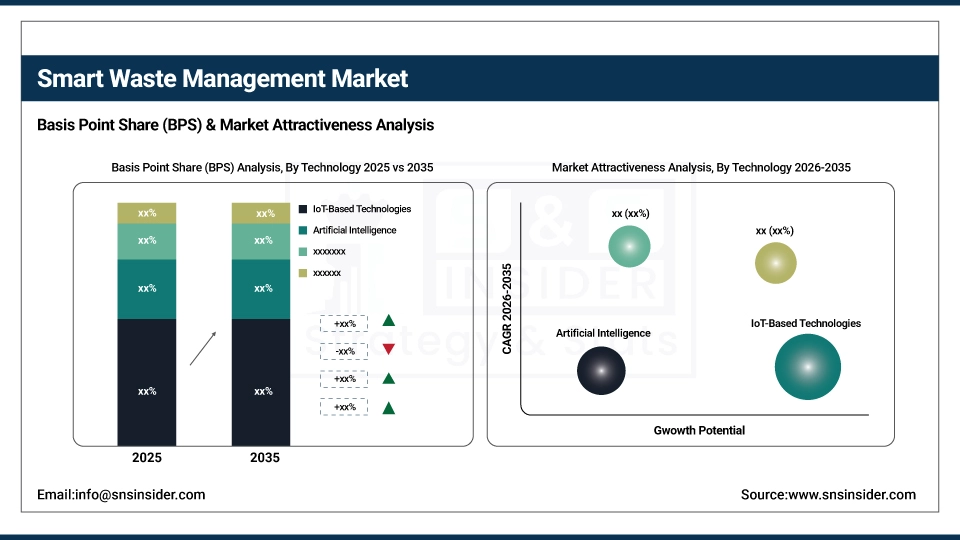
By Technology, IoT Leads, AI Emerging as Fastest-Growing Segment
The IoT-based technologies segment dominated the Smart Waste Management Market with a revenue share of 36.13% globally in 2025. Smart waste management companies as Ecube Labs have defined this segment with advancements including CleanCUBE, a solar-powered compactor bin fitted with fill-level sensors, and CleanCityNetworks, a real-time monitoring and route optimization platform. Such technologies have been implemented in more than 100 cities across the globe, improving the efficiency of operations and lowering costs of collection. IoT integration allows for data-based decision-making, simplifies waste collection and helps to make cities greener.
The Artificial Intelligence (AI) segment is expected to be the fastest-growing part of the Smart Waste Management Market with a CAGR of 15.30% during the forecast period of 2026-2035. Organizations such as ZenRobotics have developed AI-based waste-sorting robots, including ZenRobotics 4.0, which easily integrate with current systems to enhance recycling rates and operational efficiency. Likewise, CleanRobotics' TrashBot uses AI to sort recyclables accurately, refining waste management practices. The integration of AI technologies facilitates predictive analytics and automation, streamlining waste collection and processing, and achieving tremendous progress in sustainability and resource management.
By Waste Type, Solid Waste Dominates, Special Waste Grows Rapidly with Regulations
The Solid Waste segment dominated the Market with a share of 74.75% of the world's revenue in 2025. This is due to the large amount of municipal solid waste produced in cities. Organizations, such as Ecube Labs have revolutionized this segment with technology like CleanCUBE, a solar-powered compactor bin with fill-level sensors, and CleanCityNetworks, a real-time monitoring and route optimization platform. These technologies have found implementation in more than 100 cities globally, improving operational effectiveness and cutting collection expenses. The incorporation of such intelligent solutions is revolutionizing conventional waste management strategies, making them more efficient and sustainable.
Special Waste segment is anticipated to witness the highest CAGR of 16.78% during the period of 2025-2035 due to increasing awareness and stringent regulations pertaining to disposal of hazardous and medical waste. Players such as SUEZ and Clean Harbors have started rolling out offerings that use technologies including AI-powered waste tracking systems and automatic hazardous waste separation technology. These mechanisms ensure safe and compliant disposal of special waste products, preventing any potential hazard to the environment or non-compliance to regulations; thereby proliferating segment share in smart waste management market.
By Method, Smart Collection Leads, Smart Processing Gains Momentum
Smart Collection segment dominated the highest market share of 44.80% in 2025 contributing to its majority use in the urban waste handling. Technologies, such as the wireless sensors from the firm Enevo that monitor how full bins are and plot the optimum collection routes, have made a major dent in the sector’s inefficiencies. Cities are deploying the systems to eliminate unnecessary pickups, save on fuel and reduce emissions. It is this technology-led approach which is key to developing cleaner, more intelligent cities, and cements the sector’s leadership position in the market.
Smart Processing is expected to register the fastest growth CAGR of 15.33% during 2026-2035, with growing demand for intelligent, automated treatment systems for waste. Firms such as Waste Robotics have brought modular, AI-based systems optimized for individual material streams, enabling accurate and scalable waste sorting. These systems improve material recycling and minimize dependency on landfills. The high growth rate of the segment points to a larger smart waste management market trends toward efficiency and sustainability in waste processing through real-time data and automation.
By Source, Residential Segment Leads, Business Sector Expands Fastest
The residential segment dominated the smart waste management market share of 46.87% in 2025. This is due to growing waste generation within household properties in the urban areas and adoption of smart bins and IoT-based solutions in residential areas. Sensoneo, for instance, has installed ultrasonic fill-level sensors and route optimization software in several housing communities, enhancing the efficiency of collection and minimizing overflow. These developments transform residential zones as the prime location for smart waste infrastructure investment.
The business segment is to expand with the fastest CAGR of 15.29% over the forecast period 2026-2035. This high growth is underpinned by increased adoption of digital systems for tracking and managing waste across industries like hospitality, healthcare, and retail. SmartBin, for example, has introduced cloud-connected container monitoring systems that assist companies in streamlining waste management, enhancing compliance, and achieving sustainability objectives. Such developments render commercial establishments primary drivers of smart waste technology implementation in the next few years.
Smart Waste Management Market Regional Outlook:
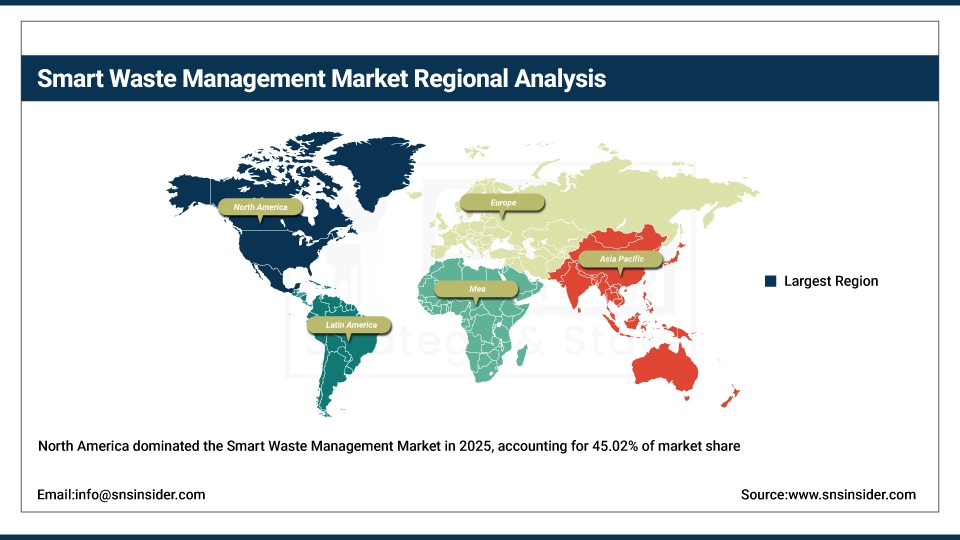
North America Dominates Smart Waste Management Market in 2024 with 45.02% Share
North America dominated the Market, accounting for 45.02% of the share in 2025, owing to its well-developed infrastructure and high adoption of new technologies. Organizations, such as Recycle Track Systems (RTS), have been at the forefront of utilizing AI-based waste sensor technology, such as Pello, as well as digital recycling platforms such as Cycle, to improve waste tracking and environmental sustainability efforts in the U.S. and Canada. In addition, Divert, Inc. has introduced RFID tracking and anaerobic digestion facilities that convert food waste to renewable energy, moving the region's trash services toward a more environmentally sound and sustainable waste management operation.
Get Customized Report as per Your Business Requirement - Enquiry Now
-
The U.S. leads the North America market on account of well-developed infrastructure, technology innovation, and the government’s support for sustainable waste management. The high concentration of population in the major cities means that there is a need for effective solid waste management, which translates to strong demand for solid waste management infrastructure and services.
Europe to be Fastest-Growing Smart Waste Management Market with 16.05% CAGR (2025–2035)
The Europe region is expected to fastest-growing during the forecast period of 2026-2035 with a CAGR of 16.05%. This expansion is guided by increasingly stringent environmental and sustainability regulations. Companies such as Enerkem are leading the way. The company is building plants in Spain and the Netherlands to transform non-recyclable waste into biofuels and renewable chemicals. SUEZ has also introduced the Asset Advanced digital platform to improve waste asset management through live data analytics. These projects demonstrate that Europe is taking a proactive stance on introducing smart technology into its waste services.
-
Germany has the largest market share for Market in Europe owing to its focus on sustainability, use of innovative recycling technologies, and stringent waste management policies. Its waste-to-energy projects and intelligent waste bins are an influencer for other European countries.
Asia Pacific Smart Waste Management Market Expands Rapidly with Urbanization and Green Regulations
The Asia Pacific Market is growing exponentially as a result of urbanization, green regulations, and increasing sustainability consciousness. Top countries such as China, Japan, and India are leading this expansion with the incorporation of new technologies, such as IoT-connected sensors, AI-based analytics, and waste-to-energy technology in residential, industrial, and commercial spaces.
-
China leads the Asia Pacific Market owing to its urbanization, robust government efforts, and significant investments in eco-friendly technologies. China's emphasis on environmental sustainability and extensive deployment of smart waste solutions has promoted high market leadership
Middle East & Africa and Latin America Accelerate Smart Waste Management Adoption
The Middle East & Africa (MEA) market is growing, and the UAE and Saudi Arabia are leading smart waste management adoption with smart cities and sustainability strategies. Latin America, also spurred by Brazil and Argentina, is rapidly concentrating on cutting-edge waste management solutions to overcome urban waste management and support recycling.
Competitive Landscape for Smart Waste Management Market:
Ecube Labs
The company Ecube Labs is a South Korean provider of smart waste management solutions, including solar-powered compactors, fill level sensors and digital monitoring platforms. The company designs, engineers and manufactures IoT-enabled systems CleanCUBE and CleanCityNetworks to optimize waste collection routes, cut down operational costs and increase recycling efficiency. Ecube Labs is a global company and provides services to cities, smartcities and commercial establishments. Its place in the smart waste management industry is crucial, bringing the kind of technology that changes traditional waste disposal into a data-driven, green and eco-friendly one.
-
In January 2025, Ecube Labs reported implementing its solutions in over 100 cities worldwide, demonstrating measurable improvements in waste collection efficiency and operational sustainability.
Bigbelly, Inc.
Bigbelly, Inc. is an American waste management company that has developed and markets a smart waste and recycling system, which integrates cloud computing with solar powered trash compactors and a wireless communications network. Its intelligent waste infrastructure is designed, developed and manufactured for municipalities, campuses, and commercial properties. Its contribution the smart waste market is important since it helps to decrease collection frequency, reduce operational cost and build cleaner urban cities.
-
In March 2025, Bigbelly’s solar-powered compactors equipped with real-time sensors were installed in major cities, enabling data-driven route optimization and sustainability improvements.
Enevo Oy
Company info Enevo Oy, a Finnish company, is the leader in sensor-based waste services and optimization solutions for the waste collection and recycling industry. Municipalities and waste operators use the company's software to streamline their collection routes, shrink fuel usage and minimise operating expenses. Its position within the smart waste management sector is core, as Enevo’s offering takes traditional waste operations and turns them into automated, smart and environmentally friendly services.
-
In February 2025, Enevo announced that its solutions improved collection efficiency by up to 30% in over 100 cities globally, demonstrating strong adoption of IoT technologies.
Smart Waste Management Companies are:
-
Bigbelly, Inc.
-
Enevo Oy
-
SmartBin (now part of Enevo)
-
Urbiotica
-
Compology
-
Sensoneo
-
Recycle Track Systems (RTS)
-
Covanta Holding Corporation
-
SUEZ
-
Veolia Environnement S.A.
-
Waste Management, Inc.
-
Republic Services, Inc.
-
Rubicon Technologies, LLC
-
Renewi PLC
-
ZenRobotics Ltd.
-
CleanRobotics
-
SmartBin Technology
-
Divert, Inc.
-
AMCS Group
| Report Attributes | Details |
|---|---|
| Market Size in 2025 | USD 3.55 Billion |
| Market Size by 2036 | USD 13.31 Billion |
| CAGR | CAGR of 14.13% From 2026 to 2035 |
| Base Year | 2025 |
| Forecast Period | 2026-2035 |
| Historical Data | 2022-2024 |
| Report Scope & Coverage | Market Size, Segments Analysis, Competitive Landscape, Regional Analysis, DROC & SWOT Analysis, Forecast Outlook |
| Key Segments | • By Waste Type (Solid Waste, Special Waste, E-Waste) •By Method (Smart Collection, Smart Processing, Smart Disposal) •By Source (Residential, Commercial, Industrial) •By Technology (IoT-Based Technologies, Artificial Intelligence, Cloud Computing, Smart Sensors) |
| Regional Analysis/Coverage | North America (US, Canada, Mexico), Europe (Germany, France, UK, Italy, Spain, Poland, Turkey, Rest of Europe), Asia Pacific (China, India, Japan, South Korea, Singapore, Australia,Taiwan, Rest of Asia Pacific), Middle East & Africa (UAE, Saudi Arabia, Qatar, South Africa, Rest of Middle East & Africa), Latin America (Brazil, Argentina, Rest of Latin America) |
| Company Profiles | Reworld, Republic Services, Veolia North America, BRE SMART Waste, Harvest Power, Recycle Smart Solutions, SENSONEO, Aspen Waste, IBM Corporation, Enevo Oy. |
Frequently Asked Questions
Ans: North America dominated the Smart Waste Management Market in 2025.
Ans: IoT-Based Technologies segment dominated the Jitter Attenuators Market.
Ans: The major growth factor of the Smart Waste Management Market is the increasing adoption of IoT and AI technologies for efficiency.
Ans: The Smart Waste Management Market size was USD 3.55 billion in 2025 and is expected to reach USD 13.31 billion by 2035.
Ans: The Smart Waste Management Market is expected to grow at a CAGR of 14.13% from 2026-2035.
Get in Touch
