Level Sensor Market Report Scope & Overview
Get More Information on Level Sensor Market - Request Free Sample Report
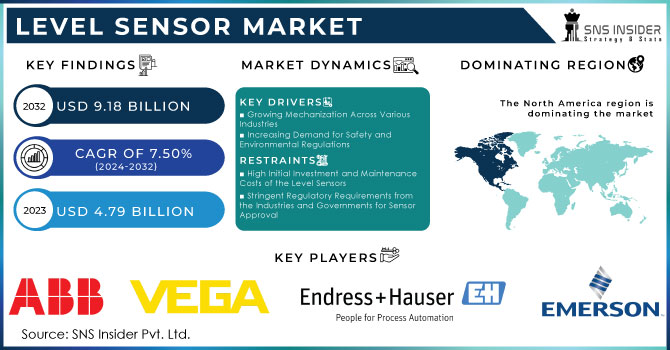
The Level Sensor Market Size was valued at USD 4.79 billion in 2023 and is expected to reach USD 9.18 billion by 2032 and grow at a CAGR of 7.50% over the forecast period 2024-2032.
The level sensor market has witnessed a substantial surge in the last decade regarding demand for a variety of industries like oil and gas, chemicals, pharmaceutical, and water and wastewater industry, among others. It measures the level of any liquid, solid, or granular material in a container by providing the needed data for controlling and automating the process. As the demand for such a market is continuously increasing, it can be assumed that the key factor contributing to its prominence is the need for accurate, reliable, and safe level measurement systems. Moreover, the tendency of sensor innovation has a significant effect on the market’s emergence. It has become apparent with the rising popularity of non-contact sensors and the incorporation of the Internet of Things and wireless communication. These advancements make sensors more useful and improve their convenience, reliability, and accuracy. In particular, Endress+Hauser introduced radar level sensors for the water and wastewater industry that were effective until the end of 2019 and the beginning of 2023. These sensors, called “Micropilot FMR10, and 20,” belong to the simplest of applications and are characterized by their use of Bluetooth. Therefore, they can be easily accessed with mobile devices and are in line with the trend of digitalization.
The growing implementation of Industry 4.0 principles and the Industrial Internet of Things (IIoT) is leading to a high demand for two-way communication, and smart sensors. Around, 63% of manufacturers have adopted industrial IoT manufacturing solutions during production. The newly introduced level sensor by Siemens, SITRANS LR240 has enhanced communication and connectivity. The feature seems to be the seamless adaptation to the customer’s needs that the firm has developed. Not only does it provide real-time communication, but the ultrasonic level sensor also boasts “self-optimizing algorithms to continuously analyze the received signal”. The implementation of such sensors ensures maximum value for the customer by providing continuous monitoring of process performance.
Over 550 oil and gas projects in North America will commence their operation between 2024 and 2028. About 83% of these projects are completely new, whereas the remaining 17% consist of upgrades. The use of level sensors is of utmost importance to ensure the safety and efficiency of the oil and gas boom in North America. They monitor the fill level of a wide range of liquid and gas substances present in tanks, pipelines, and other equipment. Some of the level sensors measure the levels of crude oil, natural gas, or water while others may detect oil-water or gas-liquid interface in separation vessels. Control systems are then adjusted to automate alerts, alarms, valve controls, and other system adjustments and decisions based on these instruments. Thus, level sensors are essential to ensure the safety, and efficiency of the oil and gas boom in North America.
Strict environment protection norms and a shift towards better water management are helping the deployment of Level Sensors in water distribution systems and sewage treatment plants. Efficient level measurement ensures proper resource usage and prevention of spillages, consequently keeping away adverse impacts on the surroundings. For instance, Honeywell has developed Smart Water Sensor, a wireless and ultrasonic technology-based sensor for continuously measuring water levels in tanks and large reservoirs. Further, the growing feasibility of sensors in smaller sizes and wireless technologies are providing new avenues for the Level Sensor Market. Their smaller size and wireless nature make them much easier to stack where space is a major constraint. Additionally, these sensors can be used for remote monitoring as well. These types of level sensors include Emerson Automation Solutions’ Rosemount Wireless Level Transmitters Series 3051.
Large corporations purchase smaller tech providers to broaden their product lines and enter new markets. For example, Emerson Automation Solutions acquired Aventics, a pneumatics expert, to expand its industrial automation solutions. The level sensor market belongs to the latter. This is a fast-developing commercial and industrial sector spurred by automation, nature protection legislation, and dynamic tech progress. Relatively new Industrial IoT, miniaturization, and the trend of switching to non-contact sensors influence the market field. Although there are some challenges, in general, the industry orients to the future due to the increasing demand for more rational management of resources and production processes.
MARKET DYNAMICS
Drivers
-
Growing Mechanization Across Various Industries
Automation is taking place in all the major sectors with increasing demand for level sensors. Level measurement is vital for all automation processes to run smoothly and safely. For instance, in manufacturing automated tasks include maintaining proper inventory of raw materials and output of finished products using a level sensor. This also ensures that the stocks would not run out and production processes would not be disturbed by overstock of products. Within the oil & gas industry, level sensors are used anywhere fluids are transported and stored. These sensors enable the management of the pressure, avoid spillovers, and provide frequent and efficient fluid extraction and shipment. In the food & beverage industry, level sensors are used to maintain constant filling levels in the product packages. The sensors prevent underfilling or overfilling the packaging for consistent product quality.
-
Increasing Demand for Safety and Environmental Regulations
Government safety and environmental regulations are getting strict, which forces industries to use advanced level sensors. A level sensor checks leakages in storage tanks containing chemicals, preventing them from leaking, and thereby saving the environment from contamination. The fuel level in the container is continuously monitored, thereby preventing dangerous spillages of flammable materials. The fuel dispensing in gas stations is done through the fuel level indication in the tanker. It can also equalize the offending agents’ level in industrial chimneys and sewage without spilling into the atmosphere, thereby reducing pollution. The increasing awareness among the people about protecting the environment and stringent rules in employing safety either in the office or in the residence demands the sensors to be developed at an advanced level.
-
Rising Demand for Smart Sensors and IIoT Integration
The rising inclination of IIoT integration fosters the demand for smart level sensors. Indeed, level sensors can send their data wirelessly, which brings about the benefit of real-time data monitoring and remote access. Some valuable application involves improved process control that relies on fast responses to possible deviations. Besides, using smart level sensors, the data can be collected not only for measuring the level but also for measuring other parameters with high importance, such as temperature and pressure, which can be processed to enhance the efficiency of operations and equipment use. Moreover, IIoT integration allows for remote transmission of data on the level that is monitored using the level sensor. Therefore, it provides centralized control and facilitates decision-making for the plant managers. Consequently, the continuous growth of the global IIoT market is supposed to provide a vast potential for the level sensor market as well.
Restraints
-
High Initial Investment and Maintenance Costs of the Level Sensors
Level sensors are beneficial in terms of efficiency and safety. However, the initial investment and maintenance costs are a constraint. The cost of advanced models is higher than the cost of basic level sensors. Advanced models are equipped with additional features, such as wireless connection and data analysis module, among others. Secondly, depending on the application and the type of sensor, installation can be complex and require specific knowledge. Moreover, tools used for calibration and verification of readings require additional costs. This can add to the regular maintenance cost. Therefore, the recurring costs of calibrating and usage can be burdensome for some businesses. More specifically, in certain fields or for small and medium enterprises, the benefits do not outweigh the costs. The food production industry is an example of such a field, as described by Kahr in 2018. Hence, the costs are one of the constraints to the wider adoption of the technology.
-
Stringent Regulatory Requirements from the Industries and Governments for Sensor Approval
One of the causes of the slowed adoption of innovative level sensor technologies is the strict regulatory requirements that some industries impose upon the approval of sensors. Sensors that are to be introduced within these industries are subjected to rather strict testing to guarantee that the sensor meets the safety and performance requirements of the specific industry. The approval process might be excessively time-consuming and long making the time taken to get a new sensor into the market very long. In addition, there are no standardized regulations that the manufacturer can work with making it hard for the manufacturers to work with the countries that have fewer regulatory processes in place. The countries must expedite approval processes and harmonize their approved level sensor technologies to facilitate the quick adoption of innovative technologies in all industries.
-
Concerns for cybersecurity and data breaches across industries
The increasing integration of level sensors raises the share of cybersecurity concerns. On the one hand, the use of the discussed devices becomes associated with particular risks. Level sensors collect and transmit sensitive data, and potential cyberattacks can breach the related information with many losses, including operational disruptions, financial costs, and reputational damages. Moreover, the integration of such sensors into various complex networks creates the premises under which hackers can attack to receive unauthorized access to sensitive data or manipulate sensor readings. On the other hand, the current level of cybersecurity awareness is low among many companies, and they fail to implement relevant measures. Still, sensor developers can encourage the use of secure solutions, including investments in cyber protection software, encryption protocols, and regular updates.
KEY MARKET SEGMENTS
By Technology
-
Contact/Point level
-
Non-contact/Continuous Level
The non-contact type segment accounted for the highest revenue share of 53.4% in 2023 and is expected to grow at the fastest CAGR. The market is witnessing the transition from contact type to non-contact type owing to their features including flexibility, less maintenance, and measurement accuracy. Non-contact/continuous level sensors are the electronic devices that generate the electromagnetic field for the level measurement. These sensors work faster and have better application flexibility. The non-contact type of technology is segmented based on photoelectric, capacitive, and ultrasonic sensors.
The contact Type segment is expected to grow at a substantial CAGR of 5.78% during the forecast period. Contact/point levels are the electrochemical devices used to detect the change in the object or target material by physically contacting them. Magnetostrictive, vibratory probes, hydrostatic, and magnetic float are a few of the contact types of sensors. Continuous Level Monitoring system is designed for the continuous-level measurement of liquid and solid materials in silos, bins, and sumps. The solid flow sensor is designed accordingly for the solid materials and to detect the solids material microwave technology has been used. Point-level switches/ pressure sensors are available to measure the level of solids, slurries, and liquid material. It is usually mounted on bins, hoppers, tanks, chutes, pipes, and vessels.
By Type
-
Magnetostrictive
-
Vibratory Probe
-
Hydrostatic
-
Magnetic & Mechanical Float
-
Pneumatic
-
Guided Wave
-
Ultrasonic
-
Microwave
-
Optical
-
Laser
-
Other
The Ultrasonic is the dominating segment by type with a market share of more than 20.10% in 2023. Since the ultrasonic pulses travel time to the surface of the substance and return to the source, the ultrasonic level sensors measure the material level. During the sensor installation, the block distance between the surface of the substance and the ultrasonic pulse is mainly considered.
The hydrostatic segment is the fastest-increasing segment with a steady CAGR during the forecast period. It can be submerged in the tank and as the water level rises, the pressure on the sensor increases. It then measures this pressure and converts it to a liquid level, such as gallons or meters. The control system enables this real-time data to be used for different applications. It can trigger a pump to refill the tank whenever the water level falls below the midpoint.
By Application
-
Automotive
-
Consumer Electronics
-
Healthcare
-
Industrial Process
-
Material Extrusion
-
Material Jetting
-
Binder Jetting
-
Sheet Lamination
-
Vat Photopolymerization
-
Powder Bed Fusion
-
Direct Energy Deposition
-
Oil & Gas
-
Dry Bulk
-
Others
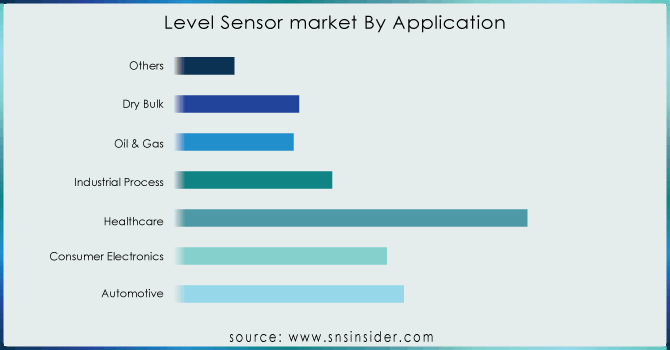
The industrial process segment contributed more than 27.68% in 2023 by becoming the dominating segment by application. The industrial process segment is gradually rising because of the growing number of industrial consumers who need programmable automation controllers. Level sensors are used to detect and control the levels of liquids as well as solids in industrial processes though some distance away provided that not everyone uses them, they have become increasingly important for barely one year since industries trouble after greater performance and safety.
Automotive is expected to witness the fastest CAGR of approximately 8.5%, in the automotive segment during the forecast years. The Automotive segment is expanding on the back of higher meaningful advanced safety features demand with the electric vehicle trend growing. Level sensors are used in many automotive applications, including fuel level sensing oil level sensing, or coolant level sensing.
Need any customization research on Level Sensor Market - Enquiry Now
REGIONAL ANALYSIS
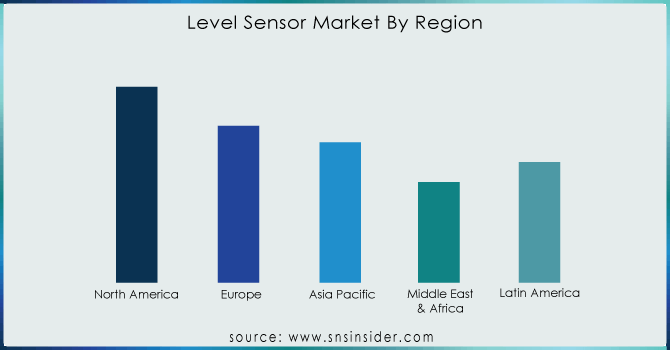
North America dominated the market and accounted for the largest part of the share, as it was 34.15% in 2023. The growth of the U.S. regional-level sensor industry is primarily driven by the growth of the adoption of various sensors in new cars. The U.S. EPA’s Air, Climate, and Energy research program has developed a research initiative to survey both O3 and NO2 low-cost sensors. The U.S. EPA works together with developers to evaluate the characteristics of such sensors.
The Asia Pacific is likely to raise at the fastest CAGR of 8.5% during the forecast period because of several semiconductor manufacturers placed in Korea, China, and Japan. Moreover, the growing concern about water and environmental management is likely to impact the market as well, as it is expected to grow over the forecast period.
The level sensor industry in Japan is likely to be driven by autonomous car technology, which is combined with the use of connected car technology. The market will be driven by better communication capabilities and the reduction in the size of the sensors. The growth in the industry of the level sensor will be affected by the government-driven initiatives in India – “Make in India” and “Digital India” because the demand for other consumer electronics, such as smartphones, in particular, is expected to grow in India.
REGIONAL COVERAGE:
North America
-
USA
-
Canada
-
Mexico
Europe
-
Germany
-
UK
-
France
-
Italy
-
Spain
-
The Netherlands
-
Rest of Europe
Asia-Pacific
-
Japan
-
South Korea
-
China
-
India
-
Australia
-
Rest of Asia-Pacific
The Middle East & Africa
-
Israel
-
UAE
-
South Africa
-
Rest of the Middle East & Africa
Latin America
-
Brazil
-
Argentina
-
Rest of Latin American
KEY PLAYERS
The Major Players are ABB, Emerson , Endress+Hauser, Vega Grieshaber KG , Siemens, Honeywell, AMETEK, Schneider Electric, TE Connectivity, Gems Sensors, Garner Industries, Bindicator, Magnetrol, OMEGA Engineering, MTS System Corporation, Pepperl+Fuchs GmbH, Senix Corporation and others are listed in the final report.
RECENT DEVELOPMENTS
-
June 2024: Baker Hughes introduced three new sensor technologies designed to enhance safety and productivity in various sectors. These sensors measure gas, flow, and moisture, catering to applications in oil and gas, hydrogen, and other industrial processes.
-
August 2023: BinMaster launched the BMRX-100 rotary level indicator, a robust electromechanical device specifically designed for solids and powder handling. The BMRX-100's lack of a printed circuit board makes it impervious to moisture and vibration, ideal for challenging industrial environments.
-
September 2023: VEGA revolutionized radar level measurement with the introduction of VEGAPULS sensors based on 80 GHz technology. This technology offers superior precision by focusing the radar beam more effectively, minimizing unwanted reflections and ensuring highly reliable level measurement. Tasks previously considered difficult for ultrasonic sensors are now easily achievable with VEGA's radar technology.
| Report Attributes | Details |
| Market Size in 2023 | US$ 4.79 Bn |
| Market Size by 2032 | US$ 9.18 Bn |
| CAGR | CAGR of 7.5% From 2024 to 2032 |
| Base Year | 2023 |
| Forecast Period | 2024-2032 |
| Historical Data | 2020-2022 |
| Report Scope & Coverage | Market Size, Segments Analysis, Competitive Landscape, Regional Analysis, DROC & SWOT Analysis, Forecast Outlook |
| Key Segments |
|
| Regional Analysis/Coverage | North America (USA, Canada, Mexico), Europe (Germany, UK, France, Italy, Spain, Netherlands, Rest of Europe), Asia-Pacific (Japan, South Korea, China, India, Australia, Rest of Asia-Pacific), The Middle East & Africa (Israel, UAE, South Africa, Rest of Middle East & Africa), Latin America (Brazil, Argentina, Rest of Latin America) |
| Company Profiles | ABB (Switzerland), Emerson (US), Endress+Hauser (Switzerland), Vega Grieshaber KG (Germany), Siemens (Germany), Honeywell (US), AMETEK (US), Schneider Electric (France), TE Connectivity (Switzerland), Gems Sensors, Garner Industries, Bindicator, Magnetrol, OMEGA Engineering, MTS System Corporation, Pepperl+Fuchs GmbH, Senix Corporation |
| Key Drivers |
|
| Restraints |
|
Frequently Asked Questions
North America is the dominating region in the Level Sensor Market.
The industrial process segment by application is dominating the Level Sensor Market.
The rise in demand for smart sensors and IIoT automation raises the growth of the Level Sensor Market.
The Level Sensor Market size was USD 4.79 billion in 2023 and is expected to Reach USD 9.18 billion by 2032.
The Level Sensor Market is expected to grow at a CAGR of 7.50%.
Get in Touch
