Gas Sensor Market Report Scope & Overview:
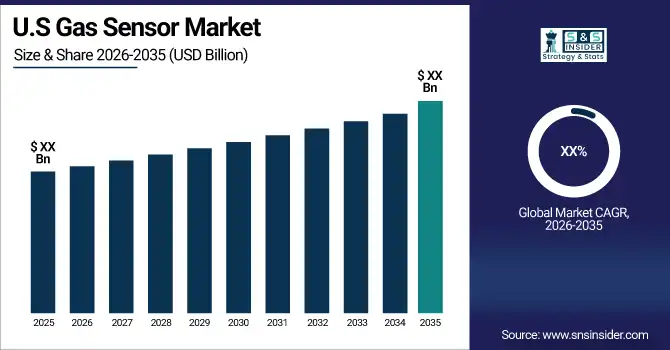
The Gas Sensor Market was valued at USD 2.07 billion in 2025 and is expected to reach USD 5.37 billion by 2035, growing at a CAGR of 9.05% from 2026-2035.
The gas sensor market significantly contributes to environmental monitoring and industrial safety. The measurement and detection of the presence of gases in different environments is done using gas sensors which are vital for safety, efficiency, and regulatory purposes. Stringent government regulations regarding air quality and emissions, and increased awareness of environmental and occupational safety issues are driving the adoption of these sensors. For example, adopting Euro 7 emission standards in the automotive industry has fuelled the requirement for sophisticated gas sensors for controlling and monitoring automotive emissions.
Advancements in sensor technologies, such as miniaturization, enhanced sensitivity, and incorporation of IoT functionalities are fueling the growth of the market. Gas sensors based on modern technology like metal oxide semiconductors or photoionization detection gas sensors are being miniaturized and efficiently designed to work in portable and wearable devices. One recent example of advancement in technology is gas sensors embedded in smart home devices for real-time monitoring of air quality.
Gas Sensor Market Size and Growth Projection:
-
Market Size in 2025: USD 2.07 Billion
-
Market Size by 2035: USD 5.37 Billion
-
CAGR: 9.05% from 2026 to 2035
-
Base Year: 2025
-
Forecast Period: 2026–2035
-
Historical Data: 2022–2024

To Get more information on Gas Sensor Marke - Request Free Sample Report
Gas Sensor Market Highlights:
-
A machine‑learning knowledge‑distillation approach significantly reduces sensor drift in electronic noses, improving long‑term reliability for industrial, healthcare, and environmental gas sensing applications.
-
Researchers have developed a novel acoustic topological material‑based sensor that detects helium leaks without chemical reactions, offering stable, fast, and low‑temperature operation, with the potential to localize leak direction.
-
The topological sensor design could be extended to detect other inert gases like hydrogen, broadening application areas in semiconductor manufacturing and medical systems.
-
Advanced materials like metal oxide semiconductors (MOSs), 2D materials, nanoparticles, and conducting polymers are key enablers in next‑gen gas sensors, improving sensitivity, selectivity, and IoT integration.
-
Research in heterostructure devices underscores ongoing innovation in nanostructured sensor materials and architectures for enhanced gas detection performance.
The growth of the gas sensor industry is supported by strong statistics. In 2023, sales of gas sensors for air quality monitoring increased by over 15% compared to 2022, driven by rising demand in polluted urban areas and stricter regulatory measures. Additionally, the use of gas sensors in healthcare for respiratory monitoring, as well as in ventilators and patient monitoring systems, saw a 20% annual increase. Overall, the gas sensor market is poised for continued growth, fueled by technological advancements, regulatory changes, and the increasing demand for improved air quality and safety monitoring. The evolution of sensor design and the rise of smart technologies will further drive new applications and market opportunities in the coming years.
Gas Sensor Market Drivers:
-
Integration of gas sensors in smart home devices for real-time air quality monitoring is gaining traction.
Rising consumer awareness about indoor air quality and the development of IoT-aided devices have become a significant market for gas sensors and gas sensors integrated into smart home devices have emerged as a noteworthy trend in the gas sensor market. These sensors, which can detect dangerous gases like carbon monoxide, nitrogen dioxide, and volatile organic compounds, are now built into smart devices such as air purifiers, thermostats, and ventilation systems, providing real-time monitoring and alerts to help homeowners enhance air quality and stay safe. The use of interconnected devices is becoming more common as people become more accustomed to smart home ecosystems designed to work together to provide higher levels of convenience and efficiency. For example, if a smart hub has a gas sensor that detects poor air quality, it could turn on an air purifier or balance the ventilation. The mobile apps have only boosted their popularity further, by allowing people to conveniently monitor and control them remotely.
Multi-functional gas sensors are being developed by industry stalwarts such as Honeywell and Bosch, which focuses on consumer-centric small and low-power gas sensors. In addition to this, increasing focus on health problems caused by substandard indoor air, like asthma and allergy, is pushing the uptake of such solutions even further.
Gas Sensor Market Restraints:
-
Gas sensors, especially those with continuous monitoring capabilities, can increase power consumption in portable and IoT devices.
Continuous monitoring of gas sensors is essential for the real-time detection of harmful gases, ensuring safety and compliance. However, this functionality often requires a constant power supply, which can impact the energy efficiency of portable and IoT devices. This is a significant concern in the gas sensor market, as high energy consumption affects the usability and adoption of battery-powered applications such as wearables, smart home devices, and portable air quality monitors. The need for sensors to remain active at all times for detection, signal processing, and data transmission, especially in IoT systems, further increases power demands. For example, gas sensors integrated into smart home devices need to frequently communicate with other devices and cloud platforms, which adds to the energy load.
Gas sensors, particularly those with continuous monitoring capabilities, can lead to higher power consumption in portable and IoT devices. For instance, typical gas sensors like electrochemical and metal oxide sensors consume around 10–100 mW during operation. Continuous monitoring, required in applications like air quality monitoring or healthcare, can cause a significant increase in energy demand, especially in battery-powered devices. In contrast, low-power alternatives such as semiconductor-based sensors can consume as little as 1–5 mW but may sacrifice some accuracy or sensitivity. The energy consumption of these sensors is crucial for the design of IoT systems, where power efficiency is essential for longer battery life. As a result, balancing sensor performance with power consumption remains a key challenge for device manufacturers.
Gas Sensor Market Segment Analysis:
By Product
The carbon dioxide sensors segment led the market in 2025 and represented a revenue share of more than 35%. Indoor air quality monitoring in homes, office buildings, automotive, healthcare, etc. are the major applications in the carbon dioxide sensors market. Several companies are working on MEMS-based carbon dioxide sensors, with applications in a wide range of industries.
The carbon monoxide sensors segment is expected to register the fastest CAGR during the forecast period. High incidences of deaths due to carbon monoxide poisoning are fuelling the demand for carbon monoxide sensors. The growth of the carbon monoxide sensors market is driven by the high workplace safety regulations by the government. As is well-known, carbon monoxide poisoning in the U.S. has prompted the government to implement mandatory carbon monoxide detectors in certain states. Therefore, certain US states including Connecticut, California, Maryland, Illinois, and Maine require school buildings to be fitted with a carbon monoxide detector.
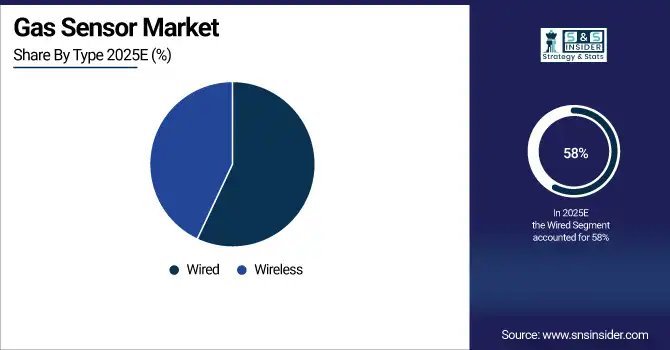
By Type
The wired segment dominated the market and accounted for more than 58% of the revenue in 2025. Wired gas sensors come with the advantages of being low maintenance, saving space, economical, and more accurate. In many circumstances, these tend to be the most reliable systems, which directly connect the sensor to the device reading the input and therefore, are recommended for application in a mine, oil rig, or nuclear power plant. The growing use of wired gas sensors in residential applications is also among the major contributors to the segment growth.
Wireless gas sensors are expected to register the fastest CAGR during the forecast period, High scalability and flexibility, cost-efficiency, and portability are the benefits offered by Wireless sensors cover many industries, including the petrochemical, manufacturing, and oil & gas industries. These sensors enable remote contaminant monitoring, Remote and base stations can be operated which will minimize the chance of leakage and explosion of hazardous gases in the oil and gas & gas sector.
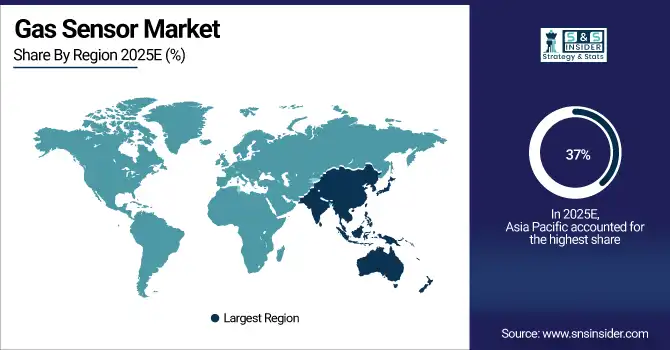
Gas Sensor Market Regional Analysis:
Asia-Pacific Gas Sensor Market Trends:
In 2025, Asia Pacific dominated the market and contributed over 37% of the total revenue. The increase in the urbanization in the region also increased the gas sensors demand. In addition, smart city projects are one of the main keys of the governments of the Asia Pacific region, which too possesses great growth opportunities for smart sensor devices.
Get Customized Report as per Your Business Requirement - Enquiry Now
Europe Gas Sensor Market Trends:
Europe is expected to register the fastest CAGR during the forecast period. The stringent norms concerning gas emissions and the compatible need for emissions surveys are anticipated to propel regional industry growth. All vehicle OEMs in Europe must offer gas sensor technologies to meet safety requirements. Stringent pollution control measures in Europe are expected to drive the adoption of gas sensors, especially in the automotive sector. Besides, the market growth is driven by the continuous development of high-end gas sensors by various regional market players.
North America Gas Sensor Market Trends:
North America holds a significant market share due to strong industrialization, advanced automotive safety regulations, and widespread adoption of IoT-based monitoring systems. The presence of key gas sensor manufacturers and growing demand for environmental monitoring solutions contribute to steady market growth.
Latin America Gas Sensor Market Trends:
The Latin America market is witnessing moderate growth, driven by industrial expansion, increasing energy sector investments, and government initiatives to monitor air quality. Adoption of gas sensors in oil, gas, and chemical industries is rising steadily.
Middle East & Africa Gas Sensor Market Trends:
Growth in the Middle East & Africa is fueled by expanding industrial infrastructure, petrochemical activities, and increasing focus on workplace safety. Governments are investing in smart monitoring systems, including gas sensors, to comply with safety and environmental regulations.
Gas Sensor Market Competitive Landscape:
Honeywell International Inc., established in 1906, offers a broad gas sensor and detection portfolio used in industrial safety, emissions monitoring, and environmental applications. Its products include the 1-Series and 4-Series gas sensors, advanced VC4 and Vertex continuous monitoring systems, and ultrasonic/leak detectors, delivering high sensitivity, reliable performance, and connectivity for fixed and portable gas detection solutions.
-
In Sept 2024: Honeywell Analytics launched the GasAlert Micro 5, a portable gas detection device designed for hazardous environments, enhancing user experience and data logging capabilities.
Teledyne Technologies Inc., founded in 1960s (as part of broader Teledyne group), offers a comprehensive portfolio of fixed and portable gas and flame detection products through its Teledyne Gas & Flame Detection division, including models from Detcon, Oldham, Simtronics, GMI and Scott Safety. Key products include toxic and combustible gas detectors, multi‑gas monitors (e.g., PS200), controllers, and rugged industrial sensors for safety, oil & gas, and environmental monitoring.
-
In Jan 2024: Teledyne introduced a new infrared sensor for its OLCT 100 XPIR fixed gas detector, enhancing stable and reliable methane detection measurements for industrial, utility, and laboratory markets.
Gas Sensor Market Key Players:
-
Honeywell
-
Bosch
-
MSA Safet
-
Amphenol Advanced Sensors
-
Alphasense
-
Sensirion
-
City Technology
-
Dynamen
-
Process Sensing Technologies
-
ams‑OSRAM
-
MEMBRAPO
-
Drägerwerk
-
Siemens
-
Sensit Technologies
-
Teledyne Technologies
-
Yokogawa Electric
-
ABB
-
Nemoto
| Report Attributes | Details |
|---|---|
| Market Size in 2025 | USD 2.07 Billion |
| Market Size by 2035 | USD 5.37 Billion |
| CAGR | CAGR of 9.05 % From 2026 to 2035 |
| Base Year | 2025 |
| Forecast Period | 2026-2035 |
| Historical Data | 2022-2024 |
| Report Scope & Coverage | Market Size, Segments Analysis, Competitive Landscape, Regional Analysis, DROC & SWOT Analysis, Forecast Outlook |
| Key Segments | • By Product (Oxygen (O2)/Lambda Sensors, Carbon Dioxide (CO2) Sensors, Carbon Monoxide (CO) Sensors, Nitrogen Oxide (NOx) Sensors, Methyl Mercaptan Sensor, Others) • By Type (Wireless, Wired) • By Technology (Electrochemical, Semiconductor, Solid State/MOS, Photo-ionization Detector (PID), Catalytic, Infrared, Others) • By End-Use (Medical, Building Automation & Domestic Appliances, Environmental, Petrochemical, Automotive, Industrial, Agriculture, Others) |
| Regional Analysis/Coverage | North America (US, Canada), Europe (Germany, UK, France, Italy, Spain, Russia, Poland, Rest of Europe), Asia Pacific (China, India, Japan, South Korea, Australia, ASEAN Countries, Rest of Asia Pacific), Middle East & Africa (UAE, Saudi Arabia, Qatar, South Africa, Rest of Middle East & Africa), Latin America (Brazil, Argentina, Mexico, Colombia, Rest of Latin America). |
| Company Profiles | Honeywell, Bosch, Figaro Engineering, MSA Safety, Amphenol Advanced Sensors, Alphasense, Sensirion, City Technology, Dynament, Edinburgh Sensors, Process Sensing Technologies, ams‑OSRAM, MEMBRAPOR, Drägerwerk, Siemens, Sensit Technologies, Teledyne Technologies, Yokogawa Electric, ABB, Nemoto. |
Frequently Asked Questions
The Gas Sensor Market was valued at USD 2.07 billion in 2025 and is expected to reach USD 5.37 billion by 2035, growing at a CAGR of 9.05% from 2026-2035.
The CAGR of the Gas Sensor Market during the forecast period is 9.05% from 2026-2035.
The Asia-Pacific dominated the market with significant revenue share in 2025.
Growing awareness of occupational safety necessitates gas sensors for detecting hazardous gases in industrial environments.
Advanced gas sensors with IoT integration and enhanced sensitivity are expensive, limiting their adoption in cost-sensitive markets.
Get in Touch
