Spectral Reflectometer Market Insights:
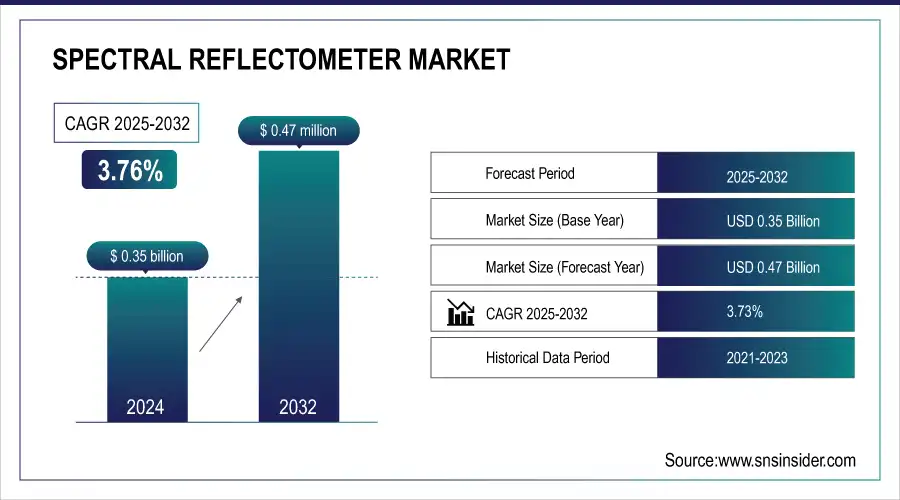
The Spectral Reflectometer Market size was valued at USD 0.35 billion in 2024 and is projected to reach USD 0.47 billion by 2032, growing at a CAGR of 3.73% during 2025-2032.
To Get more information On Spectral Reflectometer Market - Request Free Sample Report
The spectral reflectometer market is growing rapidly due to the optical measurement techniques advances and increasing demand of accurate material analysis in various sectors. Some of the major factors driving the market’s growth are increasing demand for accurate surface reflectivity measurement in the semiconductor industry, growing solar energy industry, and high demand from the automotive and smartphone industries. The efficiency and portability of spectral reflectometer are being improved with the increased use of new technologies (miniaturization, AI, and automation), broadening the applicability of spectral reflectometers. Furthermore, growth in industrial automation and environmentally friendly trends is propelling market growth. The future of the market seems bright with the innovations of technologies and applications in different industries.
KLA Corporation sponsored a study on resistivity metrology for sputtered ITO thin films, emphasizing their role in semiconductor devices. The research focused on how variations in film thickness and deposition conditions affect resistivity and device performance.
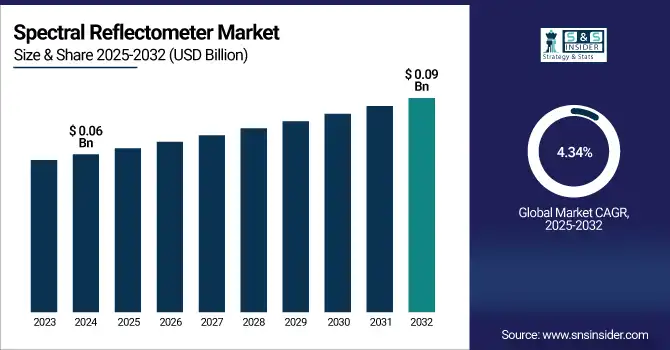
The U.S. spectral reflectometer market size was valued at USD 0.06 billion in 2024 and projected to reach USD 0.09 billion by 2032 expanding at a CAGR of 4.34%, driven by the increasing demand for high-precision optical measurements, improvements by thin-film technology, as well as growing adoption in industries such as semiconductor, photovoltaic, and advanced material inspection to guarantee product quality and performance.
Spectral Reflectometer Market Dynamics:
Drivers:
-
Increasing Demand for Accuracy in Thin-Film Applications to Boost Growth of the Spectral Reflectometer Market
A primary driver in the Spectral Reflectometer market is the growing need for high precision, non-destructive measuring apparatus in thin-film markets, such as solar cells, displays and biomedical devices. Real-time film-thickness measurements and refractive index measurements use of a reflectometer that can provide accurate information of the film thickness and uniformity, and this reflectometer is essential for maximizing the device efficiency and device quality. In the production process of solar cells, particularly in materials, such as indium tin oxide (ITO), an exact reflect metric monitoring is used to ensure the optimal layer thickness for the best use of the light and hence of the energy. Biomedical science in biomedical applications, spectral reflectometry is a technique that is used to improve the accuracy of diagnostic methods, where it provides a detailed analysis of the surface composition of biofilms or tissues. This need for efficient tools is expected to drive the growth of the spectral reflectometer market in different applications and industries.
In 2024, the U.S. solar industry installed nearly 50 gigawatts (GWdc) of capacity, a 21% increase from 2023. Solar accounted for 64% of new electricity-generating capacity added to the U.S. grid. This growth underscores the need for advanced technologies, such as spectral reflectometer to maintain high production standards and ensure efficiency in solar cell manufacturing.
Restraints:
-
Technological Advancements in Materials Create Barriers for Spectral Reflectometer Market Growth
The spectral reflectometer industry faces growing challenges due to evolving demands in solar cells, displays, and biomedical devices. As these sectors innovate with new materials and manufacturing techniques, reflectometers must adapt rapidly to maintain measurement accuracy, precision, and compatibility, pushing the industry toward continual technological advancement and greater application versatility. For instance, new generations of solar cells, such as perovskite-based cells and next-gen transparent conductive films require higher levels of precise measurement to ensure top performance. This continual requirement for updating and amending renders the process significantly more expensive for manufacturer and user, and becomes a block to widespread market implementation. In addition, the new-material induction into the old measurement systems makes the spectral reflectometers difficult to scale and to be efficient to limit the expansion of the market.
Opportunities:
-
Unlocking Growth Opportunities in Biomedical Sensing with Spectral Reflectometer for Healthcare
The expansion of spectral reflectometer in biomedical sensing offers significant opportunities for growth in the healthcare sector. These tools allow for a detailed surface characterization of biological materials and tissue samples, as a consequence of which diagnostic capabilities are improved. As spectral reflectometer supply extremely detailed information about the thickness, refractive index and uniformity of biological samples they facilitate enhanced studies in medical diagnostics including disease detection, tissue health monitoring and treatment responses.
For instance, in the field of tissue engineering and cancer research, there is a need for accurate reflect metric measurements to gain insights into tissue performance and to aid in the development of more efficient treatments. With abundant applications of the spectral reflectometer in biomedical sensing as advanced technology are being adopted by the healthcare industry, an increase in adoption of the spectral reflectometer is anticipated, leading to market growth and innovation in treatments and medical diagnostics market.
Challenges:
-
Operational Complexities and Environmental Sensitivities Limit Spectral Reflectometer Effectiveness
Spectral reflectometers are of fundamental importance to the determination of accurate surface properties, but they suffer from a number of limitations that prevent widespread use. The complexity of calibration is one significant drawback of these instruments, which must be carefully aligned and have a stable reference standard to yield accurate measurements. The integration with different materials, in particular non-homogeneous or rough surfaces adds a further challenge, which typically requires tailored modifications or software compensation at that. High initial and maintenance costs can make this option less attractive for some smaller research labs or industries as well. The need of expertise for the analysis of complex spectral data also restricts the access. Overall, both of these factors affect the reliability, scalability, and cost-effectiveness of spectral reflectometry in a wide spectrum of applications.
Spectral Reflectometer Market Segment Analysis:
By Type
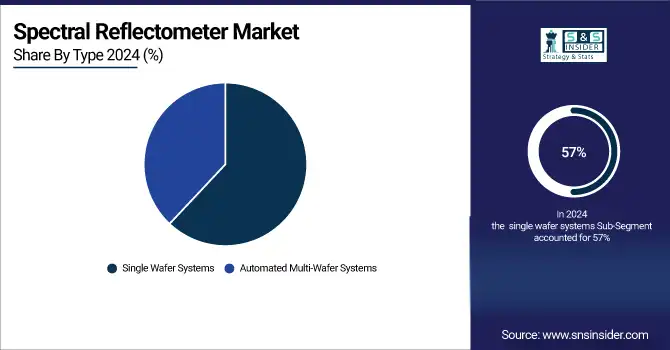
The single wafer systems segment held a dominant spectral reflectometer market share of around 57% in 2024. due to their accuracy, controlled process and applicability to future semiconductor fabrication. The systems that can manipulate single wafers are more precision and Class 1semiconductor applications type.
The automated multi-wafer systems segment is expected to witness the fastest growth in the spectral reflectometer market over 2025-2032, with a CAGR of 6.52%. The growth is driven by the growing adoption in quality control, surface inspection, and coating thickness measurement in advanced materials and intelligent surfaces in today s vehicles, including electric and autonomous models.
By Application
The electronics & semiconductors segment held a dominant spectral reflectometer market share of around 62% in 2024, due to the extensive utilization of chemicals and ultrapure water in the industry. The chip fabrication processes in this field faced increasing stringent environmental regulations and the demand for advanced treatment solutions substantially increased for some cutting-fluid and abrasive-containing wastewater in the chip fabrication process.
The automotive segment is projected to grow fastest in the spectral reflectometer market from 2025 to 2032, with a CAGR of 5.90%, due to rising adoption in quality control, surface inspection, and coating thickness measurement for advanced materials and smart surfaces in the automotive industry, specifically electric vehicles (EVs) and autonomous vehicle models.
Spectral Reflectometer Market Regional Outlook:
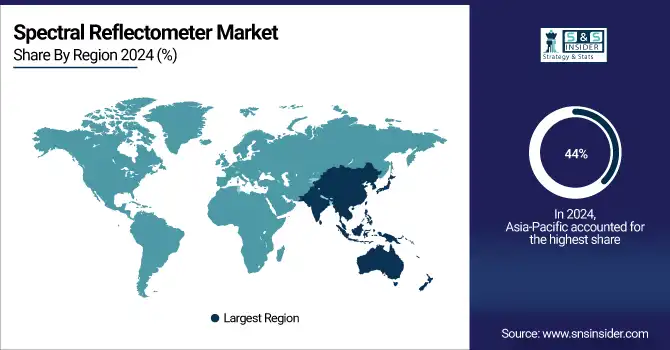
In 2024, the Asia Pacific dominated the spectral reflectometer market and accounted for 44% of revenue share, owing to the fast growth of semiconductor industry in the region, strong electronics manufacturing clusters in countries, such as China, Taiwan, and South Korea, and unparalleled investment in high-end metrology tools. Growing government funding and increasing demand for high precision inspection technology also contributed to regional growth.
Get Customized Report as per Your Business Requirement - Enquiry Now
In Asia Pacific region, China dominated spectral reflectometer market, driven by its strong semiconductor industry, government support, and rising demand for precision tools.
North America is projected to register the fastest CAGR of 5.35% during 2025-2032, attributing to enormous innovation taking place in the region advancing technology. The U.S. leads the country, led by strong semiconductors & electronics and rigorous investment in R&D with the growing demand for precise measurement technology.
In 2024, Europe emerged as a promising region in the spectral reflectometer market, the region witnessed a significant demand for spectral reflectometers, owing to the rising production of semiconductors, technological progress in precision measurement, and rising demand from the automotive, and electronics sectors. Innovation in the R&D resources, along with need for regulatory compliances is promoting the sales of high-precision reflectometers in the industries.
LATAM and MEA is experiencing steady growth in the spectral reflectometer market, fueled by expanding manufacturing sectors, increasing investments in semiconductor production, and rising demand for precision measurement tools in industries, such as electronics and automotive. As technology adoption grows, both regions are witnessing increased need for high-accuracy inspection systems.
Spectral Reflectometer Companies are:
The spectral reflectometer market companies Horiba Scientific, Zygo Corporation, Veeco Instruments, KLA Corporation, Keysight Technologies, Panasonic, Fujifilm Dimatix, Microptik, Filmetrics, and J.A. Woollam Co., and Others.
Recent Trends:
-
July 2024, Bruker’s FilmTek™ 2000M TSV, a fully automated metrology tool, offers nanometer-resolution film thickness measurements, critical dimension analysis, and high-aspect-ratio trench assessments, enhancing semiconductor manufacturing and advanced packaging development.
| Report Attributes | Details |
|---|---|
| Market Size in 2024 | USD 0.35 Billion |
| Market Size by 2032 | USD 0.47 Billion |
| CAGR | CAGR of 3.73% From 2025 to 2032 |
| Base Year | 2024 |
| Forecast Period | 2025-2032 |
| Historical Data | 2021-2023 |
| Report Scope & Coverage | Market Size, Segments Analysis, Competitive Landscape, Regional Analysis, DROC & SWOT Analysis, Forecast Outlook |
| Key Segments | • By Type (Single Wafer Systems and Automated Multi-Wafer Systems) • By Application (Electronics & Semiconductors, Medical, Automotive and Others) |
| Regional Analysis/Coverage | North America (US, Canada, Mexico), Europe (Germany, France, UK, Italy, Spain, Poland, Turkey, Rest of Europe), Asia Pacific (China, India, Japan, South Korea, Singapore, Australia, Rest of Asia Pacific), Middle East & Africa (UAE, Saudi Arabia, Qatar, South Africa, Rest of Middle East & Africa), Latin America (Brazil, Argentina, Rest of Latin America) |
| Company Profiles | The spectral reflectometer market companies Horiba Scientific, Zygo Corporation, Veeco Instruments, KLA Corporation, Keysight Technologies, Panasonic, Fujifilm Dimatix, Microptik, Filmetrics, and J.A. Woollam Co.and Others. |
Frequently Asked Questions
Ans: Asia-Pacific dominated the Spectral Reflectometer Market in 2024.
Ans: The “Single Wafer Systems” segment dominated the Spectral Reflectometer Market.
Ans: Key drivers of the Spectral Reflectometer Market include the growing demand for precise material analysis, advancements in industrial applications, and the increasing need for quality control in manufacturing processes.
Ans: The Spectral Reflectometer Market was USD 0.35 Billion in 2024 and is expected to Reach USD 0.47 Billion by 2032.
Ans: The Spectral Reflectometer Market is expected to grow at a CAGR of 3.73% during 2025-2032.
Get in Touch
