Synthetic Zeolites Market Size & Overview:
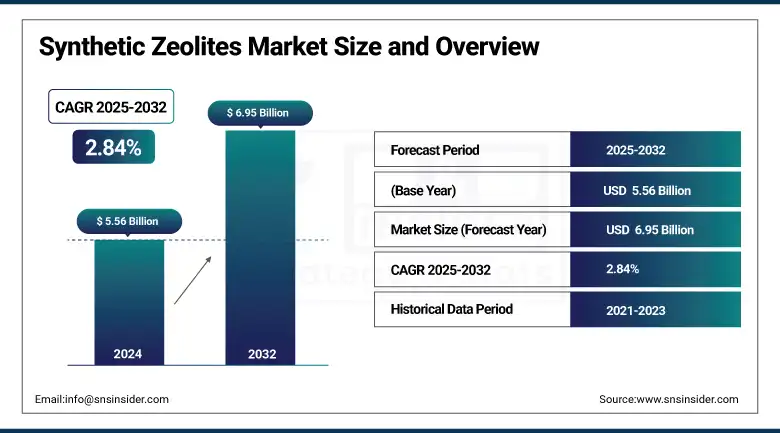
The Synthetic Zeolites Market size was valued at USD 5.56 billion in 2024 and is expected to reach USD 6.95 billion by 2032, growing at a CAGR of 2.84% over the forecast period of 2025-2032.
Growing environmental regulations and eco-efficient solutions are driving the synthetic zeolites market. Global synthetic zeolites market trends are influenced by artificial zeolite products, such as Honeywell UOP’s DACSIV, which is scaling globally for carbon capture. Catalytic cracking and superior detergents are also influential in the synthetic zeolites market growth.
To Get more information On Synthetic Zeolites Market - Request Free Sample Report
There are more than 150 known zeolite structures, with applications dominated by zeolites A, X, Y, and ZSM‑5. EPA research has determined that synthetic zeolite blends are effective at adsorbing organic and inorganic contaminants. This growth in the above-mentioned application industries is expected to boost the synthetic zeolites market share and encourage detailed synthetic zeolites market analysis. With increasing innovation being witnessed by synthetic zeolites companies, the global artificial zeolite market continues to undergo transformation, synthetic zeolites market size becoming influenced by sustainable industrial trends and regulations.
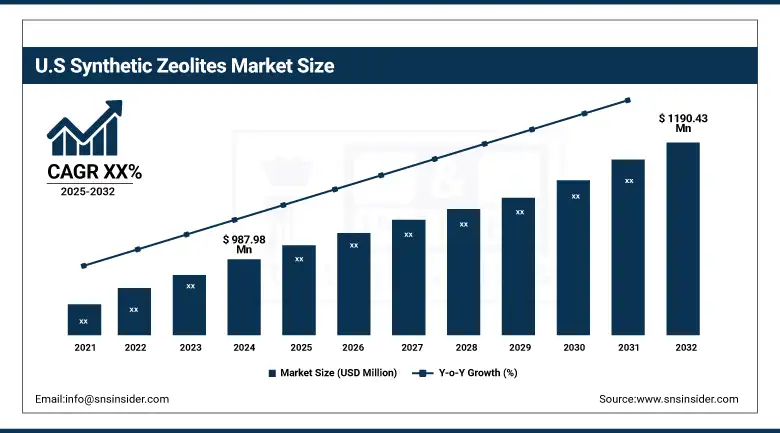
The U.S. market is valued at USD 987.98 million in 2024 and is projected to reach a value of USD 1190.43 million in 2032 with a market share of 71%. This prominence is driven by strong industrial synthetic zeolites demand in the United States, primarily for detergent and catalyst applications. The U.S. Environmental Protection Agency’s regulations encouraging phosphate-free detergents have increased the adoption of artificial zeolite alternatives. Moreover, leading synthetic zeolites companies including BASF and UOP LLC invest heavily in innovation here, further driving the synthetic zeolites market growth. Canada, with increasing industrial activities, is also a key contributor to North America’s synthetic zeolites market size and share.
Synthetic Zeolites Market Dynamics:
Drivers:
-
Escalating Regulatory Pressure on Water Contaminants Drives Demand for Industrial Synthetic Zeolites
The U.S. Environmental Protection Agency regulations for arsenic and MTBE in water have spurred the use of synthetic zeolites in filtration and water treatment. Studies by the U.S. EPA prove that ammonium-exchanged zeolite Y can effectively remove arsenate in the pH range of 2–12. Short response time and high removal efficiency characterize them as industrial synthetic zeolites for the purpose of satisfying regulations. These are the factors that will fuel the synthetic zeolite market, boosting synthetic zeolite market prospects in environmental remediation industries and increasing the market size of synthetic zeolites globally.
-
Advancements in Artificial Zeolite Coatings Enable Corrosion Resistance for Critical Infrastructure
EPA-supported work has demonstrated that synthetic zeolite coatings of the MTW, BEA, and MFI structures have shown excellent corrosion resistance for stainless steel and aluminum. These coatings are effective at both high and low pH, so they can be used in infrastructure. This new development expands the use of these synthetic zeolite companies beyond catalysis to construction and aerospace. With the broadening of multifunctional applications, the synthetic zeolites market trend will witness an uptick, making the synthetic zeolites market share rise higher in the overall zeolite industry landscape.
Restraints:
-
Regeneration and Disposal Challenges Hinder Large-scale Reuse of Synthetic Zeolite Adsorbents
Zeolite systems for air purification based on synthetic zeolites, however, require regeneration, which may lead to materials destruction and generation of secondary waste. The Environmental Protection Agency notes that, frequently, the use of pressure or temperature swing processes for regeneration has complicated the reuse. The handling of waste streams and the durability over time present a technical and regulatory issue. These constraints are a challenge to breakeven for synthetic zeolites companies to operate in an ecologically sustainable manner, and they also limit the market for synthetic zeolites in long-cycle industrial applications that depend on low-cost recycling policies.
Synthetic Zeolites Market Segmentation Analysis:
By Type
Zeolite A dominated in 2024 with a 40.2% market share, owing to its predominant use in detergent-grade applications. Sodium zeolite A continues to be the workhorse of powder detergents due to its outstanding ion-exchange ability and environmental profile. Sponsored by the USGS, it is among the most widely commercialized artificial structures. This synthetic zeolite is used space-wise as an alternative to phosphates in detergents by Henkel and Procter & Gamble, which is driving the synthetic zeolites market demand and increasing the synthetic zeolites market share in consumer goods applications.
Zeolite ZSM-5 emerged as the fastest-growing type in 2024 with an estimated CAGR of 3.82%, due to the increasing demand for petrochemical catalysts. This subsegment shows enhanced thermal stability and shape selectivity, crucial for fuel upgrading and methanol-to-gasoline processes. According to the U.S. Environmental Protection Agency, ZSM-5 has saved the U.S. refining industry annual energy efficiency and emissions reduction benefits of up to USD 16 billion, based on its use in fluid catalytic cracking. This is consistent with the values for the zeolites industry of the synthetic zeolites markets, taking sustainability as a process approach for the continuation of the green zeolite study.
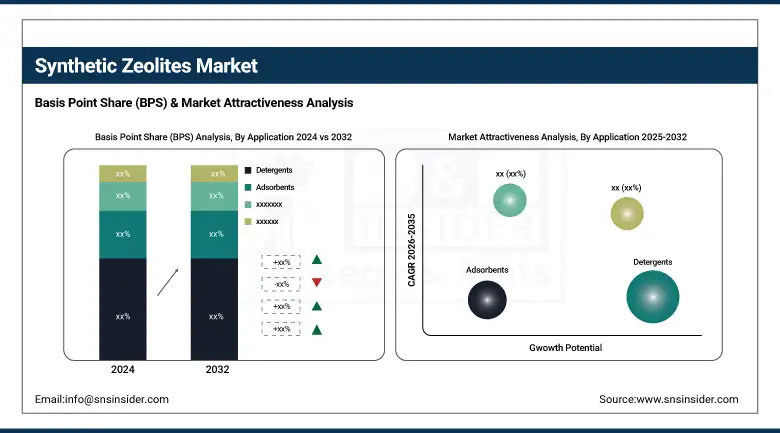
By Application
Detergents dominated in 2024 with a 45.1% market share, owing to strict environmental regulations on phosphates. Synthetic zeolites companies including BASF and Arkema provide detergent-grade zeolites that meet biodegradability standards set by the European Chemicals Agency and the U.S. EPA. These artificial zeolites enhance water softening while reducing eutrophication, increasing the synthetic zeolites market size. High-volume detergent use in North America and Europe has reinforced this application segment’s dominance in the global synthetic zeolites market analysis.
Catalysts were the fastest growing application by 2032 with a CAGR of 3.4%, driven by hydrocarbon refining subsegments. According to the U.S. Department of Energy, synthetic zeolite catalysts have been instrumental in improving refinery yields and emissions standards, especially ZSM-5 and Y-type zeolites. Industrial synthetic zeolites support cleaner fuel outputs and are critical to meeting federal emissions limits under the Clean Air Act. These trends fuel the synthetic zeolites market growth, with the catalysts segment showing significant acceleration across synthetic zeolites companies and global energy sectors.
Synthetic Zeolites Market Regional Outlook:
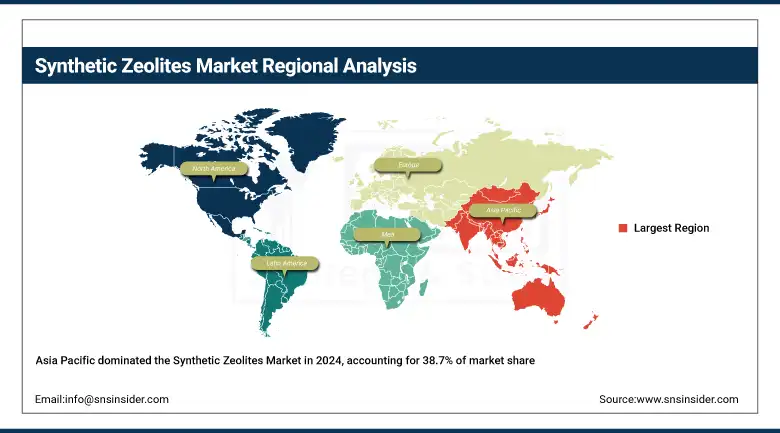
Asia Pacific is the dominating and fastest-growing region in the synthetic zeolites market in 2024, with a commanding 38.7% market share and the highest CAGR of 3.33%. This growth is fueled by rapid industrialization and expanding detergent and petrochemical sectors in China and India. The Chinese Ministry of Ecology and Environment has introduced stricter water quality norms, encouraging synthetic zeolites for wastewater treatment, which boosts market growth. India’s expanding petrochemical industry also heavily employs ZSM-5 catalysts, driving the synthetic zeolites market size. These factors place Asia Pacific at the forefront of the global zeolite industry.
Get Customized Report as per Your Business Requirement - Enquiry Now
North America holds the position as the second dominating region in the Synthetic Zeolites Market in 2024 with a significant market share of 25.1%.
Europe ranks third in the synthetic zeolites market in 2024 with a 22.4% market share, backed by stringent environmental policies in countries including Germany and France. The European Chemicals Agency’s restrictions on phosphate-based detergents have propelled artificial zeolite use, boosting the zeolite industry significantly. Germany, as the leading country, is witnessing extensive use of industrial synthetic zeolites in petrochemical refining and wastewater treatment, contributing to the synthetic zeolites market trends and analysis. Europe’s strong regulatory framework and synthetic zeolites companies’ R&D investments maintain this region’s steady synthetic zeolites market growth.
Latin America is a growing region in the synthetic zeolites market due to the rising detergent consumption and expanding petrochemical activities in Brazil and Argentina. The Brazilian Ministry of Environment supports phosphate-free detergents and increasing demand for artificial zeolites. Brazil’s growing industrial synthetic zeolite companies contribute to the zeolite industry expansion. Argentina’s petrochemical advancements also promote synthetic zeolites for catalytic applications, pushing synthetic zeolites market trends forward in the region, with a growing synthetic zeolites market share expected through the forecast period.
The Middle East & Africa are emerging in the synthetic zeolites market due to expanding oil refining and wastewater treatment projects, especially in Saudi Arabia and the UAE. The Saudi Vision 2030 initiative promotes sustainable industrial practices, further increasing artificial zeolite adoption in catalysts and adsorbents. UAE’s investments in petrochemical infrastructure similarly drive industrial synthetic zeolites demand. These developments align with the synthetic zeolites market growth and market analysis trends, supported by government-backed environmental regulations, contributing to this region’s rising synthetic zeolites market size and share.
Key Players:
The major synthetic zeolites market competitors include BASF SE, Honeywell International Inc., W. R. Grace & Co., Clariant AG, Albemarle Corporation, PQ Corporation, Tosoh Corporation, Chemiewerk Bad Köstritz GmbH (CWK), KNT Group (Silkem d.o.o.), and Shandong Xintao Technology Co., Ltd.
Recent Developments:
-
In March 2025, Researchers in Tokyo developed a novel zeolite blending technique enabling direct synthesis of CON-type zeolites with high aluminum content, offering smaller particles and improved performance for catalytic and environmental applications.
-
In October 2024, Zeotech secured a Japanese patent for its proprietary method of converting kaolin into high-purity synthetic zeolites, strengthening its position in Japan’s molecular sieve market and planning further international patent expansion.
| Report Attributes | Details |
|---|---|
| Market Size in 2024 | USD 5.56 billion |
| Market Size by 2032 | USD 6.95 billion |
| CAGR | CAGR of 2.84% From 2025 to 2032 |
| Base Year | 2024 |
| Forecast Period | 2025-2032 |
| Historical Data | 2021-2023 |
| Report Scope & Coverage | Market Size, Segments Analysis, Competitive Landscape, Regional Analysis, DROC & SWOT Analysis, Forecast Outlook |
| Key Segments | •By Type (Zeolite A, Type X, Type Y, Zeolite ZSM 5, Others) •By Application (Detergents, Adsorbents, Catalysts, Others) |
| Regional Analysis/Coverage | North America (US, Canada, Mexico), Europe (Germany, France, UK, Italy, Spain, Poland, Turkey, Rest of Europe), Asia Pacific (China, India, Japan, South Korea, Singapore, Australia, Rest of Asia Pacific), Middle East & Africa (UAE, Saudi Arabia, Qatar, South Africa, Rest of Middle East & Africa), Latin America (Brazil, Argentina, Rest of Latin America) |
| Company Profiles | BASF SE, Honeywell International Inc., W. R. Grace & Co., Clariant AG, Albemarle Corporation, PQ Corporation, Tosoh Corporation, Chemiewerk Bad Köstritz GmbH (CWK), KNT Group (Silkem d.o.o.), and Shandong Xintao Technology Co., Ltd. |
Frequently Asked Questions
Leading synthetic zeolites companies include BASF, Honeywell UOP, Clariant, PQ Corporation, and Tosoh, driving global artificial zeolite innovation.
Asia Pacific leads the synthetic zeolites market with a 38.7% share and the highest CAGR, driven by demand in China and India.
Zeolite A dominated the synthetic zeolites market with a 40.2% share due to widespread detergent applications in major global markets.
Detergents dominated the synthetic zeolites market with a 45.1% share due to strict phosphate regulations in the US and Europe.
The synthetic zeolites market size was valued at USD 5.56 billion in 2024, driven by demand in detergents and catalyst applications.
Get in Touch
