Taste Modulators Market Size & Trends
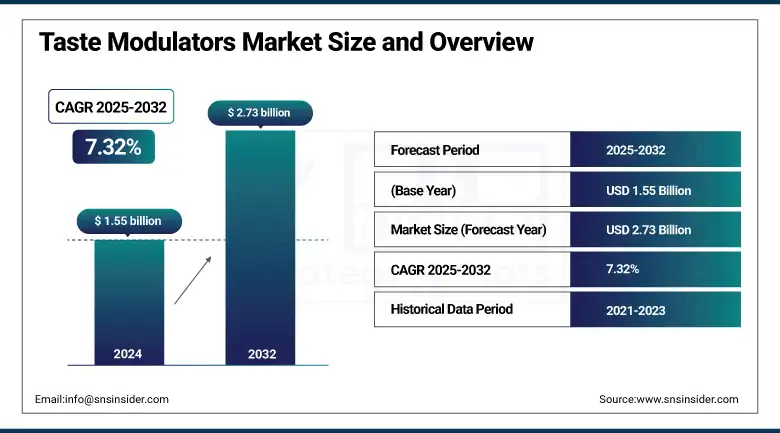
The Taste Modulators Market size was valued at USD 1.55 billion in 2024 and is expected to reach USD 2.73 billion by 2032, growing at a CAGR of 7.32% over the forecast period of 2025-2032.
The taste modulators market is driven by rising demand for natural flavor modulators, sugar reduction solutions, and salt reduction ingredients across the food and beverage industry. Leading taste modulators companies are investing in bitter blocker technologies, taste masking agents, and taste-enhancing additives, fueling growth and shaping taste modulators market trends. Functional food ingredients increasingly feature innovative flavor modulators supporting cleaner labels and healthier low-sugar, low-sodium options.
Taste Modulators Market Size and Forecast
-
Market Size in 2024: USD 1.55 Billion
-
Market Size by 2032: USD 2.73 Billion
-
CAGR: 7.32% from 2025 to 2032
-
Base Year: 2024
-
Forecast Period: 2025–2032
-
Historical Data: 2020–2023
To Get more information On Taste Modulators Market - Request Free Sample Report
Taste Modulators Market Trends
-
Rising demand for sugar reduction in food & beverages is driving adoption of taste modulators, with over 65% of consumers seeking low-sugar products and reformulation activity growing at ~8–10% annually.
-
Increasing focus on salt reduction in processed foods is boosting usage, as manufacturers aim to cut sodium content by 20–30% without compromising taste.
-
Growth in functional and fortified foods is expanding demand, with the segment accounting for over 40% of new product launches utilizing taste masking solutions.
-
Rapid expansion of plant-based foods and beverages is fueling need for bitterness blockers, with the plant-based market growing at over 12% CAGR globally.
-
Advancements in natural and clean-label taste modulators are gaining traction, with over 55% of new formulations shifting toward natural ingredient-based solutions.
According to the U.S. FDA, over 15 GRAS notices, including GRN 764 for high-purity steviol glycosides, demonstrate regulatory momentum influencing the taste modulators market size. In July 2025, DSM-Firmenich launched ModulaSENSE maskers addressing bitterness and astringency, strengthening its presence in taste modulators market analysis and boosting market share through direct sales. Together, these developments reflect strategic adaptation by manufacturers to meet evolving global consumer demands for health-focused, functional taste solutions.
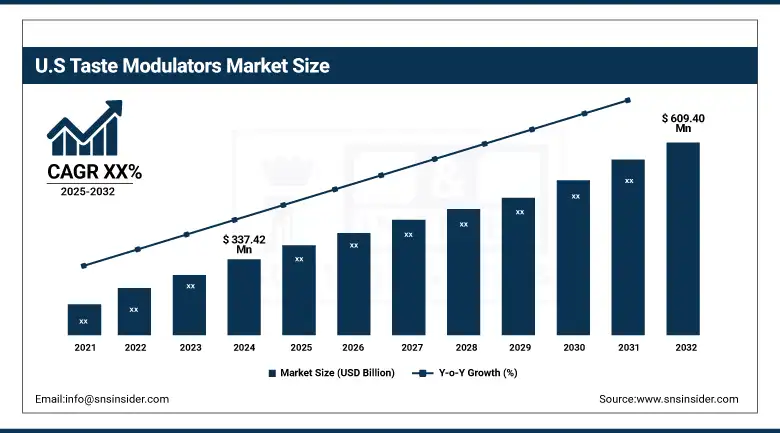
The U.S. dominates in North America’s taste modulators market size with a value of USD 337.42 million, holding a market share of about 80% in 2024 and is projected to reach a value of USD 609.40 million by 2032, driven by FDA-backed approvals of new taste modulators and functional food ingredients. Recent press releases from DSM-Firmenich and Kerry Group highlight product launches targeting reduced-sugar beverages and fortified snacks, boosting market share. The U.S. Department of Agriculture (USDA) reports increasing demand for natural flavor modulators and taste masking agents, supported by national sugar reduction campaigns. Major taste modulators companies actively invest in local production and clean-label innovations, strengthening the country’s leadership in delivering health-focused taste-enhancing additives to consumers.
Taste Modulators Market Dynamics
Drivers:
-
Rising Partnerships Between Biotech Firms and Food Brands Drive New Flavor Modulators Launches
Taste modulators market growth is supported by collaborations introducing advanced flavor modulators and taste-enhancing additives in functional food ingredients. In 2025, Blue California partnered with IFF to develop innovative sugar reduction solutions and salt reduction ingredients for dairy, strengthening the taste modulators market. These alliances reflect evolving taste modulators market trends, meeting consumer demand for healthier choices. They also help taste modulators companies quickly expand portfolios within the food and beverage industry, aligning with global clean-label strategies and regulatory compliance.
-
Growing Focus on Child Nutrition Spurs Demand for Taste Masking Agents in Supplements
Taste modulators companies experience higher demand for taste masking agents and bitter blocker technologies in pediatric supplements, boosting market growth. In April 2025, Ajinomoto launched a natural flavor modulators series for syrups and gummies, highlighting trends. This launch strengthens functional food ingredients portfolios, targeting parents seeking palatable, healthier options supported by sugar reduction solutions. As consumer awareness grows, these developments help taste modulators companies gain taste modulators market share in nutritional products tailored for children’s preferences.
Restraints:
-
Supply Constraints of Specialty Fermentation Strains Limit Production of Advanced Taste Modulators
Despite rising demand, limited global capacity for specialty fermentation strains constrains production of natural flavor modulators, taste-enhancing additives, and bitter blocker technologies. In February 2025, ADM noted fermentation strain shortages impacting timelines for new salt reduction ingredients, slowing taste modulators market growth. These supply challenges affect product rollouts in the food and beverage industry, restricting taste modulators companies’ ability to expand quickly. As a result, the industry sees moderate share gains, especially among smaller firms without large-scale production resources.
Taste Modulators Market Segmentation Analysis
By Source
Natural modulators held a dominant taste modulators market share of 62.3% in 2024 due to rising demand for clean-label and plant-based solutions. FDA’s GRAS approval of high-purity steviol glycosides supports sugar reduction solutions and natural flavor modulators adoption. Companies like Cargill boost production capacity to meet functional food ingredients demand, while consumer trends favor sustainable, minimally processed taste-enhancing additives. This strengthens natural modulators’ position in the food and beverage industry, reflecting growing health awareness and regulatory support.
However, natural modulators are also the fastest growing segment with a projected CAGR of 7.36%, driven by advances in fermentation and biotechnology. Cargill’s new fermentation facility improves scalability of natural bitter blocker technologies and salt reduction ingredients. Industry associations highlight the role of taste masking agents in healthier food innovations. These developments align with regulatory priorities, consumer preference for natural solutions, and taste modulators companies’ expansion into snacks and beverages, ensuring stronger global taste modulators market growth.
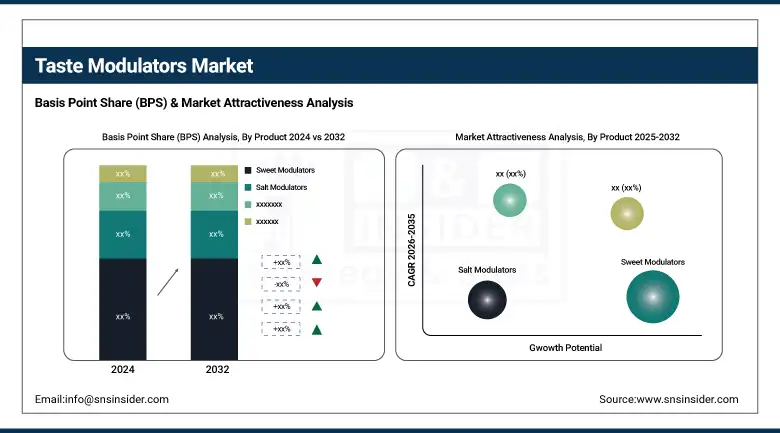
By Product
Sweet modulators held a dominant taste modulators market share of 47.8% in 2024 due to strong demand for sugar reduction solutions and taste masking agents. FDA approvals of natural sweeteners like steviol glycosides support cleaner labels. Companies such as Ajinomoto lead innovations to enhance taste profiles in reduced-sugar products, particularly in beverages and confectionery. This aligns with broader consumer trends favoring healthier choices and supports taste modulators companies’ leadership across functional food ingredients and the food and beverage industry.
Additionally, sweet modulators are also the fastest growing product category with an expected CAGR of 7.48%, driven by rising demand for low-calorie foods. New bitter blocker technologies improve product acceptance, encouraging manufacturers to reformulate with less sugar. Ajinomoto’s product innovations expand sweet modulators use in functional beverages. Associations report consumers increasingly seek balanced taste and reduced sugar content, supporting sustained taste modulators market growth and broader adoption of flavor modulators globally.
By Form
Powder modulators held a dominant taste modulators market share of 56.6% in 2024 due to stability and easy integration into dry applications. Tate & Lyle’s powdered natural flavor modulators fit snacks, cereals, and baking products well, aligning with clean-label trends. Extended shelf life and cost-effective bulk handling further support widespread use. These advantages make powdered taste-enhancing additives the preferred choice across manufacturers in the food and beverage industry, supporting continued dominance.
Liquid modulators are the fastest growing form with an estimated CAGR of 7.38%, driven by demand for functional drinks and supplements. Liquid bitter blocker technologies and salt reduction ingredients blend seamlessly into beverages, improving flavor. Industry innovation and regulatory support for natural liquid flavor modulators help broaden applications. This aligns with consumer trends favoring healthier beverage options, encouraging taste modulators companies to expand liquid portfolios and enhance taste modulators market growth.
By End-use
Beverages held a dominant taste modulators market share of 51.5% in 2024 due to demand for low-calorie drinks supported by sugar reduction solutions. PepsiCo’s use of bitter blocker technologies improved taste profiles, while FDA’s approval of natural flavor modulators supported launches. The beverage industry’s health-driven reformulations keep taste modulators essential, reinforcing leadership within functional food ingredients and the broader food and beverage industry.
Moreover, beverages are even the fastest growing end-use segment with a projected CAGR of 7.45%, driven by rising consumer preference for healthier drinks. Functional beverage development uses taste masking agents and taste-enhancing additives to reduce sugar content without compromising flavor. PepsiCo’s R&D investments and partnerships with taste modulators companies support innovation. Associations highlight beverages as key to future market growth, aligning with evolving dietary trends and taste modulators market expansion.
By Distribution Channel
Direct sales held a dominant taste modulators market share of 73.3% in 2024 due to direct client collaboration and customization. DSM-Firmenich’s digital sales tools allow rapid delivery of flavor modulators, bitter blocker technologies, and sugar reduction solutions tailored to manufacturer needs. This supports clean-label trends and helps taste modulators companies react quickly to food and beverage industry demands, ensuring sustained leadership through efficient, personalized service models.
Online retail is the fastest growing distribution channel with a forecast CAGR of 7.97%, driven by e-commerce expansion. Direct-to-consumer platforms increase access to taste masking agents and salt reduction ingredients. Industry associations note digital channels help small producers reach broader markets, while regulatory clarity supports product listings. This shift reflects evolving purchasing habits, encouraging taste modulators companies to diversify online presence and boost global taste modulators market growth.
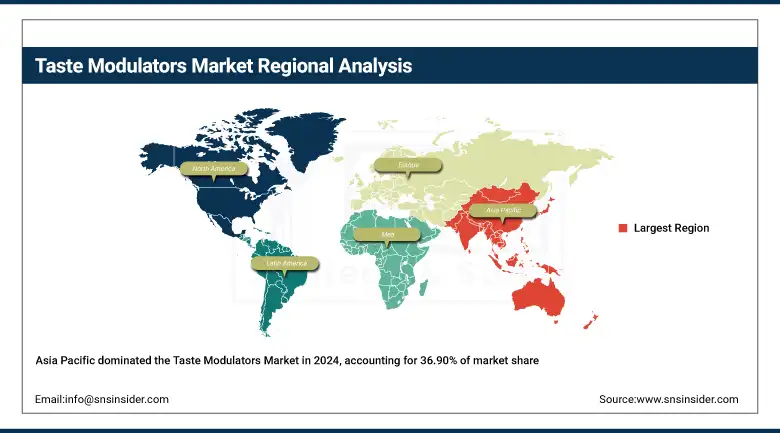
Taste Modulators Market Regional Outlook
Asia Pacific dominated the taste modulators market in 2024 with a significant market share of 36.90%, fueled by consumer demand for sugar reduction solutions and clean-label functional beverages. China leads regional growth with government-backed health campaigns encouraging natural flavor modulators, while Japan sees innovation in bitter blocker technologies in sports drinks. Companies including Ajinomoto and Givaudan expand taste modulators market share by launching locally tailored taste-enhancing additives, strengthening their footprint across diverse food and beverage industry applications.
Get Customized Report as per Your Business Requirement - Enquiry Now
North America is the fastest-growing region in the Taste Modulators Market, projected to achieve a market share of around 28.6%, fueled by rising demand for natural flavor modulators, taste masking agents, and sugar reduction solutions across beverages and functional foods. Industry trends reflect increasing adoption of salt reduction ingredients and bitter blocker technologies in dairy and snack segments. According to the North American Food Ingredients Association, companies like Cargill and ADM are investing in local R&D centers to expand taste-enhancing additives portfolios, aligning with consumer preference for clean-label products and health-driven innovations in the food and beverage industry.
Taste Modulators Market Key Players
The major taste modulators market competitors include Givaudan SA, DSM-Firmenich AG, International Flavors & Fragrances Inc. (IFF), Kerry Group plc, Ingredion Incorporated, Symrise AG, Sensient Technologies Corporation, Tate & Lyle PLC, Cargill, Incorporated, Takasago International Corporation, Archer Daniels Midland Company (ADM), Corbion N.V., Mane SA, Ajinomoto Co., Inc., Döhler GmbH, Icon Foods, Synergy Flavors Inc., Flavorchem Corporation, Blue California, and Senomyx (now DSM-Firmenich)
Recent Developments in the Taste Modulators Market
-
In July 2025, DSM‑Firmenich launched ModulaSENSE maskers for plant‑based drinks and bars, targeting bitterness and astringency at a molecular level
-
In January 2025, Cargill announced investments in 3D printing and mycoprotein fermentation technologies to solve taste and texture challenges in alternative proteins
| Report Attributes | Details |
|---|---|
| Market Size in 2024 | USD 1.55 billion |
| Market Size by 2032 | USD 2.73 billion |
| CAGR | CAGR of 7.32% From 2025 to 2032 |
| Base Year | 2024 |
| Forecast Period | 2025-2032 |
| Historical Data | 2021-2023 |
| Report Scope & Coverage | Market Size, Segments Analysis, Competitive Landscape, Regional Analysis, DROC & SWOT Analysis, Forecast Outlook |
| Key Segments | •By Source (Natural, Synthetic) •By Product (Sweet Modulators, Salt Modulators, Fat Modulators, Others) •By Form (Powder, Liquid) •By End-use (Food, Beverages, Pharmaceuticals, Others) •By Distribution Channel (Online Retail, Offline Retail, Direct Sales) |
| Regional Analysis/Coverage | North America (US, Canada, Mexico), Europe (Germany, France, UK, Italy, Spain, Poland, Turkey, Rest of Europe), Asia Pacific (China, India, Japan, South Korea, Singapore, Australia, Rest of Asia Pacific), Middle East & Africa (UAE, Saudi Arabia, Qatar, South Africa, Rest of Middle East & Africa), Latin America (Brazil, Argentina, Rest of Latin America) |
| Company Profiles | Givaudan SA, DSM-Firmenich AG, International Flavors & Fragrances Inc. (IFF), Kerry Group plc, Ingredion Incorporated, Symrise AG, Sensient Technologies Corporation, Tate & Lyle PLC, Cargill, Incorporated, Takasago International Corporation, Archer Daniels Midland Company (ADM), Corbion N.V., Mane SA, Ajinomoto Co., Inc., Döhler GmbH, Icon Foods, Synergy Flavors Inc., Flavorchem Corporation, Blue California, and Senomyx (now DSM-Firmenich) |
Frequently Asked Questions
Asia Pacific dominates with a 36.90% market share; North America is fastest-growing, supported by FDA-approved natural modulators and functional beverages.
Sweet modulators, salt reduction ingredients, bitter blocker technologies, and taste-enhancing additives improve flavor in low-sugar, low-sodium functional foods.
Advances in fermentation and clean-label taste masking agents offer growth in sports drinks, dairy, and pediatric nutrition segments.
Rising demand for natural flavor modulators, sugar reduction solutions, and bitter blocker technologies fuels adoption in functional drinks and healthier snacks.
The Taste Modulators Market size was valued at USD 1.55 billion in 2024 and is projected to reach USD 2.73 billion by 2032.
Get in Touch
