Paraxylene Market Report Scope & Overview:
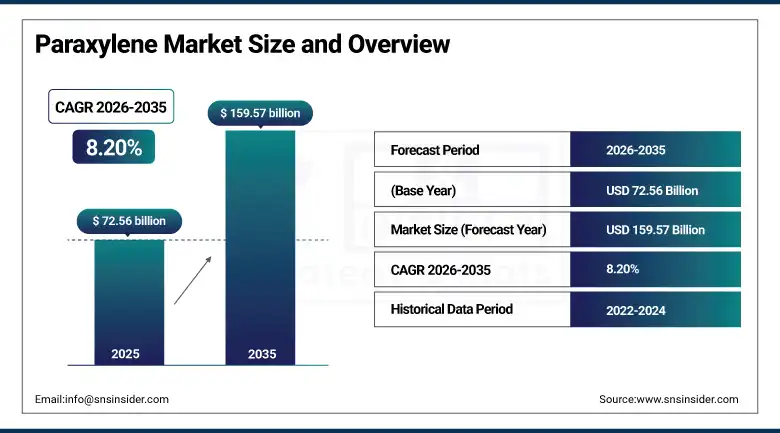
The paraxylene market was valued at USD 72.56 billion in 2025 and is expected to reach USD 159.57 billion by 2035, growing at a CAGR of 8.20% from 2026 to 2035.
There have been significant developments in the paraxylene market, primarily because of the increasing demand for paraxylene from various end-user industries including the textile industry, packaging industry, and plastic industry. Paraxylene finds extensive applications in the manufacture of Purified Terephthalic Acid (PTA), which is used in the manufacture of polyester fiber and Polyethylene Terephthalate (PET). Growing usage of PET bottles and containers in the food and beverage industry is anticipated to drive demand for paraxylene. Development of catalytic reforming technology and energy efficient separation technology will add to efficiency. Urbanization, growth in fast moving consumer goods, and increasing demand for recyclable packaging materials will also increase demand for paraxylene.
In Q2 2024, Reliance Industries built a new paraxylene plant at their Jamnagar refinery, thereby adding about 2 million tons per annum PX production capacity to cater to growing polyester demand.
Market Size and Forecast
-
Market Size in 2026E: USD 78.51 Billion
-
Market Size by 2035: USD 159.57 Billion
-
CAGR: 8.20% from 2026 to 2035
-
Fastest Growing Region: Asia Pacific
-
Largest Region: Asia Pacific
To Get more information On Paraxylene Market - Request Free Sample Report
Paraxylene Market Trends
-
Increasing demand for polyester fibers and PET resins across the globe is driving the demand for paraxylene globally.
-
Increasing use of bio-paraxylene in the production of bio-based plastic PET bottles and sustainable packaging solutions has become an emerging market trend.
-
Expanding capacity of paraxylene production in regions such as Asia (China & India) and the Middle East has led to a shift in dynamics within the global paraxylene market.
-
The increasing trend of refinery integration and paraxylene separation via adsorption is making production more cost-effective.
-
The increasing trend of circular plastics and chemical recycling techniques has opened up new opportunities in the production of paraxylene.
U.S. Paraxylene Market Size Outlook
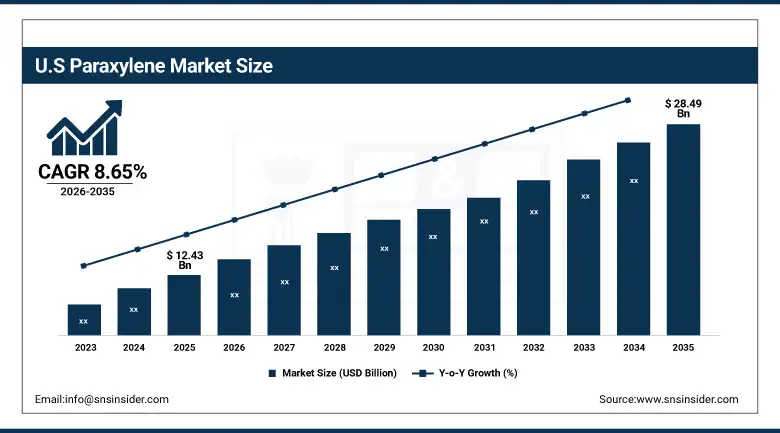
The U.S. paraxylene market was valued at USD 12.43 billion in 2025 and is expected to reach USD 28.49 billion by 2035, growing at a CAGR of 8.65% from 2026 to 2035.
The paraxylene industry in the United States enjoys good downstream demand from polyester and PET applications, excellent refining capabilities, and license agreements with large technology suppliers. ExxonMobil restarted its paraxylene operations in the Beaumont, Texas plant in February 2024, thus providing substantial extra capacity needed to meet growing demand. Growing awareness concerning sustainability issues is driving the demand for bio-pet, thus enlarging the potential market for paraxylene. The U.S. Gulf Coast remains the main center of production, where companies upgrade their catalysts and acquire licenses for new technologies to stay ahead of the competition in the global environment.
In February 2024, ExxonMobil restarted paraxylene production in its Beaumont, Texas plant, increasing capacity by around 315,000 tonnes per annum, thereby emphasizing the significance of the U.S. Gulf Coast in meeting domestic and export polyester chain requirements.
Paraxylene Market Segment Analysis
-
By Application, Dimethyl Terephthalate (DMT) segment dominated the Paraxylene Market in 2025 with approximately 78.6% share; Purified Terephthalic Acid (PTA) segment fastest growing.
-
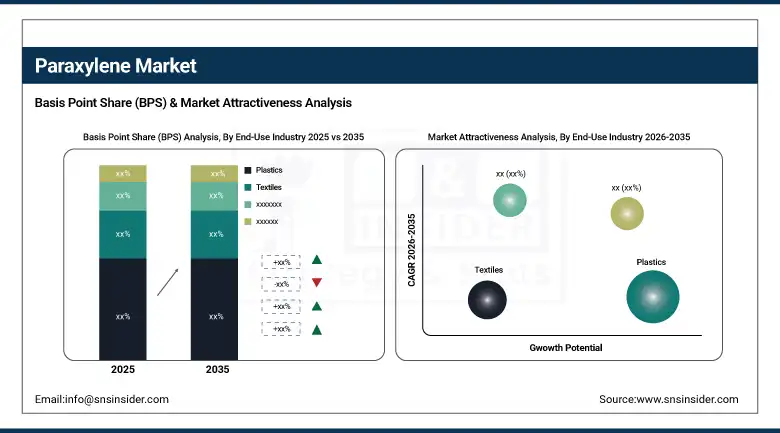
By End-Use Industry, Plastics segment dominated the Paraxylene Market in 2025 with approximately 68.1% share; Textiles segment fastest growing.
-
By Manufacturing Process, Catalytic Reforming segment dominated the Paraxylene Market in 2025; Toluene Disproportionation segment fastest growing.
By Application, DMT segment dominates the paraxylene market, PTA segment expected to grow fastest
The Dimethyl Terephthalate (DMT) segment is expected to lead the paraxylene market in 2025 owing to its prominence as an intermediate chemical widely utilized in the production of polyester fibers, resins, and films. Paraxylene acts as a vital input in the production of DMT, which finds wide usage in textile and packaging applications. The rising demand for lightweight, sturdy, and recyclable polyester products in both developed and developing countries, particularly in Asia Pacific where polyester production is highly concentrated, has maintained the dominance of the DMT segment in the paraxylene market structure.
The Purified Terephthalic Acid (PTA) segment is projected to be the fastest growing in the paraxylene market in the coming years on account of the rapid capacity addition in the production of PTA in Asia Pacific, including China and India, to cater to growing demand for polyester and PET downstreams. PTA-based polyester fibers and PET resins are used extensively in clothing, packaging, and industrial fabrics. The growing world population, urbanization trend, and the fast fashion industry are continually increasing the demand for PTA-based polyester products. Moreover, bio-PTA production projects from bio-paraxylene are gaining traction among companies owing to their circular economy approach.
By End-Use Industry, Plastics segment dominates the paraxylene market, Textiles segment expected to grow fastest
The plastics segment accounted for the largest share of the paraxylene market in 2025 due to increasing worldwide demand for packaging materials made using PET resin. The use of lightweight, non-breakable, and recyclable PET makes it highly suitable for packaging of beverages, foods, and consumer goods. Growing e-commerce, rapid growth of fast-moving consumer goods markets in Asia, and rise in ready-to-eat food and convenient packaging trend are consistently driving paraxylene demand in the form of plastics. Paraxylene is being increasingly used in large volumes as a feedstock in the production of PTA-PET through integrated production chains.
Textile is the fastest growing end-use industry in the paraxylene market owing to growing global production of polyester fibers attributed to rising demand for apparels, the rising popularity of athleisure wear, and increasing use of synthetic fabrics in home furnishings and industrial textiles. China is the biggest producer of polyester fibers accounting for over 65% of global polyester fiber production. Other significant producers of polyester fibers include South Korea, India, and other countries in Southeast Asia. Polyester fabric's durability, affordability, and ease of maintenance are increasing the demand for PTA derived from paraxylene. Recycled polyester from PET waste is also supporting circular production systems.
By Manufacturing Process, Catalytic Reforming segment dominates the paraxylene market, Toluene Disproportionation segment expected to grow fastest
Catalytic Reforming segment held a leading share in the paraxylene market in 2025 due to wide acceptance as the most popular manufacturing process for generating mixed xylenes and paraxylene from naphtha. Catalytic reforming has been used extensively in major petrochemical complexes in Asia Pacific, North America, and the Middle East. This manufacturing process has benefited from years of technological improvements and economy of scale advantages. Catalytic reforming will remain dominant in the coming years due to consistent improvements in catalyst effectiveness and energy efficiency, which increase its commercial viability as the manufacturing process for large-volume paraxylene production.
Toluene Disproportionation segment will witness the highest growth rate among all manufacturing processes in the global paraxylene market due to increasing use as an effective method of producing paraxylene and benzene from toluene feedstock. The manufacturing process provides feedstock flexibility and is more attractive for reducing dependency on naphtha feedstock and maximizing aromatics yield. Increasing investments in integrated aromatics complexes and rising demand for benzene in the specialty chemicals industry will boost the adoption of toluene disproportionation. Advancements in conversion efficiency and selectivity of the manufacturing process will drive its adoption, especially in emerging Asian countries that are expanding their PX production capacities.
Regional Analysis
|
Region |
Major Country |
Share within Region, 2025 (%) |
|---|---|---|
|
North America |
United States |
87.4% |
|
Europe |
Germany |
22.3% |
|
Asia Pacific |
China |
61.7% |
|
Middle East & Africa |
Saudi Arabia |
38.4% |
|
Latin America |
Brazil |
44.2% |
North America Paraxylene Market Insights
The North American market for paraxylene enjoys strong support from an existing production capacity infrastructure located mainly along the Gulf Coast region of the United States and a rising downstream demand in packaging and the automotive industries. The North American market has been gaining strength through its defensive tariff structure vis-a-vis Chinese PTA imports and the presence of integrated companies like ExxonMobil and Chevron Phillips Chemicals. The growing use of bio-based PET in consumer packaging and rising demand in the automotive industry for lightweight parts made out of PET are opening up new applications.
Get Customized Report as per Your Business Requirement - Enquiry Now
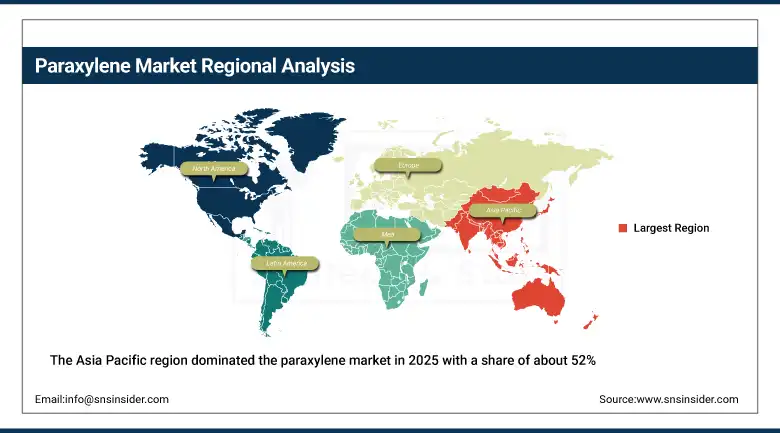
Asia Pacific Paraxylene Market Insights
The Asia Pacific region dominated the paraxylene market in 2025 with a share of about 52%. This is because the region has a robust industry for polyester and PET resins, especially in countries like China, India, South Korea, and Japan. Paraxylene is an important input used in the manufacture of PTA and DMT, which are used in the manufacture of clothing and packaging materials in very large quantities. Urbanization trends, growing consumer spending power, and growing demand for food and beverages have been boosting the usage of paraxylene. China has major refineries that dominate the production capacity in the region, while South Korea and India are major producers and exporters.
Europe Paraxylene Market Insights
Europe paraxylene market will face structural pressures due to the trend of refining rationalization in Europe where there will be increased biofuel production at the expense of aromatics production. Nevertheless, continued downstream demand from the textile industry, packaging industry, and specialty polymer industry will continue to fuel paraxylene consumption through imports. The EU sustainability policy and increasing use of recycled PET presents an opportunity for bio-paraxylene and recycled paraxylene. Germany and the Netherlands will still represent important markets for paraxylene, owing to the considerable polyester and PET production capacity of specialty chemicals producers.
Middle East & Africa and Latin America Paraxylene Market Insights
Middle East & Africa Paraxylene Market is rapidly becoming one of the fastest-growing markets due to its rich hydrocarbons and investments made in establishing integrated petrochemical complexes in countries like Saudi Arabia, the United Arab Emirates, and Qatar. The construction of massive complexes in partnerships between Aramco and other major international firms is enhancing paraxylene production capabilities in the region and positioning it as an important exporter of paraxylene to the Asian and European markets. Latin America Paraxylene Market, spearheaded by Brazil, is experiencing steady growth due to growth in packaging and textile industries in the country and increased consumption of polyesters in the region.
Market Dynamics
Growth Drivers: Rising PET and polyester demand fuels growth in the global paraxylene industry across packaging, textile, and consumer goods sectors
The worldwide increase in the manufacturing of polyester fiber and consumption of PET resins is the key factor behind the growth of the paraxylene industry. With its low weight, recyclability, and economical nature, PET resin is used to manufacture beverage bottles, food packaging, synthetic fibers, household textiles, and other industrial fabrics. The rapid development of the e-commerce sector, along with fast-growing markets of fast-moving consumer goods and urbanization in Africa, Asia, and Latin America, is contributing to the steady increase in the consumption volumes of paraxylene. The demand for this product is being driven by developing countries due to improved living standards that lead to increased consumption of packaged goods and synthetic textiles. The expansion of petrochemical plants in Asia and the Middle East, along with innovations in catalytic reforming and PX separation processes, is also contributing to reduced production costs and increased paraxylene capacities worldwide.
Restraints: Volatile crude oil and naphtha feedstock prices are creating cost uncertainty and margin pressure across global paraxylene production operations
The production of paraxylene is largely reliant on the use of naphtha and petrochemicals obtained through crude oil, thus making the economics of production very susceptible to changes in the international oil price levels. Any significant increase in the cost of production materials will have a direct impact on profitability, while at the same time affecting the stability of prices within the downstream sectors such as PTA and PET manufacturing. Unstable trade policies in relation to the imposition of petrochemical tariffs and other restrictions may further affect the stability of pricing. Restrictions on the production of aromatics in refineries in Europe due to environmental legislation have been limiting domestic supplies, thus increasing dependence on imports.
Opportunities: Growing adoption of bio-based paraxylene and chemical recycling technologies is opening new pathways for sustainable polyester supply chains globally
Sustainability is becoming one of the most important topics in the world today, resulting in huge attention towards the possibility of making bio-paraxylene from renewable resources a commercially viable alternative to the petroleum-based PX. Big companies like Indorama Ventures, Neste, and Lotte Chemical have invested in developing their bio-PET value chain by utilizing bio-paraxylene in order to reduce the carbon footprint associated with polyester production. Commercializing the world's first ever bio-PET bottle developed by Indorama Ventures in collaboration with Suntory, ENEOS, and Mitsubishi Corporation in October 2024 demonstrated the potential of the concept. Another strategy is chemical recycling, whereby paraxylene equivalents are extracted from discarded PET bottles via an advanced technique. Increased requirements for recycling content in packaging material in Europe and North America are fueling innovation in the advanced recycling industry.
Recent Developments:
-
2025: The new paraxylene unit of Hengli Petrochemical in Dalian became operational, providing an additional capacity of 1.5 million tons per year, boosting the producer’s position among top manufacturers of PX in China and adding to the already dominant position of Asia Pacific in global PX production.
-
2025: Reliance Industries signed a long-term contract for exporting paraxylene to a large European textile company, making it the company’s largest export of PX ever recorded and a reflection of the increasing international trade of PX from Asian producers to European customers.
-
2024: INEOS and Saudi Aramco established a joint venture with the intention of building a paraxylene manufacturing unit in Jubail, Saudi Arabia, designed to cater to both regional and global polyester industry needs and to increase the presence of the Middle East in the global PX market.
-
2024: Indorama Ventures introduced the world’s first commercial PET bottle manufactured from bio-paraxylene ISCC+ certified, in cooperation with Suntory, ENEOS Corporation, Mitsubishi Corporation, Iwatani, and Neste.
Paraxylene Market Companies are:
-
ExxonMobil
-
BASF
-
Sinopec
-
Reliance Industries
-
Honeywell UOP
-
Formosa Plastics
-
Chevron Phillips Chemical
-
Hengli Petrochemical
-
SK Innovation
-
Lotte Chemical
-
INEOS
-
Saudi Aramco
-
PetroChina
-
Indorama Ventures
-
SABIC
-
Toray Industries
-
BP
-
Shell
-
Neste
-
Indian Oil Corporation
Paraxylene Market Report Scope:
| Report Attributes | Details |
|---|---|
| Market Size in 2025 | USD 72.56 Billion |
| Market Size by 2035 | USD 159.57 Billion |
| CAGR | CAGR of 8.20% From 2026 to 2035 |
| Base Year | 2025 |
| Forecast Period | 2026-2035 |
| Historical Data | 2022-2024 |
| Report Scope & Coverage | Market Size, Segments Analysis, Competitive Landscape, Regional Analysis, DROC & SWOT Analysis, Forecast Outlook |
| Key Segments | • By Application (Purified Terephthalic Acid (PTA), Dimethyl Terephthalate (DMT), Others) • By End-Use Industry (Textiles, Plastics, Others) • By Manufacturing Process (Catalytic Reforming, Toluene Disproportionation, Others) |
| Regional Analysis/Coverage | North America (US, Canada, Mexico), Europe (Eastern Europe [Poland, Romania, Hungary, Turkey, Rest of Eastern Europe] Western Europe] Germany, France, UK, Italy, Spain, Netherlands, Switzerland, Austria, Rest of Western Europe]), Asia Pacific (China, India, Japan, South Korea, Vietnam, Singapore, Australia, Rest of Asia Pacific), Middle East & Africa (Middle East [UAE, Egypt, Saudi Arabia, Qatar, Rest of Middle East], Africa [Nigeria, South Africa, Rest of Africa], Latin America (Brazil, Argentina, Colombia, Rest of Latin America) |
| Company Profiles | ExxonMobil, BASF, Sinopec, Reliance Industries, Honeywell UOP, Formosa Plastics, Chevron Phillips Chemical, Hengli Petrochemical, SK Innovation, Lotte Chemical, INEOS, Saudi Aramco, PetroChina, Indorama Ventures, SABIC, Toray Industries, BP, Shell, Neste, Indian Oil Corporation |
Frequently Asked Questions
Asia Pacific dominated the Paraxylene Market in 2025.
The Dimethyl Terephthalate (DMT) segment dominated the Paraxylene Market in 2025.
The Paraxylene Market was valued at USD 72.56 billion in 2025.
Rising PET and polyester demand fuels growth in the global paraxylene industry across packaging, textile, and consumer goods sectors.
The Paraxylene Market is expected to grow at a CAGR of 8.20% from 2026 to 2035.
Get in Touch
